

Effect of the land area elevation on the collective choice in ants
- PMID: 28821811
- PMCID: PMC5562813
- DOI: 10.1038/s41598-017-08592-9
Effect of the land area elevation on the collective choice in ants
Abstract
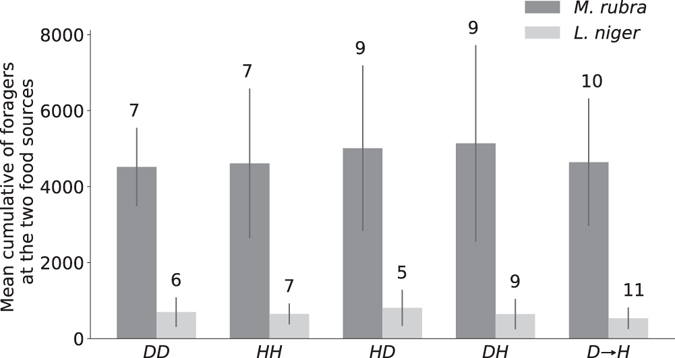
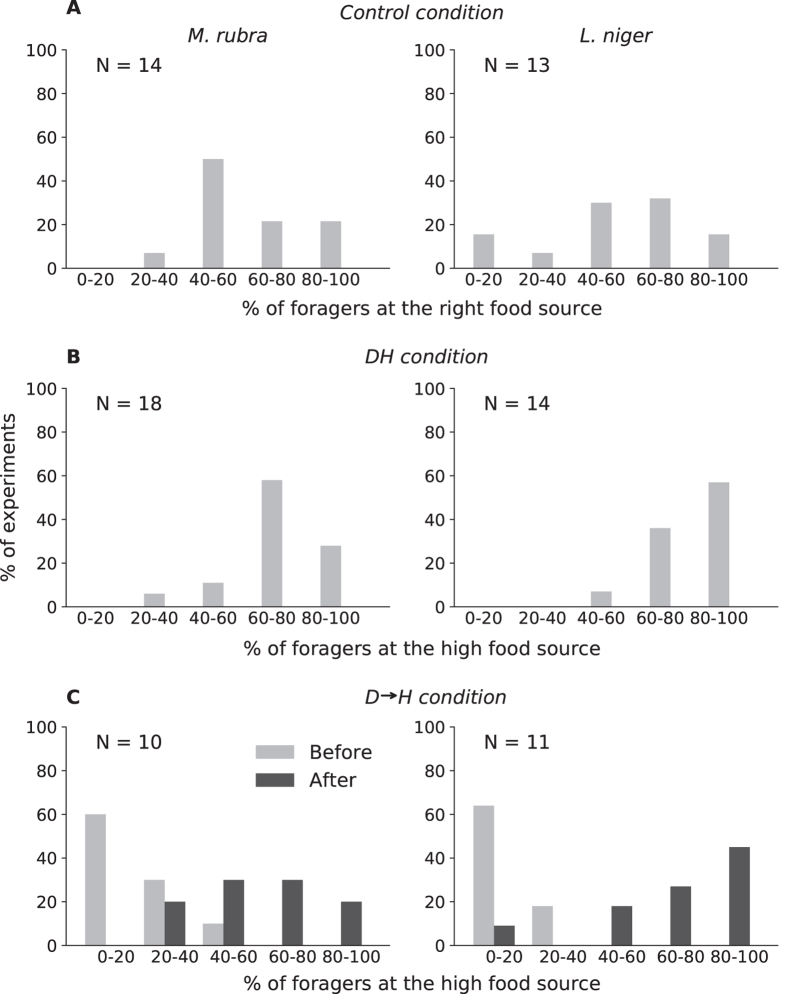
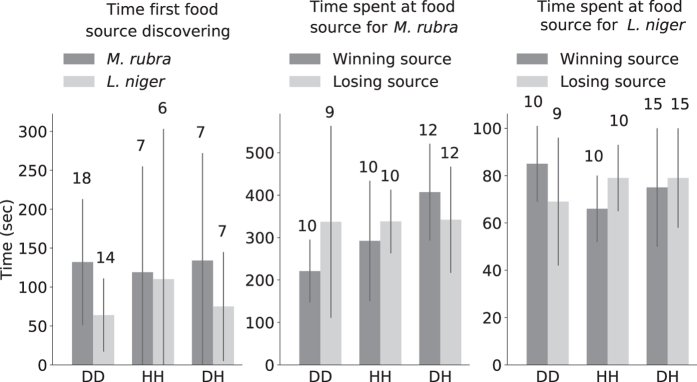
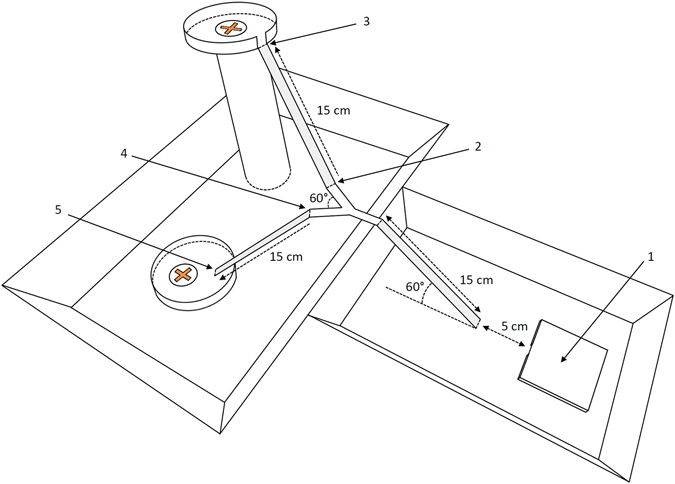
Collective decisions regarding food source exploitation in social insects are influenced by a range of parameters, from source quality to individual preference and social information sharing. Those regarding the elevation of the physical trail towards a food source have been neglected. In this work, we investigated the effect of ascending and descending paths from the nest to a food source on collective choice in two ant species Lasius niger and Myrmica rubra. Our hypothesis that returning loaded with food from the high source is more energy efficient was validated by choice experiments: when the sources are simultaneously introduced the high food source is preferentially exploited by both species. The flexibility of colony response was then tested by introducing the preferred source (high) incidentally, after recruitment towards the down food source began. Despite the well-known lack of flexibility of L. niger, both species showed the ability to reallocate their foraging workforce towards the highest food source. The collective choice and the flexibility are based on the difference between the u-turn rates when foragers are facing the ascending or descending branch. We discuss these results in terms of species-specifics characteristics and ecological context.
Conflict of interest statement
The authors declare that they have no competing interests.
Figures
Similar articles
-
Negative feedback enables fast and flexible collective decision-making in ants.PLoS One. 2012;7(9):e44501. doi: 10.1371/journal.pone.0044501. Epub 2012 Sep 12. PLoS One. 2012. PMID: 22984518 Free PMC article.
-
Same length, different shapes: ants collectively choose a straight foraging path over a bent one.Biol Lett. 2018 Mar;14(3):20180070. doi: 10.1098/rsbl.2018.0070. Biol Lett. 2018. PMID: 29540566 Free PMC article.
-
Foraging through multiple nest holes: An impediment to collective decision-making in ants.PLoS One. 2020 Jul 1;15(7):e0234526. doi: 10.1371/journal.pone.0234526. eCollection 2020. PLoS One. 2020. PMID: 32609769 Free PMC article.
-
Information flow, opinion polling and collective intelligence in house-hunting social insects.Philos Trans R Soc Lond B Biol Sci. 2002 Nov 29;357(1427):1567-83. doi: 10.1098/rstb.2002.1066. Philos Trans R Soc Lond B Biol Sci. 2002. PMID: 12495514 Free PMC article. Review.
-
Complexity of environment and parsimony of decision rules in insect societies.Biol Bull. 2002 Jun;202(3):268-74. doi: 10.2307/1543478. Biol Bull. 2002. PMID: 12086999 Review.
Cited by
-
Behavioural changes in the city: The common black garden ant defends aphids more aggressively in urban environments.Ecol Evol. 2024 Jul 3;14(7):e11639. doi: 10.1002/ece3.11639. eCollection 2024 Jul. Ecol Evol. 2024. PMID: 38962026 Free PMC article.
-
Food Transport of Red Imported Fire Ants (Hymenoptera: Formicidae) on Vertical Surfaces.Sci Rep. 2019 Mar 1;9(1):3283. doi: 10.1038/s41598-019-39756-4. Sci Rep. 2019. PMID: 30824752 Free PMC article.
References
-
- Pasteels, J. M., Deneubourg, J.-L. & Goss, S. Self-organization mechanisms in ant societies (I): trail recruitment to newly discovered food sources. In From individual to collective behavior in social insects, 177–196 (Birkhauser, 1987).
-
- Camazine S, Sneyd J, Jenkins MJ, Murray JD. A Mathematical Model of Self-organized Pattern Formation on the Combs of Honeybee Colonies. J. Theo. Biol. 1990;147:553–571. doi: 10.1016/S0022-5193(05)80264-4. - DOI
-
- Seeley TD, Camazine S, Sneyd J. Collective decision-making in honey bees: How colonies choose among nectar sources. Behav. Ecol. Sociobiol. 1991;28:277–290. doi: 10.1007/BF00175101. - DOI
-
- Seeley, T. D. The Wisdom of the Hive: The Social Physiology of Honey Bee Colonies (Harvard University Press, 1995).
-
- Beckers R, Deneubourg J-L, Goss S. Modulation of trail laying in the ant Lasius niger (Hymenoptera: Formicidae) and its role in the collective selection of a food source. J. Insect Behav. 1993;6:751–759. doi: 10.1007/BF01201674. - DOI
Publication types
MeSH terms
LinkOut - more resources
Full Text Sources
Other Literature Sources
