. 2017 Aug 18;7(1):8725.
doi: 10.1038/s41598-017-08975-y.

Epac1-deficient mice have bleeding phenotype and thrombocytes with decreased GPIbβ expression

Affiliations

Epac1-deficient mice have bleeding phenotype and thrombocytes with decreased GPIbβ expression

Gyrid Nygaard et al. Sci Rep. .

Abstract

Epac1 (Exchange protein directly activated by cAMP 1) limits fluid loss from the circulation by tightening the endothelial barrier. We show here that Epac1-/- mice, but not Epac2-/- mice, have prolonged bleeding time, suggesting that Epac1 may limit fluid loss also by restraining bleeding. The Epac1-/- mice had deficient in vitro secondary hemostasis. Quantitative comprehensive proteomics analysis revealed that Epac1-/- mouse platelets (thrombocytes) had unbalanced expression of key components of the glycoprotein Ib-IX-V (GPIb-IX-V) complex, with decrease of GP1bβ and no change of GP1bα. This complex is critical for platelet adhesion under arterial shear conditions. Furthermore, Epac1-/- mice have reduced levels of plasma coagulation factors and fibrinogen, increased size of circulating platelets, increased megakaryocytes (the GP1bβ level was decreased also in Epac1-/- bone marrow) and higher abundance of reticulated platelets. Viscoelastic measurement of clotting function revealed Epac1-/- mice with a dysfunction in the clotting process, which corresponds to reduced plasma levels of coagulation factors like factor XIII and fibrinogen. We propose that the observed platelet phenotype is due to deficient Epac1 activity during megakaryopoiesis and thrombopoiesis, and that the defects in blood clotting for Epac1-/- is connected to secondary hemostasis.


Conflict of interest statement

The authors declare that they have no competing interests.

Figures
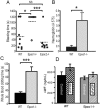
Figure 1
Figure 1
Epac1 −/− mice have increased bleeding time. (A) Tail bleeding time in WT (n = 8), Epac1−/− (n = 7) and Epac2−/− (n = 8) mice. Each point represents the measurement from one mouse. The horizontal dotted lines represent average tail bleeding time. 1200 seconds marks the experimental end point. (B) Blood loss quantified as amount of hemoglobin (absorbance at 575 nm) released during the tail bleeding test in WT (n = 8) and Epac1−/− mice (n = 7). (C) Whole blood clotting time in WT (n = 6) and Epac1−/− (n = 7) mice. (D) The plasma levels of vWF, determined by ELISA, 1.5 h after i.p. injection of 0.9% NaCl in WT (n = 4) and Epac1−/− mice (n = 5), or of dDAVP (1ng/g bodyweight) in WT (n = 4) and Epac1−/− mice (n = 5). The values shown are mean + /− SEM. NS = not significant, *P < 0.05, ***P < 0.005 ANOVA (A) and Student’s t-test (B, C, D).
Figure 2
Figure 2
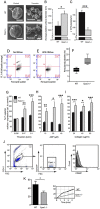
Epac1−/− mice have fewer, but more reticulated platelets and more agonist-responsive blood platelets than WT mice. (A) Scanning electron micrographs of resting and thrombin-activated platelets from WT and Epac1−/− mice. The platelets had been incubated for 10 min with vehicle (control) or 0.07 U/ml thrombin. The bars represent 1 μm. OCS: open canalicular system. (B) The average platelet diameter of resting platelets from WT and Epac1−/− mice (WT: n = 3 mice with 28 platelet diameters measured, Epac1−/− : n = 3 mice with 26 platelet diameters measured.) (C) Platelets from WT (n = 9) and Epac1−/− (n = 10) mice were identified and counted by flow cytometry using the platelet specific marker CD41 and forward- and side scatter. (D,E,F) Reticulated platelet count in platelet-rich plasma from WT and Epac1−/− mice. Platelets were stained with thiazole orange without (D) or with (E) RNAse treatment prior to staining. The platelets were then analyzed by flow cytometry, and the percent of reticulated platelets determined as described in the methods section. (F): Box-plot showing the reticulated platelet fraction from WT- and Epac1−/− mice. The data are average of three mice from each group. P = 0.068, Student’s t-test. Platelets from Epac1−/− or WT mice were exposed to various concentrations of thrombin (G), ADP (H) or collagen (I), and analyzed for P-selectin externalization by flow cytometry. Data shown are average + /− SEM from three independent experiments. (J) The gating strategy for the flow cytometric analyses, including histogram (right panel) showing a shift in mean fluorescence intensity after treatment with 0.1 U/ml Thrombin (light grey). Dark grey: unsitmulated platelets (K) Whole blood from WT (n = 8) and Epac−/− (n = 8) mice were used in an ADP-induced aggregation assay. Data shown are average + /− SEM. OCS; open canalicular system. P; platelets. P-sel. + ; P-selectin positive. *P < 0.05, **P < 0.01, ***P < 0.005, Student’s t-test.
Figure 3
Figure 3
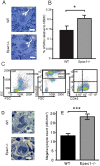
Increased number of megakaryocytes in adult bone marrow and embryonic liver. Representative micrographs of May-Grünwald Giemsa stained bone marrow megakaryocytes from WT and Epac1−/− mice. (B) Flow cytometric determination of bone marrow megakaryocytes numbers in Epac1−/− (n = 9) and WT (n = 10) mice. (C) Flow cytometric scatter plots with the gating strategy used to obtain data in B are shown. (D) Toluidine-stained sections of mouse embryonic livers showing megakaryocytes Arrowheads indicate demarcation membrane. (E) Number of megakaryocytes per mm2 in livers from WT (n = 5) and Epac1−/− (n = 7) embryos (E14). Data are average and + /− SEM. LN; lobulated nucleus, BMP; bone marrow population, NBMP; nucleated bone marrow population, MK; megakaryocytes. *P < 0.05, ***P < 0.005, Student’s t-test. The bars indicate 20 μm in A and D.
Figure 4
Figure 4
Key components of the intrinsic coagulation cascade are down-regulated in Epac1−/− plasma. Plasma samples from WT (n = 6) and Epac1−/− (n = 7) mice were analyzed by label-free quantitative proteomics. The differentially expressed proteins in the plasma samples were involved in the coagulation cascade and formation of fibrin clots. Down-regulated proteins are red, up-regulated are blue. Green, no altered regulation. Grey, not quantified. Thrombin signaling in this cascade is marked with green arrows.
Figure 5
Figure 5
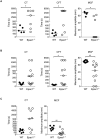
Epac1−/− mice exhibit a delayed rate of clot formation and fragile clot stability ex vivo. ROTEM characterization of the coagulation process in citrated whole blood from WT and Epac1−/− mice. Activated CT: clotting time i.e., the latency until the clot reaches a firmness of 2 mm, CFT: clot formation time and MCF: maximum clot firmness in mm was assessed by ROTEM assays (A) INTEM, (B) EXTEM and (C) FIBTEM. In FIBTEM assays the actin polymerization and platelet activation blocker cytochalasin D is present. Each point represents the measurements of one mouse. The horizontal dotted lines represent the median, n = 5–11 mice per group. *P < 0.05, **P < 0.01, Student’s t-test.
Figure 6
Figure 6
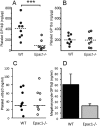
Decreased platelet levels of GP1bβ and un-altered levels of GP1bα in Epac1−/− mice. Quantification of GP1bβ (A), GP1bα (B) and αIIbβ3 (C) of platelets from WT (n = 8) and Epac1−/− (n = 8) mice by ELISA. Each dot represents the data from a single mouse. (D) Quantification of megakaryocyte GP1bβ by ELISA from WT (n = 3) and Epac1−/− (n = 3) mice. The horizontal dashed lines represent the mean. ***P < 0.005.

Similar articles

Cited by

References

    1. Broos K, Feys HB, De Meyer SF, Vanhoorelbeke K, Deckmyn H. Platelets at work in primary hemostasis. Blood Rev. 2011;25:155–167. doi: 10.1016/j.blre.2011.03.002. - DOI - PubMed
    1. Ruggeri ZM. Platelet adhesion under flow. Microcirculation. 2009;16:58–83. doi: 10.1080/10739680802651477. - DOI - PMC - PubMed
    1. Jackson SP. Arterial thrombosis–insidious, unpredictable and deadly. Nat Med. 2011;17:1423–1436. doi: 10.1038/nm.2515. - DOI - PubMed
    1. Lopez JA, Andrews RK, Afshar-Kharghan V, Berndt MC. Bernard-Soulier syndrome. Blood. 1998;91:4397–4418. - PubMed
    1. Birkeland E, et al. Epac-induced Alterations in the Proteome of Human SH-SY5Y Neuroblastoma Cells. J Proteomics Bioinformatics. 2009;2:244–254. doi: 10.4172/jpb.1000083. - DOI

Publication types

MeSH terms