

Dynamics of Hydration Water Plays a Key Role in Determining the Binding Thermodynamics of Protein Complexes
- PMID: 28821854
- PMCID: PMC5562873
- DOI: 10.1038/s41598-017-09466-w
Dynamics of Hydration Water Plays a Key Role in Determining the Binding Thermodynamics of Protein Complexes
Abstract
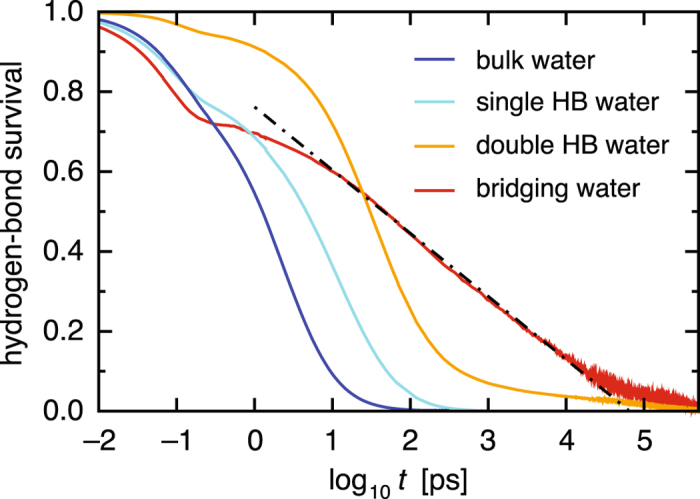
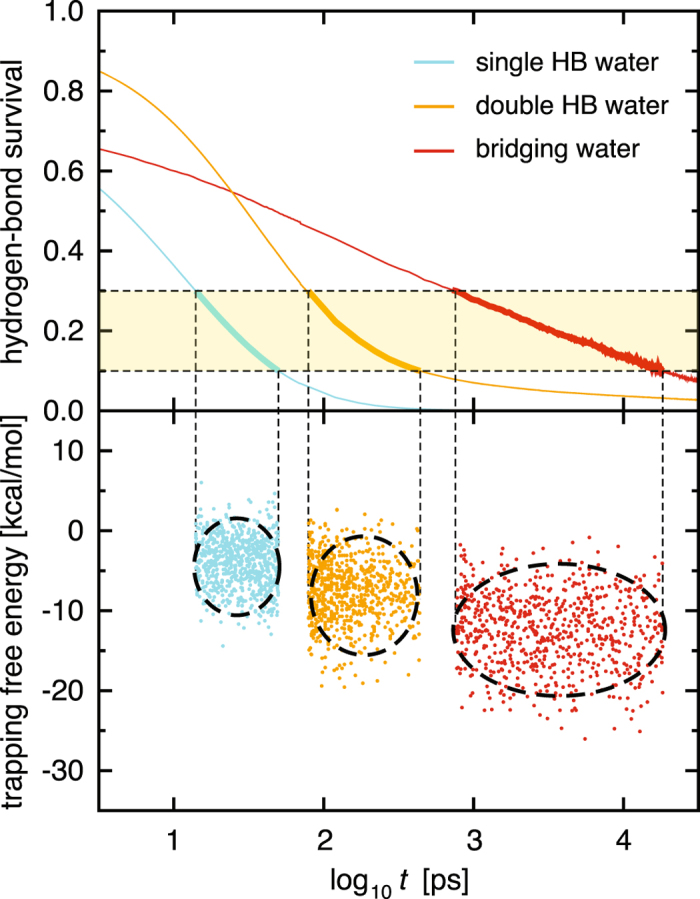
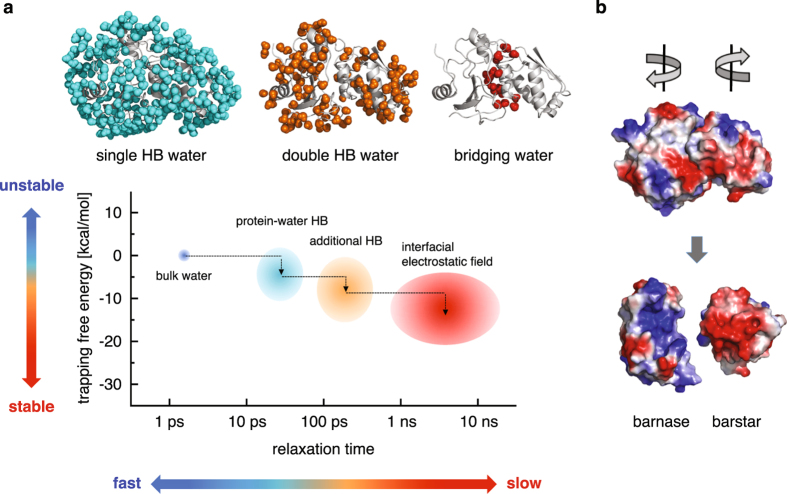
Interfacial waters are considered to play a crucial role in protein-protein interactions, but in what sense and why are they important? Here, using molecular dynamics simulations and statistical thermodynamic analyses, we demonstrate distinctive dynamic characteristics of the interfacial water and investigate their implications for the binding thermodynamics. We identify the presence of extraordinarily slow (~1,000 times slower than in bulk water) hydrogen-bond rearrangements in interfacial water. We rationalize the slow rearrangements by introducing the "trapping" free energies, characterizing how strongly individual hydration waters are captured by the biomolecular surface, whose magnitude is then traced back to the number of water-protein hydrogen bonds and the strong electrostatic field produced at the binding interface. We also discuss the impact of the slow interfacial waters on the binding thermodynamics. We find that, as expected from their slow dynamics, the conventional approach to the water-mediated interaction, which assumes rapid equilibration of the waters' degrees of freedom, is inadequate. We show instead that an explicit treatment of the extremely slow interfacial waters is critical. Our results shed new light on the role of water in protein-protein interactions, highlighting the need to consider its dynamics to improve our understanding of biomolecular bindings.
Conflict of interest statement
The authors declare that they have no competing interests.
Figures
Similar articles
-
Thermodynamics of interfacial changes in a protein-protein complex.Mol Biosyst. 2014 Mar 4;10(3):437-45. doi: 10.1039/c3mb70249a. Epub 2013 Dec 13. Mol Biosyst. 2014. PMID: 24336889
-
Water Dynamics at Protein-Protein Interfaces: Molecular Dynamics Study of Virus-Host Receptor Complexes.J Phys Chem B. 2014 Dec 26;118(51):14795-807. doi: 10.1021/jp5089096. Epub 2014 Dec 12. J Phys Chem B. 2014. PMID: 25420132
-
Dynamics and thermodynamics of water around EcoRI bound to a minimally mutated DNA chain.Phys Chem Chem Phys. 2012 Sep 21;14(35):12277-84. doi: 10.1039/c2cp41638g. Epub 2012 Aug 8. Phys Chem Chem Phys. 2012. PMID: 22872098
-
Water structure and interactions with protein surfaces.Curr Opin Struct Biol. 2006 Apr;16(2):152-9. doi: 10.1016/j.sbi.2006.03.002. Epub 2006 Mar 20. Curr Opin Struct Biol. 2006. PMID: 16546375 Review.
-
Water at biomolecular binding interfaces.Phys Chem Chem Phys. 2007 Feb 7;9(5):573-81. doi: 10.1039/b612449f. Epub 2006 Nov 24. Phys Chem Chem Phys. 2007. PMID: 17242738 Review.
Cited by
-
Exploring the use of molecular dynamics in assessing protein variants for phenotypic alterations.Hum Mutat. 2019 Sep;40(9):1424-1435. doi: 10.1002/humu.23800. Epub 2019 Jul 12. Hum Mutat. 2019. PMID: 31106920 Free PMC article.
-
In silico mutagenesis of human ACE2 with S protein and translational efficiency explain SARS-CoV-2 infectivity in different species.PLoS Comput Biol. 2020 Dec 7;16(12):e1008450. doi: 10.1371/journal.pcbi.1008450. eCollection 2020 Dec. PLoS Comput Biol. 2020. PMID: 33284795 Free PMC article.
-
Binding Free Energy Analysis of Colicin D, E3 and E8 to Their Respective Cognate Immunity Proteins Using Computational Simulations.Molecules. 2025 Mar 12;30(6):1277. doi: 10.3390/molecules30061277. Molecules. 2025. PMID: 40142054 Free PMC article.
-
Competition between chiral solvents and chiral monomers in the helical bias of supramolecular polymers.Nat Chem. 2021 Feb;13(2):200-207. doi: 10.1038/s41557-020-00583-0. Epub 2020 Nov 30. Nat Chem. 2021. PMID: 33257888
-
Wetting the lock and key enthalpically favours polyelectrolyte binding.Chem Sci. 2018 Oct 8;10(1):277-283. doi: 10.1039/c8sc02966k. eCollection 2019 Jan 7. Chem Sci. 2018. PMID: 30746081 Free PMC article.
References
Publication types
MeSH terms
Substances
LinkOut - more resources
Full Text Sources
Other Literature Sources
