

Modern dust aerosol availability in northwestern China
- PMID: 28821858
- PMCID: PMC5562760
- DOI: 10.1038/s41598-017-09458-w
Modern dust aerosol availability in northwestern China
Abstract
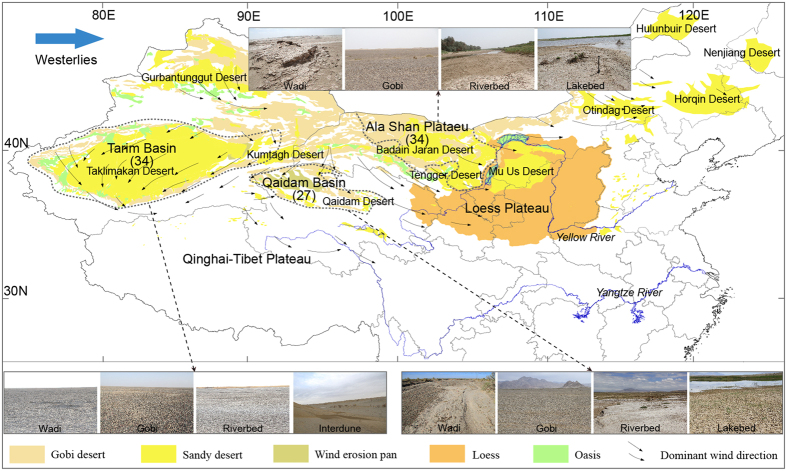
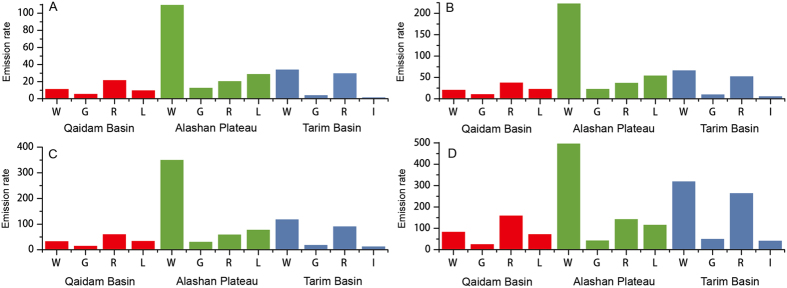
The sources of modern dust aerosols and their emission magnitudes are fundamental for linking dust with climate and environment. Using field sample data, wind tunnel experiments and statistical analysis, we determined the contributions of wadis, gobi (stony desert), lakebeds, riverbeds, and interdunes to modern dust aerosol availability in the three important potential dust sources including the Tarim Basin, Qaidam Basin, and Ala Shan Plateau of China. The results show that riverbeds are the dominant landscape for modern dust aerosol availabilities in the Qaidam Basin, while wadis, gobi, and interdunes are the main landscapes over the Ala Shan Plateau and Tarim Basin. The Ala Shan Plateau and Tarim Basin are potential dust sources in northwestern China, while the Qaidam Basin is not a major source of the modern dust aerosols nowadays, and it is not acting in a significant way to the Loess Plateau presently. Moreover, most of modern dust aerosol emissions from China originated from aeolian processes with low intensities rather than from major dust events.
Conflict of interest statement
The authors declare that they have no competing interests.
Figures


Similar articles
-
Windblown dust in the Tarim basin, Northwest China.Sci Rep. 2025 Apr 2;15(1):11209. doi: 10.1038/s41598-025-95974-z. Sci Rep. 2025. PMID: 40175634 Free PMC article.
-
Comparisons of topsoil geochemical elements from Northwest China and eastern Tibetan Plateau identify the plateau interior as Tibetan dust source.Sci Total Environ. 2021 Dec 1;798:149240. doi: 10.1016/j.scitotenv.2021.149240. Epub 2021 Jul 22. Sci Total Environ. 2021. PMID: 34332394
-
Mixing of dust with pollution on the transport path of Asian dust--revealed from the aerosol over Yulin, the north edge of Loess Plateau.Sci Total Environ. 2011 Jan 1;409(3):573-81. doi: 10.1016/j.scitotenv.2010.10.032. Epub 2010 Nov 13. Sci Total Environ. 2011. PMID: 21075425
-
Sources of particulate matter in China: Insights from source apportionment studies published in 1987-2017.Environ Int. 2018 Jun;115:343-357. doi: 10.1016/j.envint.2018.03.037. Epub 2018 Apr 10. Environ Int. 2018. PMID: 29653391 Review.
-
The physics of wind-blown sand and dust.Rep Prog Phys. 2012 Oct;75(10):106901. doi: 10.1088/0034-4885/75/10/106901. Epub 2012 Sep 14. Rep Prog Phys. 2012. PMID: 22982806 Review.
Cited by
-
Effects of COVID-19 lockdowns on fine particulate matter concentrations.Sci Adv. 2021 Jun 23;7(26):eabg7670. doi: 10.1126/sciadv.abg7670. Print 2021 Jun. Sci Adv. 2021. PMID: 34162552 Free PMC article.
-
Contributions of modern Gobi Desert to the Badain Jaran Desert and the Chinese Loess Plateau.Sci Rep. 2019 Jan 30;9(1):985. doi: 10.1038/s41598-018-37635-y. Sci Rep. 2019. PMID: 30700770 Free PMC article.
References
-
- Shao, Y. Physics and Modelling of Wind Erosion. (eds Mysak, L. A. & Hamilton, K.) (Springer, 2008).
-
- Bryant RG, Bigg GR, Mahowald NM, Eckardt FD, Ross SG. Dust aerosol emission response to climate in southern Africa. J. Geophys. Res. 2007;112 doi: 10.1029/2005JD007025. - DOI
-
- IPCC (Intergovernmental Panel on Climate Change). The Physical Science Basis. Contribution of Working Group I to the Fourth Assessment Report of the Intergovernmental Panel on Climate Change. (eds Solomon, S. et al.) (Cambridge University Press, 2007).
Publication types
LinkOut - more resources
Full Text Sources
Other Literature Sources
