. 2017 Dec;13(4):511-520.
doi: 10.1007/s11302-017-9576-1. Epub 2017 Aug 18.

In situ imaging reveals properties of purinergic signalling in trigeminal sensory ganglia in vitro

Affiliations

In situ imaging reveals properties of purinergic signalling in trigeminal sensory ganglia in vitro

Arletta Nowodworska et al. Purinergic Signal. 2017 Dec.

Abstract

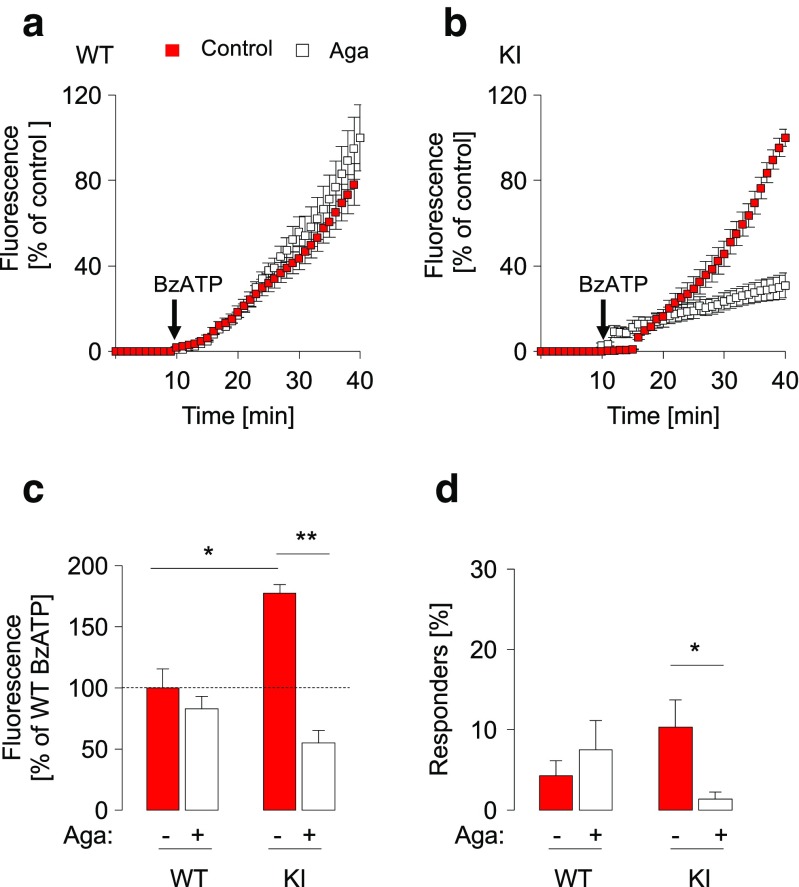
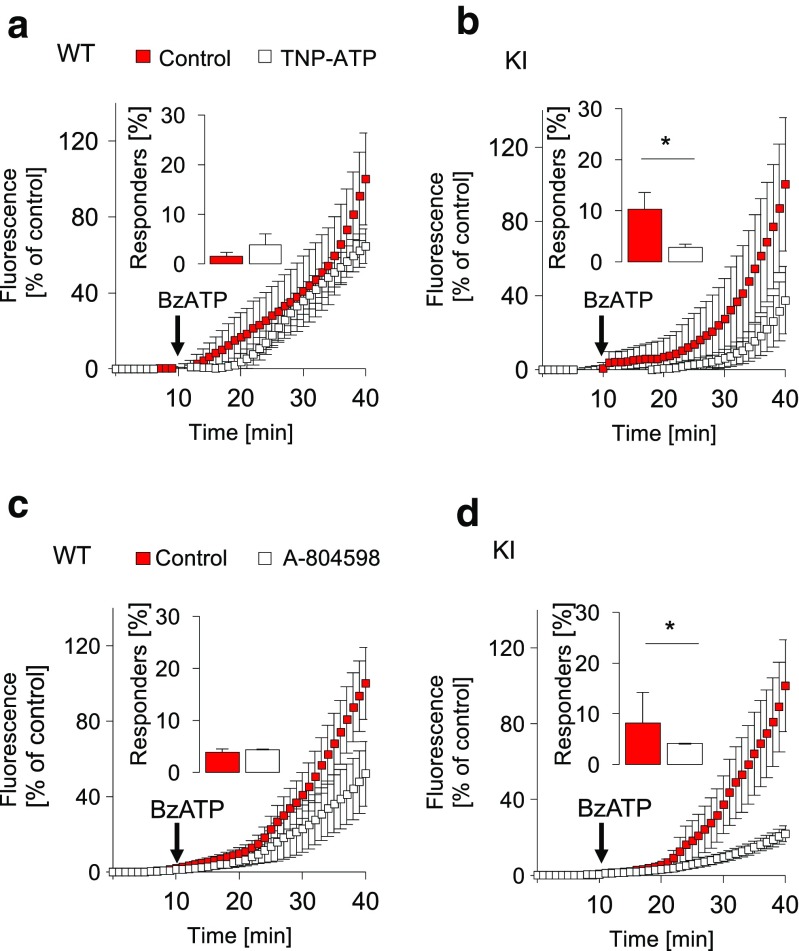
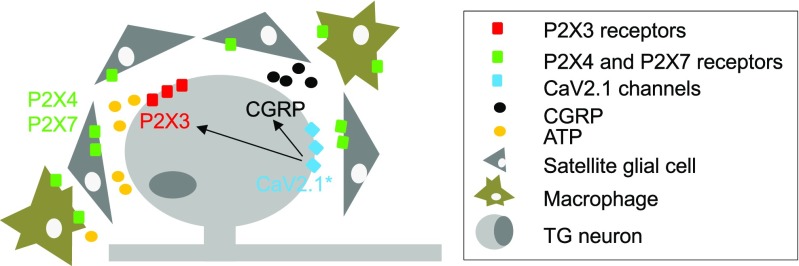
Chronic pain is supported by sterile inflammation that induces sensitisation of sensory neurons to ambient stimuli including extracellular ATP acting on purinergic P2X receptors. The development of in vitro methods for drug screening would be useful to investigate cell crosstalk and plasticity mechanisms occurring during neuronal sensitisation and sterile neuroinflammation. Thus, we studied, at single-cell level, membrane pore dilation based on the uptake of a fluorescent probe following sustained ATP-gated P2X receptor function in neurons and non-neuronal cells of trigeminal ganglion cultures from wild-type (WT) and R192Q CaV2.1 knock-in (KI) mice, a model of familial hemiplegic migraine type 1 characterised by neuronal sensitisation and higher release of soluble mediators. In WT cultures, pore responses were mainly evoked by ATP rather than benzoyl-ATP (BzATP) and partly inhibited by the P2X antagonist TNP-ATP. P2X7 receptors were expressed in trigeminal ganglia mainly by non-neuronal cells. In contrast, KI cultures showed higher expression of P2X7 receptors, stronger responses to BzATP, an effect largely prevented by prior administration of CaV2.1 blocker ω-agatoxin IVA, small interfering RNA (siRNA)-based silencing of P2X7 receptors or the P2X7 antagonist A-804598. No cell toxicity was detected with the protocols. Calcitonin gene-related peptide (CGRP), a well-known migraine mediator, potentiated BzATP-evoked membrane permeability in WT as well as R192Q KI cultures, demonstrating its modulatory role on trigeminal sensory ganglia. Our results show an advantageous experimental approach to dissect pharmacological properties potentially relevant to chronic pain and suggest that CGRP is a soluble mediator influencing purinergic P2X pore dilation and regulating inflammatory responses.

Keywords: ATP; CACNA1A; DRG; FHM1; Migraine; P2X3; P2X7; Pain.


Conflict of interest statement

Conflict of interest

Arletta Nowodworska declares that she has no conflict of interest.

Arn M. J. M. van den Maagdenberg declares that he has no conflict of interest.

Andrea Nistri declares that he has no conflict of interest.

Elsa Fabbretti declares that she has no conflict of interest.

Ethical approval

All animal procedures were in accordance with national regulations of animal welfare and approved by the ethics committee of the International School for Advanced Studies (SISSA).

Figures

Fig. 1
Fig. 1
Fluorescence recordings of membrane pore permeability in TG cultures. a, b Imaging recordings of EtBr fluorescence intensity (in arbitrary units, AU) of TG cultures from WT (a) or R192Q KI mice (b), to quantify the membrane pore permeability at the single-cell level during the time (min) after application of ATP (0.01, 0.1 or 1 mM, as indicated). ATP was applied after 10 min from the beginning of the recordings (arrows). In insets, histograms quantify the percent of responding cells in each condition, counted on the total number of cells after 20 min from the beginning of the recordings. For WT: n = 3–6 experiments; with 919, 2711 or 2812 analysed cells for 0.01, 0.1 or 1 mM ATP, respectively. For KI: n = 3–4; with 1068, 557 or 535 analysed cells for 0.01, 0.1 or 1 mM ATP, respectively; *p = 0.001 (0.1 vs 1 mM ATP, both for WT and KI samples). c, d As before, after application of BzATP (300 μM, arrows); n = 5, for a total of 6825 analysed cells for WT and 3782 for KI samples
Fig. 2
Fig. 2
Effect of ω-agatoxin IVA on membrane pore permeability evoked by BzATP. a, b Membrane pore permeability of TG cultures from WT (a) or R192Q KI mice (b) after application of BzATP (300 μM) alone or after pre-treatment with ω-agatoxin IVA (Aga; 400 nM, 15 h). Data are expressed as percent of mean of maximum fluorescence intensity values of untreated control culture after application of BzATP (300 μM, 30 min); n = 3. c Histograms quantify the fluorescence intensity (expressed as % of response of WT untreated control cultures at 40 min, taken as 100%, dashed line) in WT and KI cultures, in standard control conditions or after pre-treatment with Aga (400 nM, 15 h) as indicated; n = 3, *p = 0.003 (WT vs KI), **p = 0.001 (KI vs KI Aga). d Percent of responding cells counted after 20 min from beginning of the recording experiments, calculated on a total of 377 WT and 322 KI cells; n = 3; *p = 0.004 (KI vs KI Aga)
Fig. 3
Fig. 3
Expression of P2X7 receptors in TG ganglia and cultures. a Example of fluorescence microscopy photographs of TG ganglia from WT and R192Q KI mice, stained with anti-P2X7 receptors and neuron-specific anti-β-tubulin III antibodies, as indicated. Scale bar, 50 μm. Histograms quantify the P2X7 immunoreactivity in WT and KI TG tissue per ROI expressed in arbitrary units (AU); n = 3; *p = 0.006. b Example of fluorescence microscopy photographs of R192Q KI TG cultures, stained with anti-P2X7 receptors and anti-glutamine synthase (GS) antibodies or with anti-P2X7 receptors and β-tubulin III antibodies. Nuclei are stained with Hoechst 33342. Scale bar, 20 μm. Histograms quantify the percent of occurrence of P2X7 receptor immunopositive GS cells in WT and KI TG cultures which was not significantly different between the two cell samples; n = 3
Fig. 4
Fig. 4
Effect of the antagonists TNP-ATP and A-804598 on pore permeability evoked by BzATP. a, b Fluorescence recording profiles during the time (min) in TG cultures from WT (a) or R192Q KI (b) after application of BzATP (300 μM, arrows) alone or in cultures pre-treated with TNP-ATP (25 μM, 15 min). Histograms (insets) quantify the percent of responding cells, measured after 20 min from beginning of the recordings, namely in 29/815 WT and 23/705 KI cells; n = 3, *p = 0.016 (KI vs KI TNP-ATP). c, d Fluorescence recordings quantify pore formation in TG cultures pre-treated with the P2X7 antagonist A-804598 (100 nM, 15 min); n = 4. Histograms quantify the number of responding cells after 20 min from beginning of recordings. Increased fluorescence uptake was observed in 33/1312 WT and 17/398 KI cells; n = 4, *p = 0.026 (KI vs KI A80)
Fig. 5
Fig. 5
siP2X4 or siP2X7 modulates BzATP-evoked fluorescence in TG cultures. a, b Membrane pore permeability in TG cultures from WT (a) or R192Q KI (b) after application of BzATP (300 μM, arrows), after application of scrambled siRNA (control) or siP2X7. Histograms (insets) quantify the percent of responding cells, measured after 20 min from beginning of recording, i.e. fluorescence uptake was measured in 48/1032 siP2X7 WT cells and in 17/1087 siP2X7 KI cells; n = 5, *p = 0.001 (KI vs KI siP2X7). c, d Membrane pore permeability in TG cultures from WT (c) or R192Q KI (d) after application of BzATP (300 μM, arrows), after application of scrambled siRNA (control) or siP2X4. Histograms quantify the percent of responding cells after 20 min from beginning of the recordings, corresponding to 10/297 WT and 11/502 KI cells; n = 3, *p = 0.027 (KI vs KI siP2X4)
Fig. 6
Fig. 6
CGRP modulates membrane pore permeability in TG cultures. a, b Membrane pore permeability in TG cultures from WT (a) or R192Q KI (b) after application of BzATP (300 μM, arrows), in standard conditions (control) or in cultures pre-treated with CGRP (1 μM, 4 h). c Histograms quantify the fluorescence change (calculated as percentage of control samples, measured after 40 min from beginning of the recordings) in controls or after CGRP (1 μM, 4 h) or CGRP8–37 (1 μM, 4 h) treatments. Dashed line indicates WT control values, taken as 100%. *p = 0.029 (WT vs WT CGRP); **p = 0.019 (WT vs KI control samples); #*p = 0.005 (KI vs KI CGRP); #p = 0.037 (KI CGRP vs KI CGRP8–37), ##p = 0.037 (KI vs KI CGRP8–37); n = 3. d Histograms quantify responding cells in each condition, measured after 20 min from beginning of the recordings. Increased fluorescent probe uptake was observed in 68/376 WT or 52/496 KI CGRP-treated cells and from 63/597 WT or 15/793 KI CGRP8–37-treated cells; n = 3; *p = 0.007 (WT vs WT CGRP); **p = 0.01 (KI CGRP vs KI CGRP8–37)
Fig. 7
Fig. 7
Schematic view proposing the cell arrangement underlying crosstalk among TG neurons and non-neuronal cells in KI ganglia. The diagram hypothesises facilitated release of soluble mediators such as CGRP in R192Q KI ganglia to augment P2X3 receptor-mediated responses and cell-to-cell crosstalk among neuronal and non-neuronal P2X receptors to enhance TG nociceptive signalling. Mutated R192Q CaV2.1 channels (CaV2.1*) expressed by R192Q KI neurons are proposed to play a key role in promoting larger CGRP secretion (black dots), potentiation of P2X3 receptors and larger ATP release (yellow dots) with enhanced tissue purinergic responses. Arrows depict a few crucial interconnections

Similar articles

Cited by

References

    1. Magni G, Merli D, Verderio C, Abbracchio MP, Ceruti S. P2Y2 receptor antagonists as anti-allodynic agents in acute and sub-chronic trigeminal sensitization: role of satellite glial cells. Glia. 2015;63:1256–1269. doi: 10.1002/glia.22819. - DOI - PubMed
    1. Burnstock G. Purinergic signalling and disorders of the central nervous system. Nat Rev Drug Discov. 2008;7:575–590. doi: 10.1038/nrd2605. - DOI - PubMed
    1. North RA, Jarvis MF. P2X receptors as drug targets. Mol Pharmacol. 2013;83:759–769. doi: 10.1124/mol.112.083758. - DOI - PMC - PubMed
    1. Inoue K, Koizumi S, Tsuda M. The role of nucleotides in the neuron–glia communication responsible for the brain functions. J Neurochem. 2007;102:1447–1458. doi: 10.1111/j.1471-4159.2007.04824.x. - DOI - PubMed
    1. Khakh BS, North RA. Neuromodulation by extracellular ATP and P2X receptors in the CNS. Neuron. 2012;76:51–69. doi: 10.1016/j.neuron.2012.09.024. - DOI - PMC - PubMed

Substances

Grants and funding