. 2017 Dec;10(1-3):57-68.
doi: 10.1007/s12307-017-0197-6. Epub 2017 Aug 18.

Expression Profiling of the MAP Kinase Phosphatase Family Reveals a Role for DUSP1 in the Glioblastoma Stem Cell Niche

Affiliations

Expression Profiling of the MAP Kinase Phosphatase Family Reveals a Role for DUSP1 in the Glioblastoma Stem Cell Niche

Bradley N Mills et al. Cancer Microenviron. 2017 Dec.

Abstract

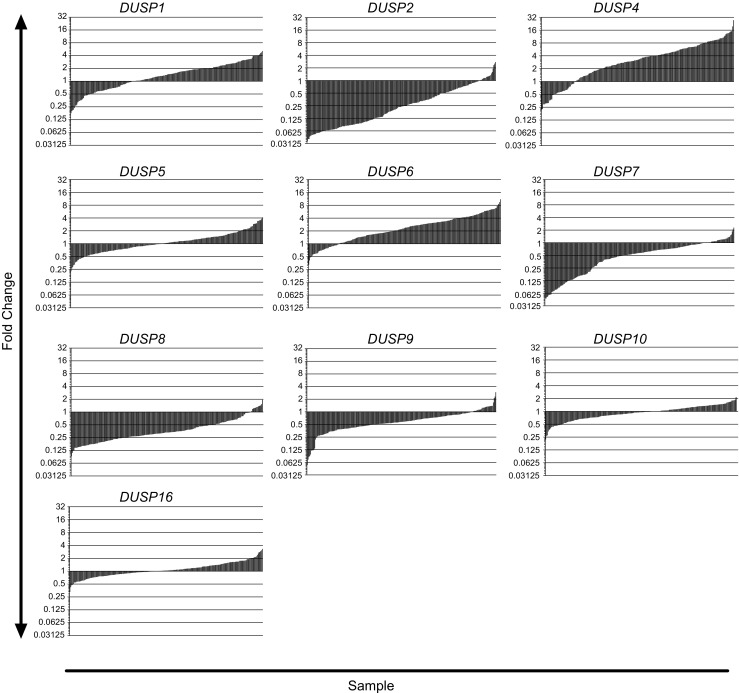
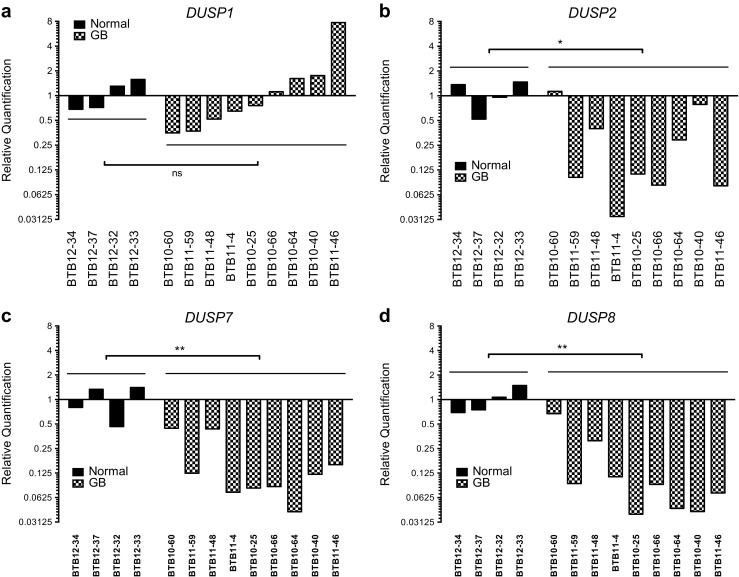
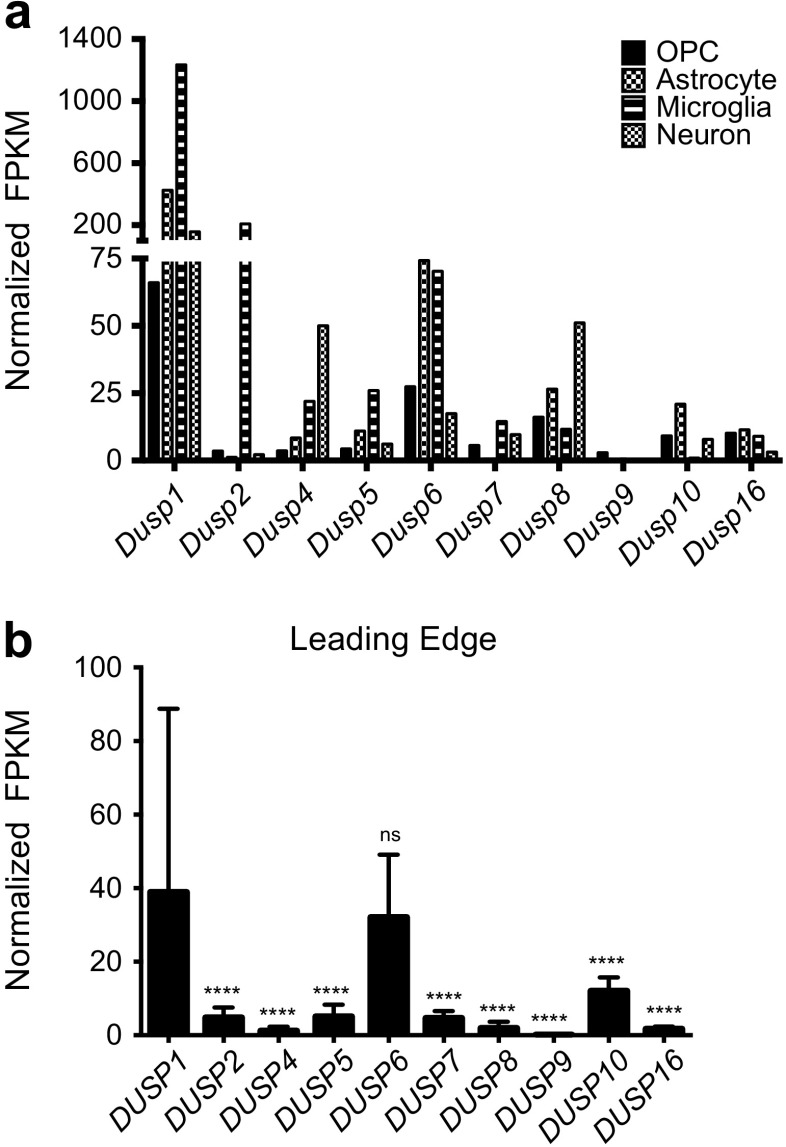
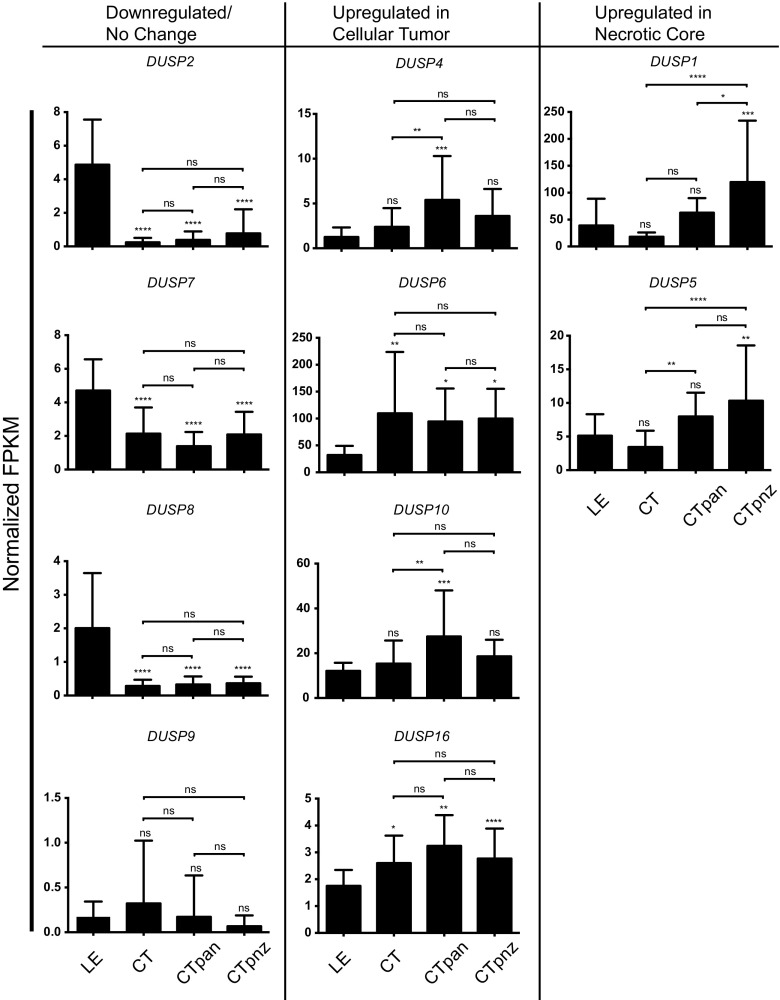
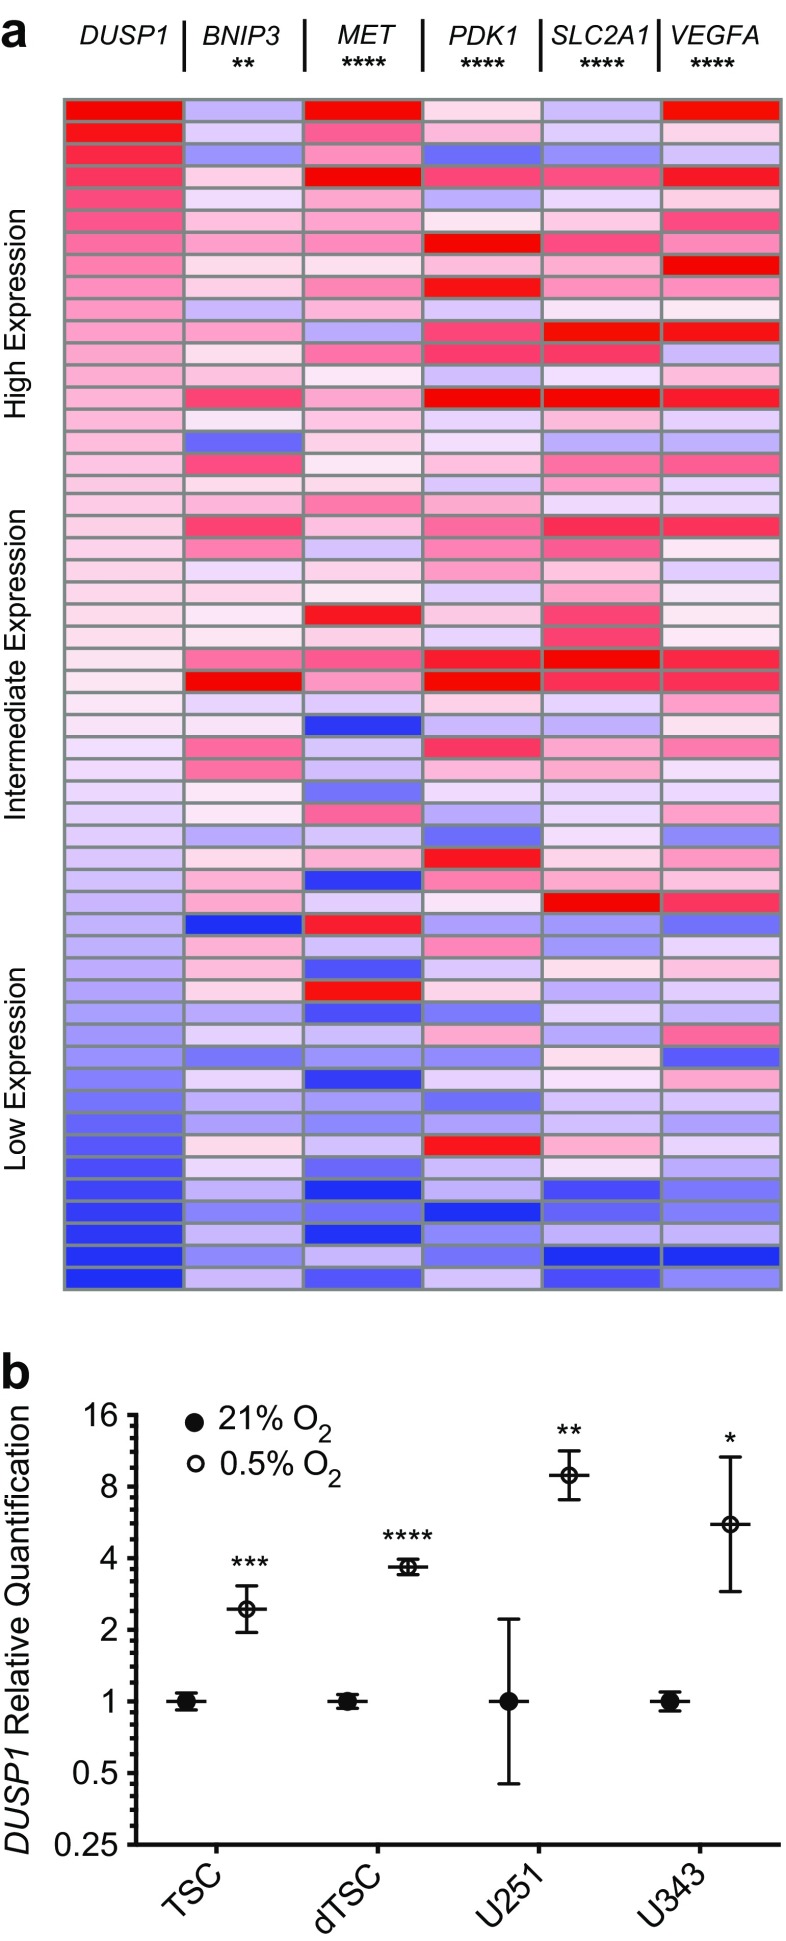
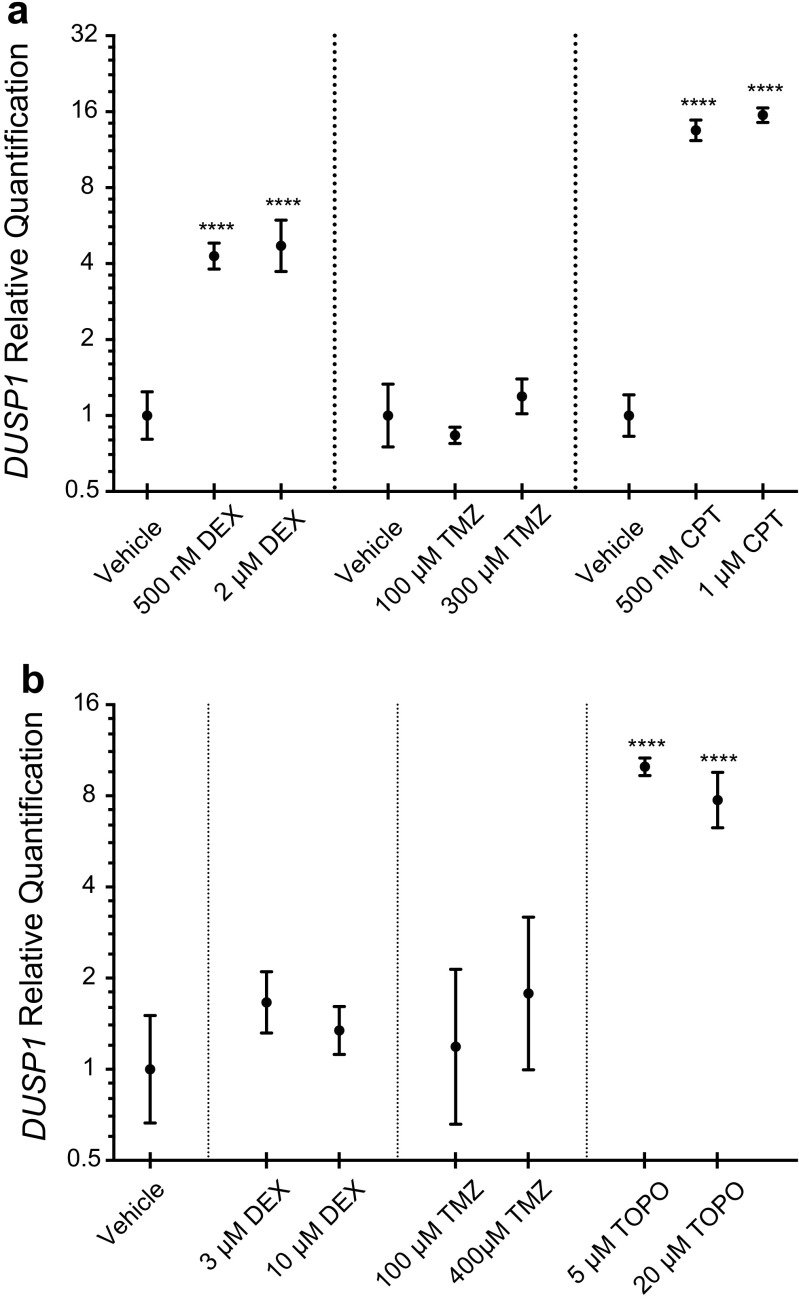
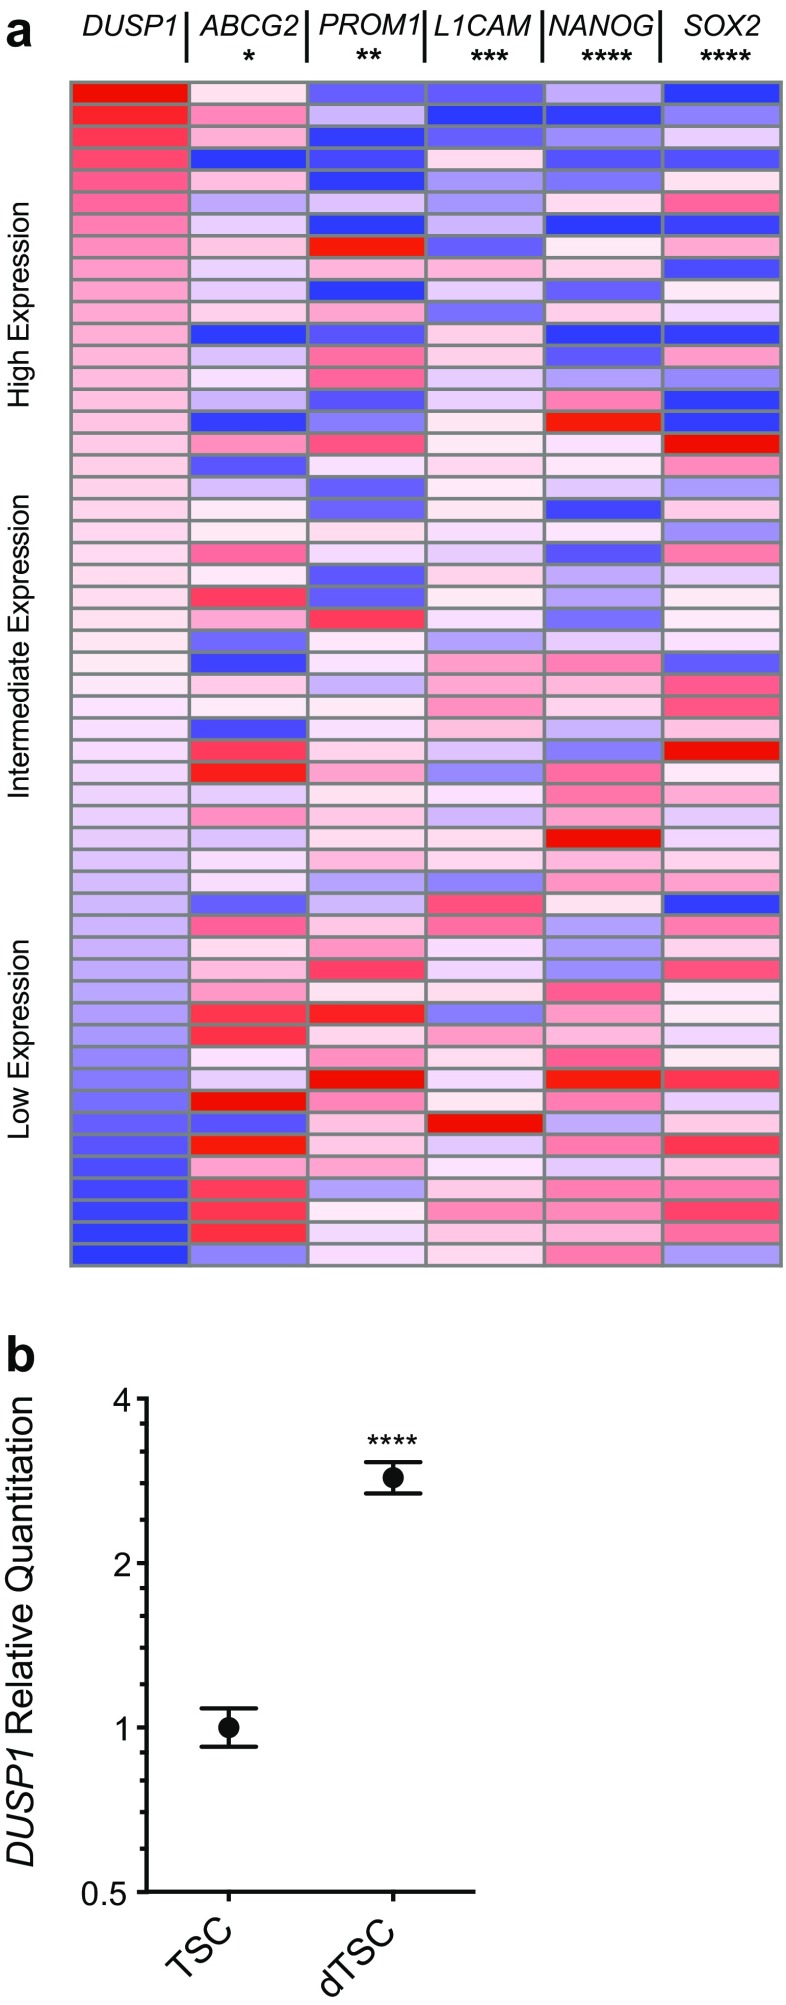
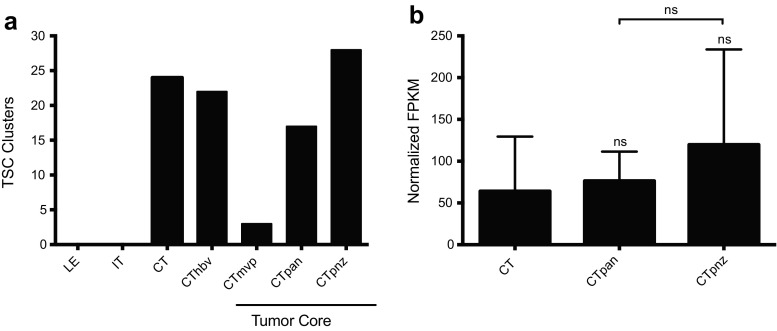
The dual specificity phosphatases (DUSPs) constitute a family of stress-induced enzymes that provide feedback inhibition on mitogen-activated protein kinases (MAPKs) critical in key aspects of oncogenic signaling. While described in other tumor types, the landscape of DUSP mRNA expression in glioblastoma (GB) remains largely unexplored. Interrogation of the REpository for Molecular BRAin Neoplasia DaTa (REMBRANDT) revealed induction (DUSP4, DUSP6), repression (DUSP2, DUSP7-9), or mixed (DUSP1, DUSP5, DUSP10, DUSP15) DUSP transcription of select DUSPs in bulk tumor specimens. To resolve features specific to the tumor microenvironment, we searched the Ivy Glioblastoma Atlas Project (Ivy GAP) repository, which highlight DUSP1, DUSP5, and DUSP6 as the predominant family members induced within pseudopalisading and perinecrotic regions. The inducibility of DUSP1 in response to hypoxia, dexamethasone, or the chemotherapeutic agent camptothecin was confirmed in GB cell lines and tumor-derived stem cells (TSCs). Moreover, we show that loss of DUSP1 expression is a characteristic of TSCs and correlates with expression of tumor stem cell markers in situ (ABCG2, PROM1, L1CAM, NANOG, SOX2). This work reveals a dynamic pattern of DUSP expression within the tumor microenvironment that reflects the cumulative effects of factors including regional ischemia, chemotherapeutic exposure among others. Moreover, our observation regarding DUSP1 dysregulation within the stem cell niche argue for its importance in the survival and proliferation of this therapeutically resistant population.

Keywords: Camptothecin; DUSP1; Dexamethasone; Glioblastoma multiforme; Hypoxia; Mitogen-activated protein kinases; Temozolomide; Tumor stem cell.


Figures

Fig. 1
Fig. 1
Microarray profiling of DUSPs across mixed primary and secondary GB tumors. Histograms depicting the fold change in mRNA expression for each of the DUSP members analyzed using the REMBRANDT Microarray dataset. Gene expression levels for each GB tumor (n = 228) are presented as fold change relative to the average level across normal tissue controls (n = 28) and plotted on a log2 scale
Fig. 2
Fig. 2
Quantitative PCR analysis of DUSP expressions in epileptic control and grade IV GB tumors. Quantitative PCR analysis of DUSP1, DUSP2, DUSP7, and DUSP8 expression in human grade IV GB tissue samples (GB, n = 9) and temporal lobe epileptic controls (normal, n = 4) maintained by the University of Rochester Brain Tissue Bank. Fold-induction data are presented relative to the average expression of the comparator gene within epileptic controls and presented using a log2 scale. Statistical significance was measured across groups by one-way ANOVA (ns = not significant, * = p < 0.05, ** = p < 0.01)
Fig. 3
Fig. 3
Cell type and region specific profile of DUSP expression. a RNA-Seq expression levels of the Dusp family obtained from the Barres online dataset presented as normalized fragments per kilobase of transcript per million mapped reads (FPKM) across various cell types. RNA-Seq data were originally generated from purified oligodendrocyte precursor cell (OPC), astrocyte, microglia, and neuronal populations isolated from mouse P7 cortices by immunopanning (n = 19) as described [18]. b Analysis of DUSP expression within the “normal” leading edge (LE) of human GB tumors. RNA-Seq data from the Ivy GAP database are presented. LE regions of GB biopsy samples (50:1 normal:tumor cells) were identified using ISH panels and microdissected by the Ivy GAP consortium prior to RNA-Seq analysis. The data in (b) are presented as the average ± standard deviation, and statistical significance was determined using one-way ANOVA with Bonferroni correction for multiple comparisons (DUSP1 vs. all datasets; ns = not significant, **** = p < 0.0001)
Fig. 4
Fig. 4
Differential DUSP expression across the GB tumor microenvironment. The expression of DUSP family across discrete regions of the tumor microenvironment are shown. Data obtained from the Ivy GAP consortium are presented as normalized fragments per kilobase of transcript per million mapped reads (FPKM). Regions of GB biopsy samples including the “normal” leading edge (LE, n = 19), bulk cellular tumor (CT, n = 11), pseudopalisading cells around necrosis (CTpan, n = 40), and perinecrotic zone (CTpnz, n = 26) were identified using ISH panels prior to laser-capture microdissection. “Downregulated/No Change” and “Upregulated in Cellular Tumor” groups include DUSPs with unchanged/decreased or increased expressions in tumor structures (CT, CTpan, CTpnz) relative to “normal” LE tissues, respectively. The “Upregulated in Necrotic Core” group represents DUSPs with increased expression in only necrotic CTpan and CTpnz regions relative to LE. Statistical significance was determined using one-way ANOVA with Bonferroni correction to correct for multiple comparisons (ns = not significant, * = p < 0.05, ** = p < 0.01, *** = p < 0.001, **** = p < 0.0001)
Fig. 5
Fig. 5
Hypoxia induces DUSP1 in cultured GB tumor cell lines. a Expression heat maps illustrating gene expression profiles for DUSP1, BNIP3, MET, PDK1, SLC2A1, and VEGFA from the TCGA GB microarray dataset (n = 547). For each gene, expression was normalized to the maximum expression values, sorted from max to min DUSP1 expression, and stratified into ten sample bins that are displayed as an average gene expression heatmap. Statistical comparisons between DUSP1 and five HIF1A transcriptional targets were performed using two-tailed, non-parametric Spearman correlation. b qPCR analysis of DUSP1 expression within GB tumor stem cells, serum-differentiated tumor stem cells (dTSCs), and U251/U343 GB cell lines cultured under normoxic (21% O2) or hypoxic (0.5% O2, 24 h) conditions. Data are presented as quantification relative to the average of normoxic controls on a log2 scale (n = 3 per group). Statistical analyses were performed using one-way ANOVA. (* = p < 0.05, ** = p < 0.01, *** = p < 0.001, **** = p < 0.0001)
Fig. 6
Fig. 6
DUSP1 regulation by GB chemotherapeutic agents. U251 and U343 GB cell lines (a) and GB TSCs (b) were treated with the steroid dexamethasone (DEX), or the chemotherapeutics temozolomide (TMZ), camptothecin (CPT), and topotecan (TOPO) for 24 h. Fold-induction responses for DUSP1 gene expression were determined by qPCR analysis relative to vehicle (DMSO) treated controls and are presented on a log2 scale (n = 3 per group). Statistical significance was assessed using one-way ANOVA with Bonferroni correction to account for multiple comparisons (**** = p < 0.0001)
Fig. 7
Fig. 7
DUSP1 expression correlates with markers of GB TSC differentiation. a Expression heat maps for DUSP1 and the differentiation markers ABCG2, PROM1, L1CAM, NANOG, and SOX2 in GB samples from the TCGA microarray dataset (n = 547). Gene expression was normalized to the maximum expression values, sorted from max to min DUSP1 expression, and stratified into ten sample bins that are displayed as an average gene expression heatmap. Significance testing was performed using two-tailed, non-parametric Spearman correlation of DUSP1 with the known TSC markers (* = p < 0.05, ** = p < 0.01, *** = p < 0.001, **** = p < 0.0001). b qPCR analysis of DUSP1 expression in a patient-derived GB TSC line cultured for three days in vitro under conditions of serum-based differentiation. Fold induction of DUSP1 are plotted against the Log2 scale for differentiated (dTSC) group relative to undifferentiated stem cells (TSCs; n = 3 per group). Significance testing was performed using a t-test (**** = p < 0.0001)
Fig. 8
Fig. 8
DUSP1 expression in perinecrotic regions within GB tumors. a) Quantification of TSC clusters identified and microdissected per GB subregion (LE = leading edge, IT = infiltrating tumor, CT = cellular tumor, CThbv = hyperplastic blood vessels, CTmvp = microvascular proliferation, CTpan = pseudopalisading cells around necrosis, CTpnz = perinecrotic zone) in Ivy GAP datasets. b DUSP1 RNA-seq data expressed as normalized fragments per kilobase of transcript per million mapped reads (FPKM) were obtained from the Ivy GAP consortium. TSC clusters identified in GB specimens were segmented into discrete tumor sub-regions including bulk cellular tumor (CT, n = 22), pseudopalisading cells around necrosis (CTpan, n = 16) and the perinecrotic zone (CTpnz, n = 26). Statistical analyses were performed using one-way ANOVA using Bonferroni to correct for multiple comparisons (ns = not significant)

Similar articles

Cited by

  • An anatomic transcriptional atlas of human glioblastoma.
    Puchalski RB, Shah N, Miller J, Dalley R, Nomura SR, Yoon JG, Smith KA, Lankerovich M, Bertagnolli D, Bickley K, Boe AF, Brouner K, Butler S, Caldejon S, Chapin M, Datta S, Dee N, Desta T, Dolbeare T, Dotson N, Ebbert A, Feng D, Feng X, Fisher M, Gee G, Goldy J, Gourley L, Gregor BW, Gu G, Hejazinia N, Hohmann J, Hothi P, Howard R, Joines K, Kriedberg A, Kuan L, Lau C, Lee F, Lee H, Lemon T, Long F, Mastan N, Mott E, Murthy C, Ngo K, Olson E, Reding M, Riley Z, Rosen D, Sandman D, Shapovalova N, Slaughterbeck CR, Sodt A, Stockdale G, Szafer A, Wakeman W, Wohnoutka PE, White SJ, Marsh D, Rostomily RC, Ng L, Dang C, Jones A, Keogh B, Gittleman HR, Barnholtz-Sloan JS, Cimino PJ, Uppin MS, Keene CD, Farrokhi FR, Lathia JD, Berens ME, Iavarone A, Bernard A, Lein E, Phillips JW, Rostad SW, Cobbs C, Hawrylycz MJ, Foltz GD. Puchalski RB, et al. Science. 2018 May 11;360(6389):660-663. doi: 10.1126/science.aaf2666. Science. 2018. PMID: 29748285 Free PMC article.
  • Behavioral and brain- transcriptomic synchronization between the two opponents of a fighting pair of the fish Betta splendens.
    Vu TD, Iwasaki Y, Shigenobu S, Maruko A, Oshima K, Iioka E, Huang CL, Abe T, Tamaki S, Lin YW, Chen CK, Lu MY, Hojo M, Wang HV, Tzeng SF, Huang HJ, Kanai A, Gojobori T, Chiang TY, Sun HS, Li WH, Okada N. Vu TD, et al. PLoS Genet. 2020 Jun 17;16(6):e1008831. doi: 10.1371/journal.pgen.1008831. eCollection 2020 Jun. PLoS Genet. 2020. PMID: 32555673 Free PMC article.
  • Decoding the secret of extracellular vesicles in the immune tumor microenvironment of the glioblastoma: on the border of kingdoms.
    Ghazi B, Harmak Z, Rghioui M, Kone AS, El Ghanmi A, Badou A. Ghazi B, et al. Front Immunol. 2024 Aug 29;15:1423232. doi: 10.3389/fimmu.2024.1423232. eCollection 2024. Front Immunol. 2024. PMID: 39267734 Free PMC article. Review.
  • Dual-Specificity Phosphatase Regulation in Neurons and Glial Cells.
    Pérez-Sen R, Queipo MJ, Gil-Redondo JC, Ortega F, Gómez-Villafuertes R, Miras-Portugal MT, Delicado EG. Pérez-Sen R, et al. Int J Mol Sci. 2019 Apr 23;20(8):1999. doi: 10.3390/ijms20081999. Int J Mol Sci. 2019. PMID: 31018603 Free PMC article. Review.
  • Identification and regulation of EMT cells in vivo by laser stimulation.
    Zhao X, Zhu G, Xue M, He H. Zhao X, et al. APL Bioeng. 2025 May 27;9(2):026119. doi: 10.1063/5.0268350. eCollection 2025 Jun. APL Bioeng. 2025. PMID: 40438388 Free PMC article.

References

    1. Rong Y, et al. 'Pseudopalisading' necrosis in glioblastoma: a familiar morphologic feature that links vascular pathology, hypoxia, and angiogenesis. J Neuropathol Exp Neurol. 2006;65(6):529–539. doi: 10.1097/00005072-200606000-00001. - DOI - PubMed
    1. Persano L, et al. The three-layer concentric model of glioblastoma: cancer stem cells, microenvironmental regulation, and therapeutic implications. Sci World J. 2011;11:1829–1841. doi: 10.1100/2011/736480. - DOI - PMC - PubMed
    1. Vartanian A, et al. GBM's multifaceted landscape: highlighting regional and microenvironmental heterogeneity. Neuro-Oncology. 2014;16(9):1167–1175. doi: 10.1093/neuonc/nou035. - DOI - PMC - PubMed
    1. Li Z, et al. Hypoxia-inducible factors regulate tumorigenic capacity of glioma stem cells. Cancer Cell. 2009;15(6):501–513. doi: 10.1016/j.ccr.2009.03.018. - DOI - PMC - PubMed
    1. Li Z et al. (2009) Hypoxia-inducible factors regulate tumorigenic capacity of glioma stem cells. In: Cancer Cell. Elsevier Ltd. p 501–513 - PMC - PubMed

LinkOut - more resources