. 2017 Nov;58(11):2147-2161.
doi: 10.1194/jlr.M079764. Epub 2017 Aug 19.

Loss of perilipin 2 in cultured myotubes enhances lipolysis and redirects the metabolic energy balance from glucose oxidation towards fatty acid oxidation

Affiliations

Loss of perilipin 2 in cultured myotubes enhances lipolysis and redirects the metabolic energy balance from glucose oxidation towards fatty acid oxidation

Yuan Z Feng et al. J Lipid Res. 2017 Nov.

Abstract

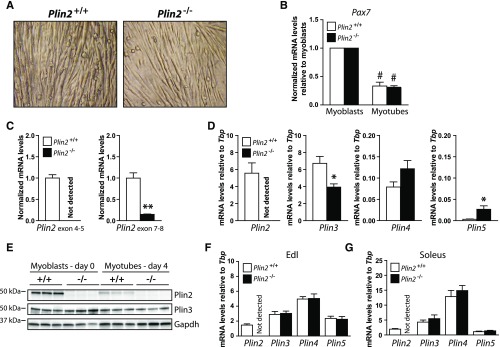
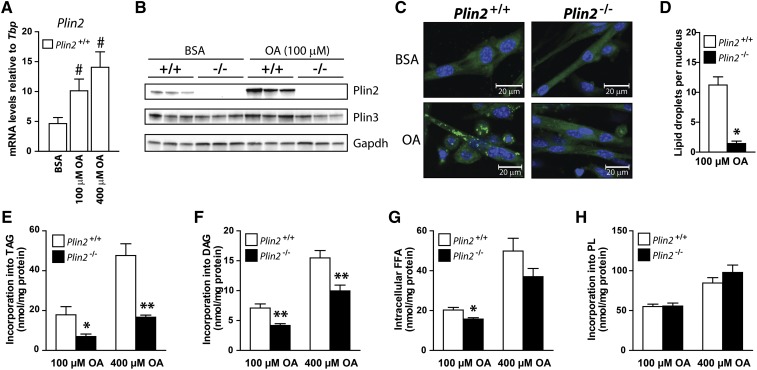
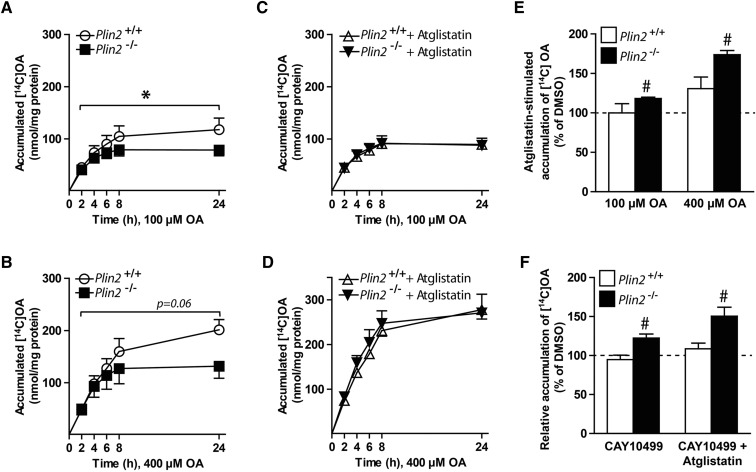
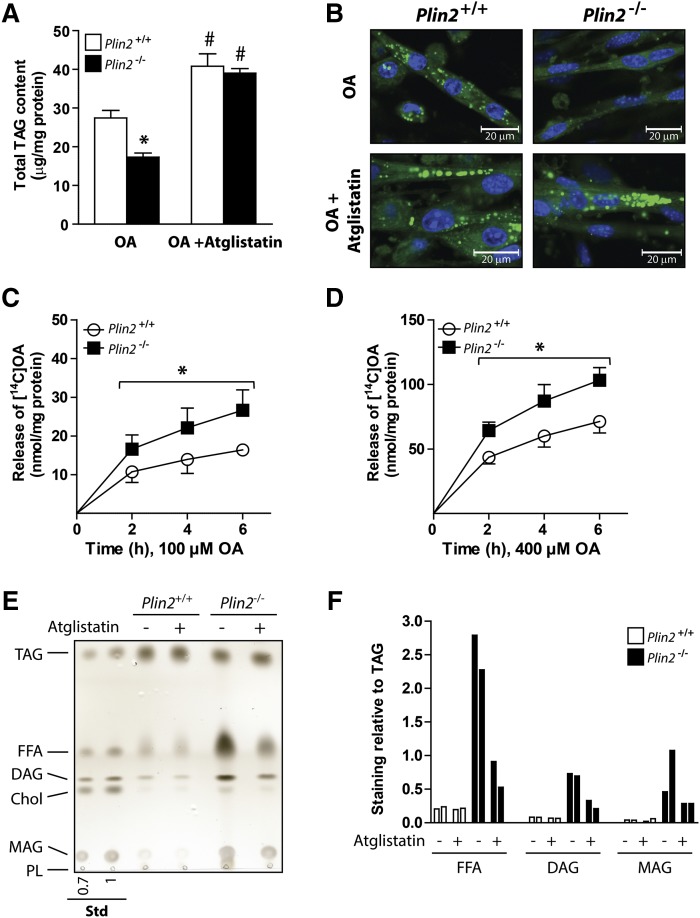
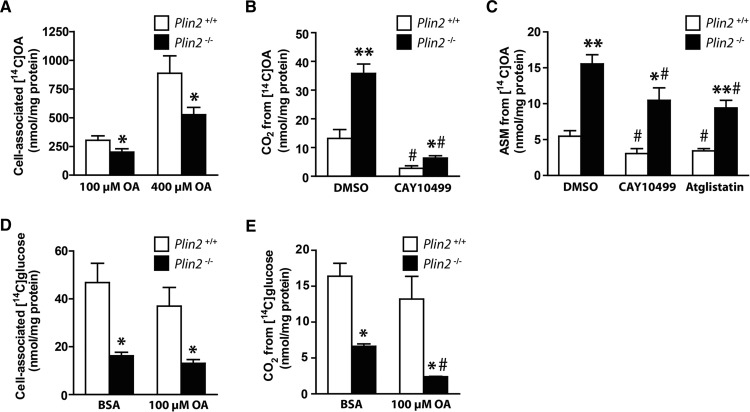
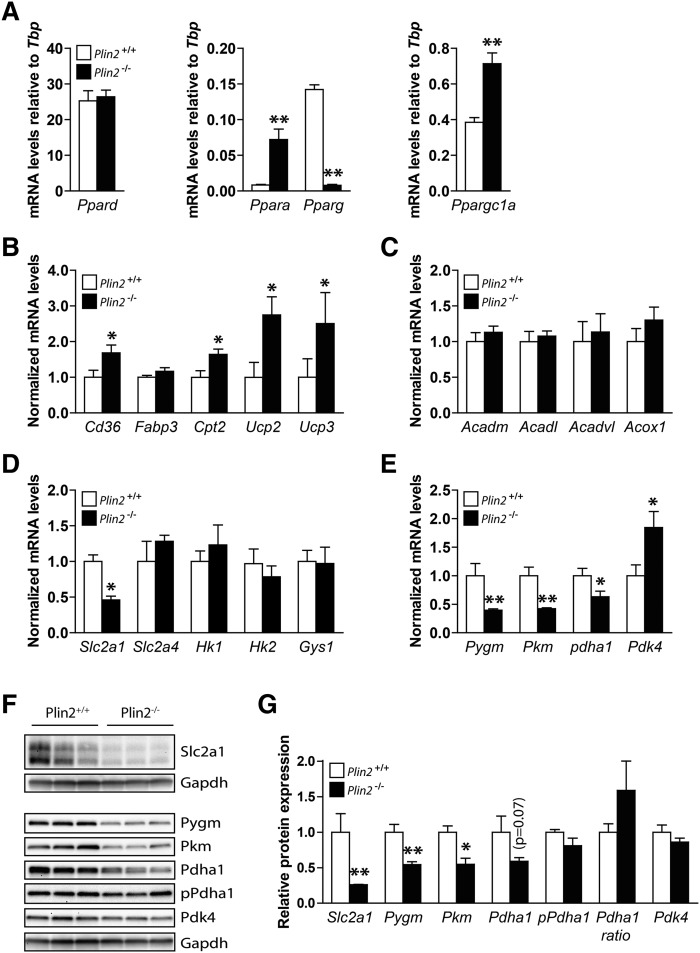
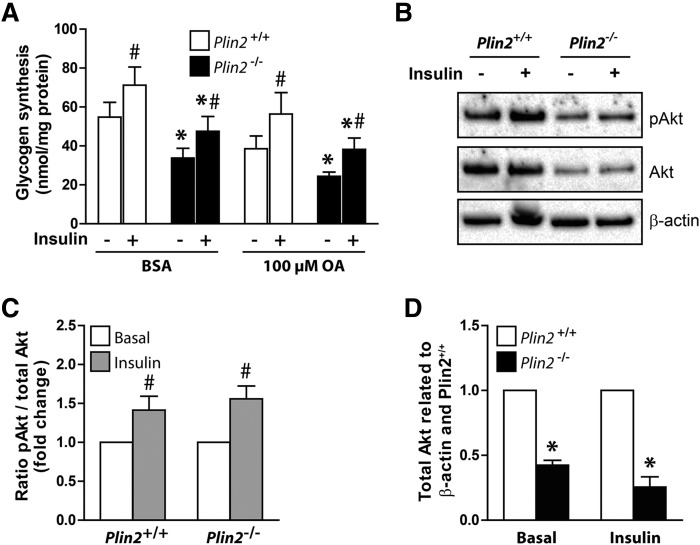
Lipid droplet (LD) coating proteins are essential for the formation and stability of intracellular LDs. Plin2 is an abundant LD coating protein in skeletal muscle, but its importance for muscle function is unclear. We show that myotubes established from Plin2-/- mice contain reduced content of LDs and accumulate less oleic acid (OA) in triacylglycerol (TAG) due to elevated LD hydrolysis in comparison with Plin2+/+ myotubes. The reduced ability to store TAG in LDs in Plin2-/- myotubes is accompanied by a shift in energy metabolism. Plin2-/- myotubes are characterized by increased oxidation of OA, lower glycogen synthesis, and reduced glucose oxidation in comparison with Plin2+/+ myotubes, perhaps reflecting competition between FAs and glucose as part of the Randle cycle. In accord with these metabolic changes, Plin2-/- myotubes have elevated expression of Ppara and Ppargc1a, transcription factors that stimulate expression of genes important for FA oxidation, whereas genes involved in glucose uptake and oxidation are suppressed. Loss of Plin2 had no impact on insulin-stimulated Akt phosphorylation. Our results suggest that Plin2 is essential for protecting the pool of skeletal muscle LDs to avoid an uncontrolled hydrolysis of stored TAG and to balance skeletal muscle energy metabolism.

Keywords: Plin2; fatty acid/metabolism; insulin signaling; lipid droplet; lipolysis and fatty acid metabolism; muscle; triacylglycerol.


Conflict of interest statement

The authors declare that they have no conflicts of interest with the contents of this article.

Figures

Fig. 1.
Fig. 1.
Expression of Plins in muscle and established Plin2+/+ and Plin2−/− myotubes and myoblasts. Primary muscle satellite cells (myoblasts) were isolated from the hind leg of Plin2+/+ and Plin2−/− mice. A: Established Plin2+/+ and Plin2−/− myoblast cultures differentiated equally well into multinucleated myotubes. B: Expression of Pax7 mRNA in relation to the expression of TATA-box binding protein (Tbp) determined by RT-qPCR. The results are presented normalized to the expression levels in undifferentiated myoblasts. C: RT-qPCR with primers amplifying across the Plin2 exon 4–5 junction and the Plin2 exon 7–8 junction in relation to the expression of Tbp and normalized to the expression levels in Plin2+/+ myotubes, confirmed the absence of exon 4-6 Plin2 mRNA sequences in Plin2−/− myotubes. D: Expression of Plin2, Plin3, Plin4, and Plin5 mRNAs determined by RT-qPCR in relation to the expression of Tbp. Results in B–D are presented as means ± SEM (n = 3–6, *P < 0.05 and **P < 0.01 vs. Plin2+/+ myotubes, #P < 0.05 vs. myoblasts). E: Expression of Plin2 and Plin3 proteins in myoblasts (day 0) and differentiated myotubes (day 4). The membrane contains samples from three independent experiments (n = 3). F: Relative mRNA expression of Plin2, Plin3, Plin4, and Plin5 in extensor digitorum longus of chow-fed 12-week-old Plin2+/+ and Plin2−/− male mice. G: Relative mRNA expression of Plin2, Plin3, Plin4, and Plin5 in soleus. Gene expression levels in F and G were determined by RT-qPCR and are presented in relation to the expression of Tbp as means ± SEM (n = 9 in each group). Edl, extensor digitorum longus; Pax7, paired box 7.
Fig. 2.
Fig. 2.
Lipid storage and distribution in Plin2+/+ and Plin2−/− myotubes. A–D: Myotubes were incubated for 24 h with BSA (40 µM) or OA (100 or 400 µM OA). A: Relative expression of Plin2 mRNA determined by RT-qPCR normalized to the expression of TATA-box binding protein (Tbp). Results are presented as means ± SEM (n = 3, #P < 0.05 vs. BSA). B: Expression of Plin2 and Plin3 proteins in myotubes. C: Lipid droplets (LDs) in Plin2+/+ and Plin2−/− myotubes were labeled with fluorescent dyes sequestering in neutral LDs (Bodipy 493/503, green) or nuclei (Hoechst 33342, blue). Representative confocal images are presented (×40 objective; inserted bars are 20 µm). D: Another set of images were acquired with a ×20 objective with an Olympus IX81 fluorescence microscope. Images were analyzed by Scan^R analytical software by comparing the number of stained LDs in relation to the number of nuclei per image, with an average total of 150 images per parameter. Results are presented as means ± SEM (n = 3, *P < 0.05 vs. Plin2 +/+). E–H: Myotubes were preincubated for 24 h with [1-14C]OA to label accumulated lipids. The content of radiolabeled TAG (E), DAG (F), FFA (G), and PL (H) in myotubes was determined by TLC and related to cellular protein content. The results are presented as means ± SEM (n = 6, *P < 0.05, **P < 0.01 vs. Plin2+/+).
Fig. 3.
Fig. 3.
Accumulation of oleic acid in Plin2+/+ and Plin2−/− myotubes. Myotubes were incubated with [1-14C]OA (100 or 400 µM) and accumulation over 24 h was determined with scintillation proximity assay. Accumulation was determined in presence of DMSO (0.1%) (A, B) or in presence of the adipose triglyceride lipase inhibitor (Atglistatin, 10 µM) (C, D). The results are presented as means ± SEM (n = 3, *P < 0.05 vs. Plin2+/+ across all points in time). E: The effect of Atglistatin on accumulation of [1-14C]OA assessed as an average of all time points from A–D. F: Cell-associated [1-14C]OA after 24 h incubation with 100 μM OA in presence of the lipase inhibitor (CAY10499, 10 μM) or CAY10499 combined with Atglistatin (10 μM). For E and F, the results are presented as means ± SEM normalized to DMSO treated Plin2+/+ myotubes (n = 3, #P < 0.05 vs. DMSO).
Fig. 4.
Fig. 4.
Lipolysis in OA-loaded Plin2+/+ and Plin2−/− myotubes. Myotubes were incubated for 24 h with OA (100 μM) alone (0.1% DMSO) or in the presence of the adipose triglyceride lipase inhibitor Atglistatin (10 µM). A: Total triacylglycerol (TAG) content in Plin2+/+ and Plin2−/− myotubes. The results are presented as means ± SEM (n = 3, *P < 0.05 vs. Plin2+/+, #P < 0.05 vs. OA). B: Confocal pictures of Plin2+/+ and Plin2−/− myotubes. Fixated myotubes were labeled with fluorescent dyes sequestering in neutral lipid droplets (Bodipy 493/503, green) or in nuclei (Hoechst 33342, blue). C, D: Lipolysis (efflux) of OA after 24 h accumulation with [1-14C]OA (100 or 400 µM) in the presence of Atglistatin (10 µM). The results are presented as the release of accumulated [1-14C]OA to the medium at the various time points given as means ± SEM (n = 3–7, *P < 0.05 vs. Plin2+/+ across all time points). E: Cells were incubated with OA (200 μM) alone or in combination with Atglistatin (10 µM) for 24 h prior to isolation of lipid droplets and separation of lipid species with TLC. One representative of two independent experiments is shown. F: Staining intensities for the various bands in relation to the TAG signal (n = 2). Chol, cholesterol; Std, standard.
Fig. 5.
Fig. 5.
Cell-associated radioactivity and oxidation of OA and glucose in Plin2+/+ and Plin2−/− myotubes. For measurement of cell-associated radioactivity and oxidation of fatty acids (A–C), myotubes were preincubated with [1-14C]OA (100 or 400 µM) alone (0.1% DMSO) or in the presence of CAY10499 (10 µM) or Atglistatin (10 µM) for 24 h and then subjected to FA substrate oxidation assay for 4 h. A: Total cell-associated [14C]radioactivity remaining in Plin2+/+ and Plin2−/− myotubes after 4 h. B: Released CO2 arising from accumulated [14C]radioactivity after 4 h. C: FA intermediary oxidation products measured as [14C]radiolabeled ASMs released from the myotubes into the cell media during 24 h incubation with [14C]OA. The results are presented as means ± SEM (n = 3–7, *P < 0.05 and **P < 0.01 vs. Plin2+/+, #P < 0.05 vs. DMSO). For measurement of cell-associated radioactivity and oxidation of glucose (D, E), myotubes were preincubated with BSA (40 μM, i.e., basal) or OA (100 µM) for 24 h, before myotubes were incubated with D-[14C(U)]glucose and subjected to glucose substrate oxidation assay for 4 h. D: Total cell-associated [14C]radioactivity accumulated in myotubes after 4 h. E: Released CO2 from oxidation of D-[14C(U)]glucose. Results are presented as means ± SEM (n = 3–6, *P < 0.05 vs. Plin2+/+, #P < 0.05 vs. BSA).
Fig. 6.
Fig. 6.
Expression of genes involved in lipid metabolism in Plin2+/+ and Plin2−/− myotubes. Gene expression of various mRNAs in differentiated Plin2+/+ and Plin2−/− myotubes was analyzed by RT-qPCR and related to the expression of TATA-box binding protein (Tbp). A: Expression of transcription factors activated by FAs; Ppar α, γ and δ and Ppar γ coactivator 1 α (Ppargc1a). Results are presented as means ± SEM (n = 4, *P < 0.05 and **P < 0.01 vs. Plin2+/+). B: Expression of genes involved in lipid uptake and mitochondrial function; FA transporter/CD36 antigen (Cd36), Fabp3, Cpt2, and uncoupling proteins 2 and 3 (Ucp2 and Ucp3, respectively). C: Expression of genes catalyzing oxidation of FAs; mitochondrial Acadm, Acadl, Acadvl, and peroxisomal Acox1. D: Expression of genes involved in glucose uptake and storage; solute carrier family 2 member 1 and 4 (Slc2a1 and Slc2a4, respectively), hexokinase 1 and 2 (Hk1 and Hk2, respectively) and Gys1. E: Expression of genes involved in glycogen mobilization and glucose oxidation; muscle-associated glycogen phosphorylase(Pygm), muscle pyruvate kinase (Pkm), pyruvate dehydrogenase α 1 (Pdha1), and pyruvate dehydrogenase kinase 4 (Pdk4). Results in B–F are presented as means ± SEM normalized to the expression in Plin2+/+ myotubes (n = 5, *P < 0.05, **P < 0.01 vs. Plin2+/+). F: Protein content of Slc2a1, Pygm, Pkm, Pdha1, Pdha1 phosphorylated at Ser300 (pPdha1), and Pdk4 (n = 3). G: Protein content, related to Gapdh normalized to the expression levels in Plin2+/+ myotubes, or the ratio of pPdha1 against total Pdha1 (Pdha1 ratio). The results are presented as means ± SEM (n = 3, *P < 0.05 vs. Plin2+/+).
Fig. 7.
Fig. 7.
Effect of insulin in Plin2+/+ and Plin2−/− myotubes. A: Myotubes were preincubated with BSA (40 μM) or OA (100 µM) for 24 h. Glycogen synthesis was subsequently measured as incorporation of D-[14C(U)]glucose into glycogen in the absence or presence of insulin (100 nM) for 3 h. B: Myotubes were preincubated with OA (100 μM) for 24 h, then incubated in glucose-free medium supplemented with OA (100 μM) for 2 h, and subsequently incubated in medium containing glucose (5.5 mM) with or without insulin (100 nM) for 15 min. Cell samples were subjected for immunoblotting analysis with antibodies against total Akt (Akt1-3), pAkt (Ser473), and β-actin (housekeeping protein). Immunoblots from one representative experiment are shown. C: Ratio of pAkt/total Akt related to myotubes receiving no insulin. D: The content of total Akt related to β-actin normalized to expression levels in Plin2+/+ myotubes. The results are presented as means ± SEM (n = 4, *P < 0.05 vs. Plin2+/+ with the same treatment, #P < 0.05 vs. without insulin). pAkt, phosphorylated Akt.

References

    1. Hue L., and Taegtmeyer H.. 2009. The Randle cycle revisited: a new head for an old hat. Am. J. Physiol. Endocrinol. Metab. 297: E578–E591. - PMC - PubMed
    1. Eckardt K., Taube A., and Eckel J.. 2011. Obesity-associated insulin resistance in skeletal muscle: role of lipid accumulation and physical inactivity. Rev. Endocr. Metab. Disord. 12: 163–172. - PubMed
    1. Samuel V. T., and Shulman G. I.. 2012. Mechanisms for insulin resistance: common threads and missing links. Cell. 148: 852–871. - PMC - PubMed
    1. Pan D. A., Lillioja S., Kriketos A. D., Milner M. R., Baur L. A., Bogardus C., Jenkins A. B., and Storlien L. H.. 1997. Skeletal muscle triglyceride levels are inversely related to insulin action. Diabetes. 46: 983–988. - PubMed
    1. Jacob S., Machann J., Rett K., Brechtel K., Volk A., Renn W., Maerker E., Matthaei S., Schick F., Claussen C. D., et al. . 1999. Association of increased intramyocellular lipid content with insulin resistance in lean nondiabetic offspring of type 2 diabetic subjects. Diabetes. 48: 1113–1119. - PubMed

Publication types

LinkOut - more resources