. 2017 Dec 1;313(6):H1119-H1129.
doi: 10.1152/ajpheart.00284.2017. Epub 2017 Aug 19.

Temporal dynamics of cardiac hypertrophic growth in response to pressure overload

Affiliations

Temporal dynamics of cardiac hypertrophic growth in response to pressure overload

Yuan Wang et al. Am J Physiol Heart Circ Physiol. .

Abstract

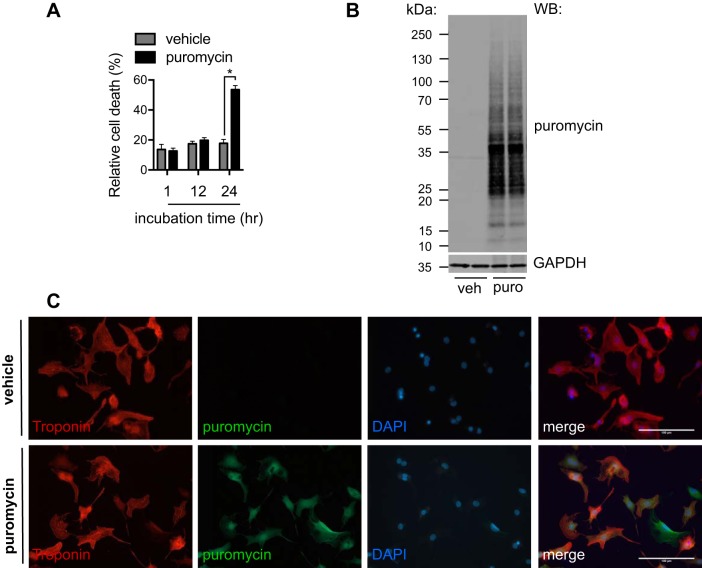
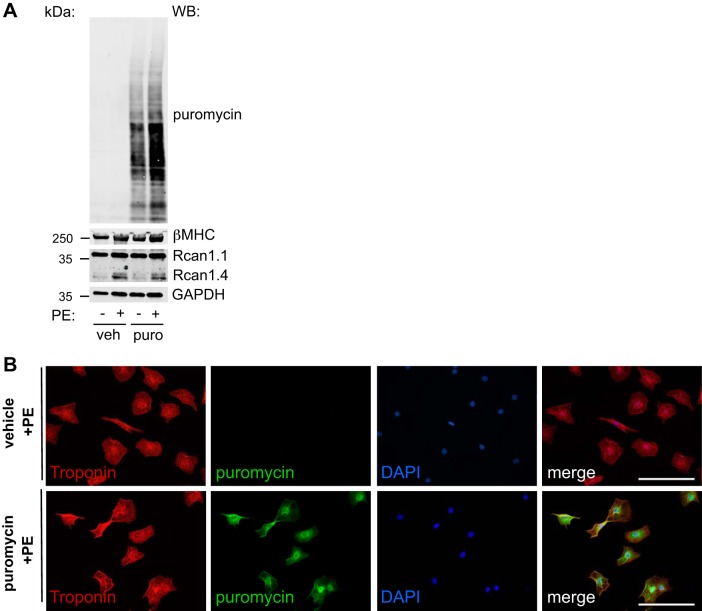
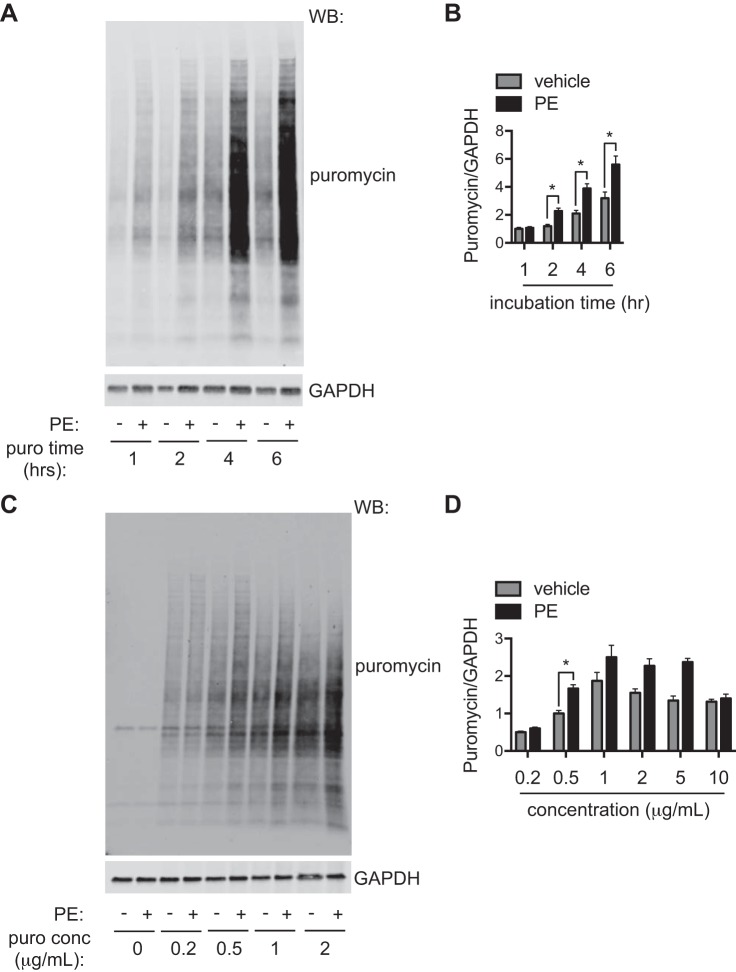
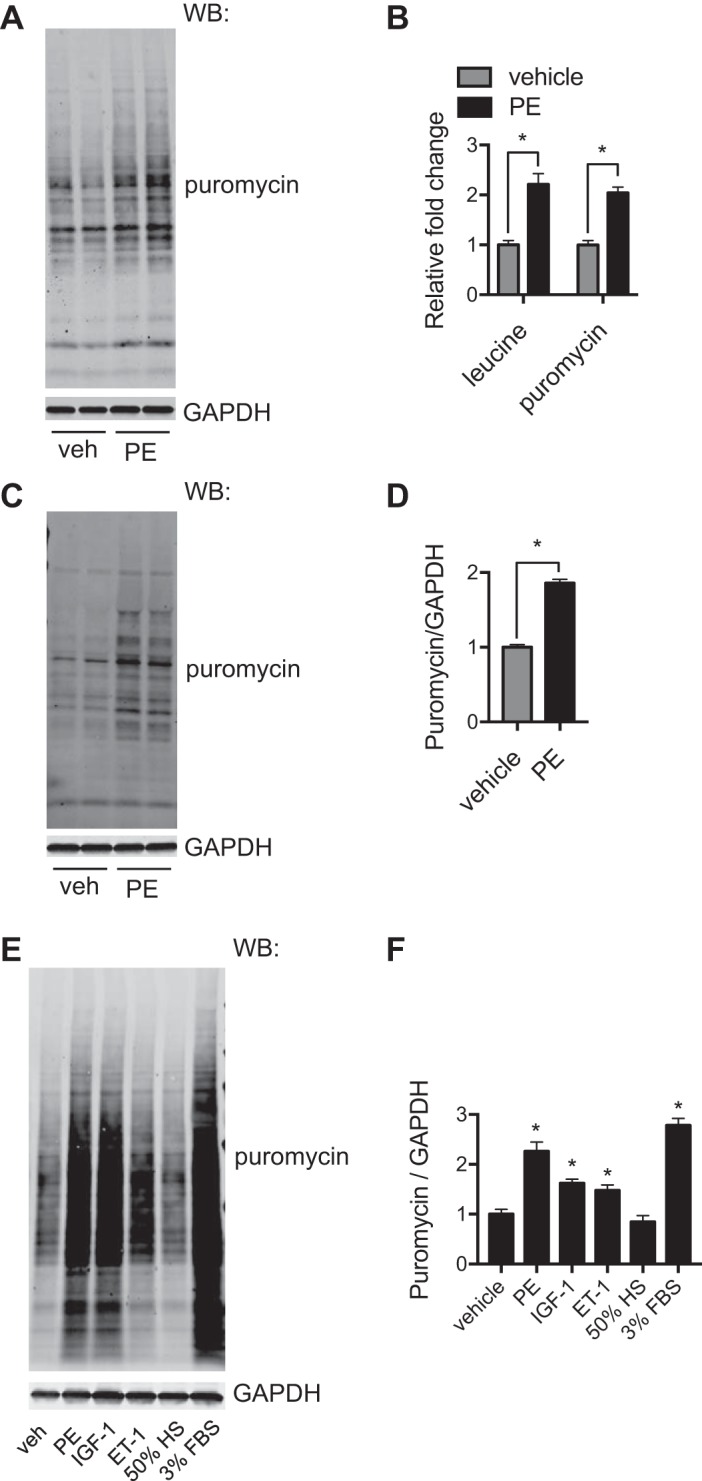
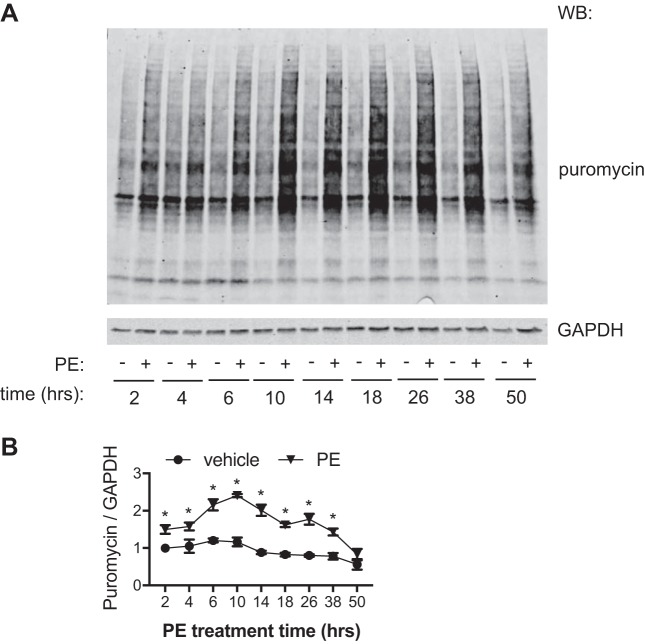
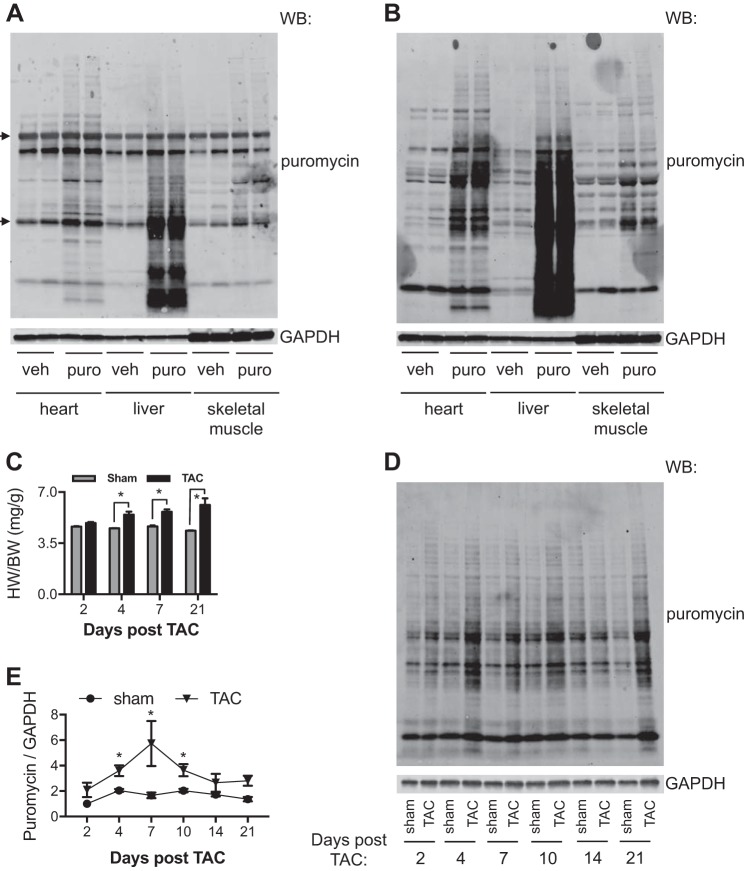
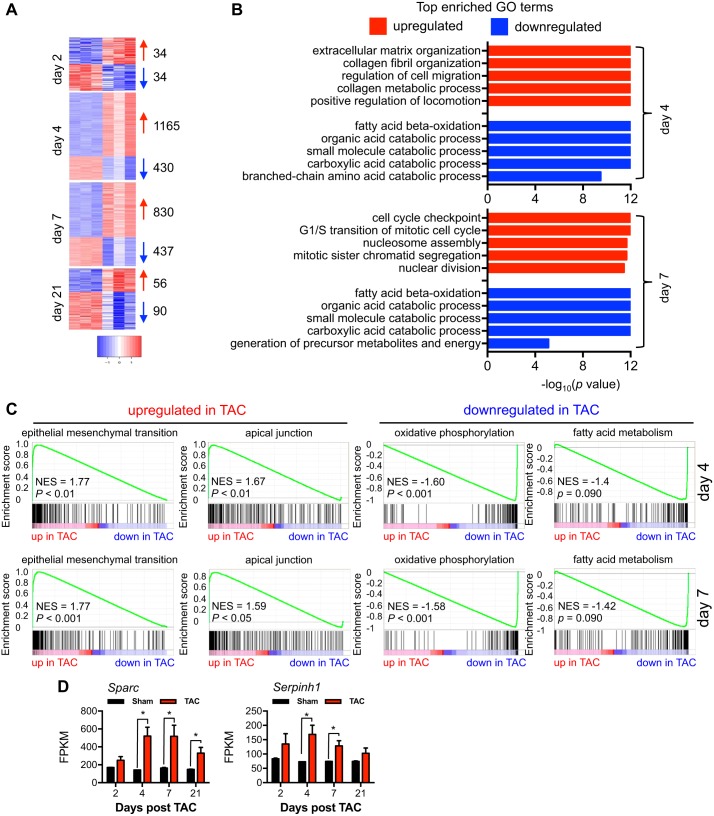
Hypertension is one of the most important risk factors of heart failure. In response to high blood pressure, the left ventricle manifests hypertrophic growth to ameliorate wall stress, which may progress into decompensation and trigger pathological cardiac remodeling. Despite the clinical importance, the temporal dynamics of pathological cardiac growth remain elusive. Here, we took advantage of the puromycin labeling approach to measure the relative rates of protein synthesis as a way to delineate the temporal regulation of cardiac hypertrophic growth. We first identified the optimal treatment conditions for puromycin in neonatal rat ventricular myocyte culture. We went on to demonstrate that myocyte growth reached its peak rate after 8-10 h of growth stimulation. At the in vivo level, with the use of an acute surgical model of pressure-overload stress, we observed the maximal growth rate to occur at day 7 after surgery. Moreover, RNA sequencing analysis supports that the most profound transcriptomic changes occur during the early phase of hypertrophic growth. Our results therefore suggest that cardiac myocytes mount an immediate growth response in reply to pressure overload followed by a gradual return to basal levels of protein synthesis, highlighting the temporal dynamics of pathological cardiac hypertrophic growth.NEW & NOTEWORTHY We determined the optimal conditions of puromycin incorporation in cardiac myocyte culture. We took advantage of this approach to identify the growth dynamics of cardiac myocytes in vitro. We went further to discover the protein synthesis rate in vivo, which provides novel insights about cardiac temporal growth dynamics in response to pressure overload.

Keywords: cardiac myocyte; growth dynamics; pathological cardiac hypertrophy; pressure overload; puromycin.


Figures

Fig. 1.
Fig. 1.
Labeling cellular proteins by puromycin (puro). A: cytotoxic effects of puromycin treatment. Neonatal rat ventricular myocytes (NRVMs) were incubated with 1 μg/ml puromycin for different times. Relative cell death was determined by release of lactate dehydrogenase. Puromycin treatment was well tolerated until 24 h. B: the labeling of cellular proteins by puromycin. NRVMs were treated by puromycin for 6 h. Total proteins were isolated for immunoblot analysis [Western blot (WB)]. There was no detectable signal in vehicle (veh)-treated groups, highlighting the specificity of the puromycin method. C: immunofluorescence staining to confirm the incorporation of puromycin into NRVMs. The cells were similarly treated, and immunostaining for puromycin was conducted. Note that there was no puromycin signal in the vehicle-treated group. Troponin was used as a marker of cardiac myocytes. DAPI, 4′,6′-diamidino-2-phenylindole. Original scale bars = 100 μm. n = 3. *P < 0.05.
Fig. 2.
Fig. 2.
Puromycin (puro) labeling under hypertrophic growth. A: hypertrophic growth in neonatal rat ventricular myocytes (NRVMs). Puromycin was introduced to monitor cell growth, which did not affect the induction of β-myosin heavy chain (β-MHC) or regulator of calcineurin 1.4 (Rcan1.4), two markers of hypertrophic growth. B: immunofluorescence staining showed incorporation of puromycin after phenylephrine (PE) treatment in NRVMs. WB, Western blot analysis; veh, vehicle; DAPI, 4′,6′-diamidino-2-phenylindole. Original scale bars = 100 μm.
Fig. 3.
Fig. 3.
Optimizing the conditions of puromycin (puro) labeling. A: optimizing the incubation time of puromycin. Phenylephrine (PE) was used to trigger hypertrophic growth in neonatal rat ventricular myocytes (NRVMs) for 48 h. At the end of the treatment, puromycin was introduced for 1, 2, 4, or 6 h. Immunoblot analysis was conducted to examine puromycin incorporation. B: puromycin inclusion for 2, 4, or 6 h showed significant increases in PE-treated groups compared with control samples. However, puromycin incorporation was increased in vehicle-treated samples after 4 and 6 h of incubation. We conclude that 2 h of puromycin administration is the most optimal incubation time. C: optimizing the concentration of puromycin. Various doses of puromycin were used at the end of PE treatment for 2 h. Western blot (WB) analysis was used to analyze puromycin incorporation. D: higher doses of puromycin led to increases in the puromycin signal. However, the basal incorporation rate was also elevated in vehicle-treated groups. We conclude that 0.5 μg/ml is the best dose to label cellular proteins. n = 6–9. *P < 0.05.
Fig. 4.
Fig. 4.
Comparison of the puromycin (puro) method with the radioactive amino acid labeling assay. A: puromycin incorporation under the hypertrophic growth condition. Neonatal rat ventricular myocytes (NRVMs) were treated with phenylephrine (PE) for 24 h. At the last 2 h, puromycin was included, and cellular lysates were subjected to immunoblot analysis. B: NRVMs with the same treatment condition were used for [3H]leucine labeling. Comparison between these two methods showed similar increases after PE treatment. We conclude that the puromycin method is equally sensitive compared with the conventional radioactive amino acid labeling approach. C: puromycin labeling was used to monitor hypertrophic growth in adult mouse ventricular myocytes (AMVMs). Here, AMVMs were treated by PE for 24 h. Puromycin was introduced at the last hour of treatment. Protein lysates were used for immunoblot analysis. D: quantification showed that PE induced significant hypertrophy in AMVMs. E: puromycin labeling was conducted to examine hypertrophic effects of different stimuli. NRVMs were subjected to various treatments and puromycin incorporation, which were later visualized by immunoblot analysis. F: quantification of the puromycin signal over controls showed significant increases in puromycin incorporation in most hypertrophic treatments. WB, Western blot analysis; veh, vehicle; IGF-1, insulin-like growth factor 1; ET-1, endothelin-1; HS, hyposmotic solution. n = 3–4/group. *P < 0.05.
Fig. 5.
Fig. 5.
Temporal dynamics of hypertrophic growth in neonatal rat ventricular myocytes (NRVMs). A: NRVMs were treated with phenylephrine (PE) for 48 h. At different times of the treatment, puromycin was added for 2 h. Cells were then harvested to examine the hypertrophic growth rate by puromycin incorporation. B: quantification showed that the growth rate triggered by PE reached peak at 10 h posttreatment. The growth then slowed down to basal levels at the end of the treatment. WB, Western blot analysis. n = 3–9 for each group. *P < 0.05 for PE-treated groups compared with the respective vehicle control groups.
Fig. 6.
Fig. 6.
Pathological hypertrophic growth in vivo. A: detection of puromycin (puro) incorporation by immunoblot analysis was complicated by endogenous IgG. Puromycin was administered by intraperitoneal injection in C57BL/6 mice. Animal tissues were harvested for Western blot (WB) analysis. The secondary antibodies used also recognized endogenous IgG heavy chains and light chains (arrows). B: specific secondary antibodies against IgG2a, the same isotype of anti-puromycin monoclonal antibody, were used for immunoblot analysis, which showed significantly less background. C: thoracic aortic constriction (TAC) induced cardiac hypertrophy, as shown by increases in ratios of heart weight to body weight (HW/BW). D: temporal dynamics of cardiac hypertrophy was examined by puromycin immunoblot analysis. Puromycin was injected 30 min before euthanasia. Cardiac tissues were subjected to WB analysis to detect the hypertrophic growth rate. E: quantification showed that cardiac hypertrophic growth reached the peak rate at day 7 after TAC surgery. veh, vehicle. *P < 0.05.
Fig. 7.
Fig. 7.
Global analysis of gene expression during cardiac hypertrophic growth. A: RNA-Seq analysis showed that days 4 and 7 were the times with most profound transcriptomic changes. Numbers of genes with significant changes are shown at right. B: the top 5 most enriched Gene Ontology (GO) pathways are shown for both days 4 and 7 after thoracic aortic constriction (TAC). C: based on gene set enrichment analysis analysis, the top up- or downregulated pathways at days 4 and 7 are shown. NES, normalized enrichment score. D: gene expression of secreted protein acidic and rich in cysteine (Sparc) and Serine-arginine protease inhibitor peptidase inhibitor, clade H, member 1 (Serpinh1), two proteins involved in extracellular matrix remodeling and fibrosis, showed a similar temporal dynamics as cardiac hypertrophic growth. FPKM, fragments per kilobases per million fragments. n = 3 for each group. *P < 0.05.

References

    1. Akazawa H, Komuro I. Roles of cardiac transcription factors in cardiac hypertrophy. Circ Res 92: 1079–1088, 2003. doi:10.1161/01.RES.0000072977.86706.23. - DOI - PubMed
    1. Ardehali H, Sabbah HN, Burke MA, Sarma S, Liu PP, Cleland JG, Maggioni A, Fonarow GC, Abel ED, Campia U, Gheorghiade M. Targeting myocardial substrate metabolism in heart failure: potential for new therapies. Eur J Heart Fail 14: 120–129, 2012. doi:10.1093/eurjhf/hfr173. - DOI - PMC - PubMed
    1. Aviner R, Geiger T, Elroy-Stein O. Genome-wide identification and quantification of protein synthesis in cultured cells and whole tissues by puromycin-associated nascent chain proteomics (PUNCH-P). Nat Protoc 9: 751–760, 2014. doi:10.1038/nprot.2014.051. - DOI - PubMed
    1. Benjamin EJ, Blaha MJ, Chiuve SE, Cushman M, Das SR, Deo R, de Ferranti SD, Floyd J, Fornage M, Gillespie C, Isasi CR, Jiménez MC, Jordan LC, Judd SE, Lackland D, Lichtman JH, Lisabeth L, Liu S, Longenecker CT, Mackey RH, Matsushita K, Mozaffarian D, Mussolino ME, Nasir K, Neumar RW, Palaniappan L, Pandey DK, Thiagarajan RR, Reeves MJ, Ritchey M, Rodriguez CJ, Roth GA, Rosamond WD, Sasson C, Towfighi A, Tsao CW, Turner MB, Virani SS, Voeks JH, Willey JZ, Wilkins JT, Wu JH, Alger HM, Wong SS, Muntner P; American Heart Association Statistics Committee and Stroke Statistics Subcommittee . Heart disease and stroke statistics−2017 update: a report from the American Heart Association. Circulation 135: e146–e603, 2017. doi:10.1161/CIR.0000000000000485. - DOI - PMC - PubMed
    1. Berry JM, Le V, Rotter D, Battiprolu PK, Grinsfelder B, Tannous P, Burchfield JS, Czubryt M, Backs J, Olson EN, Rothermel BA, Hill JA. Reversibility of adverse, calcineurin-dependent cardiac remodeling. Circ Res 109: 407–417, 2011. doi:10.1161/CIRCRESAHA.110.228452. - DOI - PMC - PubMed

MeSH terms