Welfare-to-work interventions and their effects on the mental and physical health of lone parents and their children
- PMID: 28823111
- PMCID: PMC6483471
- DOI: 10.1002/14651858.CD009820.pub2
Welfare-to-work interventions and their effects on the mental and physical health of lone parents and their children
Update in
-
Welfare-to-work interventions and their effects on the mental and physical health of lone parents and their children.Cochrane Database Syst Rev. 2018 Feb 26;2(2):CD009820. doi: 10.1002/14651858.CD009820.pub3. Cochrane Database Syst Rev. 2018. PMID: 29480555 Free PMC article.
Abstract
Background: Lone parents in high-income countries have high rates of poverty (including in-work poverty) and poor health. Employment requirements for these parents are increasingly common. 'Welfare-to-work' (WtW) interventions involving financial sanctions and incentives, training, childcare subsidies and lifetime limits on benefit receipt have been used to support or mandate employment among lone parents. These and other interventions that affect employment and income may also affect people's health, and it is important to understand the available evidence on these effects in lone parents.
Objectives: To assess the effects of WtW interventions on mental and physical health in lone parents and their children living in high-income countries. The secondary objective is to assess the effects of welfare-to-work interventions on employment and income.
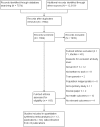
Search methods: We searched the Cochrane Central Register of Controlled Trials (CENTRAL), MEDLINE Ovid, Embase Ovid, PsycINFO EBSCO, ERIC EBSCO, SocINDEX EBSCO, CINAHL EBSCO, Econlit EBSCO, Web of Science ISI, Applied Social Sciences Index and Abstracts (ASSIA) via Proquest, International Bibliography of the Social Sciences (IBSS) via ProQuest, Social Services Abstracts via Proquest, Sociological Abstracts via Proquest, Campbell Library, NHS Economic Evaluation Database (NHS EED) (CRD York), Turning Research into Practice (TRIP), OpenGrey and Planex. We also searched bibliographies of included publications and relevant reviews, in addition to many relevant websites. We identified many included publications by handsearching. We performed the searches in 2011, 2013 and April 2016.
Selection criteria: Randomised controlled trials (RCTs) of mandatory or voluntary WtW interventions for lone parents in high-income countries, reporting impacts on parental mental health, parental physical health, child mental health or child physical health.
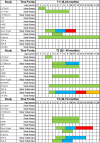
Data collection and analysis: One review author extracted data using a standardised extraction form, and another checked them. Two authors independently assessed risk of bias and the quality of the evidence. We contacted study authors to obtain measures of variance and conducted meta-analyses where possible. We synthesised data at three time points: 18 to 24 months (T1), 25 to 48 months (T2) and 49 to 72 months (T3).
Main results: Twelve studies involving 27,482 participants met the inclusion criteria. Interventions were either mandatory or voluntary and included up to 10 discrete components in varying combinations. All but one study took place in North America. Although we searched for parental health outcomes, the vast majority of the sample in all included studies were female. Therefore, we describe adult health outcomes as 'maternal' throughout the results section. We downgraded the quality of all evidence at least one level because outcome assessors were not blinded. Follow-up ranged from 18 months to six years. The effects of welfare-to-work interventions on health were generally positive but of a magnitude unlikely to have any tangible effects.At T1 there was moderate-quality evidence of a very small negative impact on maternal mental health (standardised mean difference (SMD) 0.07, 95% Confidence Interval (CI) 0.00 to 0.14; N = 3352; studies = 2)); at T2, moderate-quality evidence of no effect (SMD 0.00, 95% CI 0.05 to 0.05; N = 7091; studies = 3); and at T3, low-quality evidence of a very small positive effect (SMD -0.07, 95% CI -0.15 to 0.00; N = 8873; studies = 4). There was evidence of very small positive effects on maternal physical health at T1 (risk ratio (RR) 0.85, 95% CI 0.54 to 1.36; N = 311; 1 study, low quality) and T2 (RR 1.06, 95% CI 0.95 to 1.18; N = 2551; 2 studies, moderate quality), and of a very small negative effect at T3 (RR 0.97, 95% CI 0.91 to 1.04; N = 1854; 1 study, low quality).At T1, there was moderate-quality evidence of a very small negative impact on child mental health (SMD 0.01, 95% CI -0.06 to 0.09; N = 2762; studies = 1); at T2, of a very small positive effect (SMD -0.04, 95% CI -0.08 to 0.01; N = 7560; studies = 5), and at T3, there was low-quality evidence of a very small positive effect (SMD -0.05, 95% CI -0.16 to 0.05; N = 3643; studies = 3). Moderate-quality evidence for effects on child physical health showed a very small negative effect at T1 (SMD -0.05, 95% CI -0.12 to 0.03; N = 2762; studies = 1), a very small positive effect at T2 (SMD 0.07, 95% CI 0.01 to 0.12; N = 7195; studies = 3), and a very small positive effect at T3 (SMD 0.01, 95% CI -0.04 to 0.06; N = 8083; studies = 5). There was some evidence of larger negative effects on health, but this was of low or very low quality.There were small positive effects on employment and income at 18 to 48 months (moderate-quality evidence), but these were largely absent at 49 to 72 months (very low to moderate-quality evidence), often due to control group members moving into work independently. Since the majority of the studies were conducted in North America before the year 2000, generalisabilty may be limited. However, all study sites were similar in that they were high-income countries with developed social welfare systems.
Authors' conclusions: The effects of WtW on health are largely of a magnitude that is unlikely to have tangible impacts. Since income and employment are hypothesised to mediate effects on health, it is possible that these negligible health impacts result from the small effects on economic outcomes. Even where employment and income were higher for the lone parents in WtW, poverty was still high for the majority of the lone parents in many of the studies. Perhaps because of this, depression also remained very high for lone parents whether they were in WtW or not. There is a lack of robust evidence on the health effects of WtW for lone parents outside North America.
Conflict of interest statement
MG: none known.
HT: none known.
KB: none known.
VL: none known.
MJM: none known.
SPM: none known.
CF: none known.
CB: none known.
LB: none known.
Figures


References
References to studies included in this review
-
- Riccio JA, Friedlander D, Freedman S, Farrell M, Fellerath V, Fox S, Lehman DJ. GAIN: Benefits, Costs, and Three‐Year Impacts of a Welfare‐To‐Work Program. New York: Manpower Demonstration Research Corporation, 1994.
-
- Bloom D, Scrivener S, Michalopoulos C, Morris P, Hendra R, Adams‐Ciardullo D, et al. Jobs First: Final Report on Connecticut's Welfare Reform Initiative. Summary Report. New York: Manpower Demonstration Research Corporation, 2002.
- Muennig, P, Caleyachetty, R, Rosen, Z, & Korotzer, A. More money, fewer lives: the cost effectiveness of welfare reform in the United States. American Journal of Public Health 2015;105(2):324‐328. - PMC - PubMed
- Wilde ET, Rosen Z, Couch K, Muennig PA. Impact of welfare reform on mortality: an evaluation of the Connecticut Jobs First program, a randomized controlled trial. American Journal of Public Health 2014;104(3):534‐8. - PMC - PubMed
-
- Fuller B, Kagan S, Loeb S, Carroll J, McCarthy J, Krelcher G, et al. New Lives for Poor Families? Mothers and Young Children Move Through Welfare Reform. The Growing Up in Poverty Project. [place unknown]: The University of California, 2002.
- Fuller B, Kagan SL. Remember the Children: Mothers Balance Work and Child Care under Welfare Reform. Growing Up in Poverty Project 2000; Wave 1 Findings ‐ California, Connecticut, Florida. [place unknown]: University of California, 2000.
-
- Horwitz SM, Kerker BD. Impediments to employment under welfare reform: the importance of physical health and psychosocial characteristics. Women & Health 2001;32(1):101‐17. - PubMed
- Horwitz SM, Kerker BD. Preschool and school age children under welfare reform. Child Psychiatry and Human Development 2001;32(2):107‐24. - PubMed
-
- Bloom D, Kemple JJ, Morris P, Scrivener S, Verma N, Hendra R, et al. The Family Transition Program: Final Report on Florida's Initial Time‐limited Welfare Program. New York: Manpower Demonstration Research Corporation2000.
- Muennig P, Rosen Z, Wilde ET. Welfare Programs That Target Workforce Participation May Negatively Affect Mortality Erratum. Health Affairs 2014;33(6):1104. - PubMed
- Muennig P, Rosen Z, Wilde ET. Welfare programs that target workforce participation may negatively affect mortality. Health Affairs 2013;32(6):1072‐7. - PubMed
- Muennig, P. Caleyachetty, R, Rosen, Z, & Korotzer, A. More money, fewer lives: the cost effectiveness of welfare reform in the United States. American Journal of Public Health 2015;105(2):324‐328. - PMC - PubMed
References to studies excluded from this review
-
- Fein DJ. Will welfare reform influence marriage and fertility? Early evidence from the ABC demonstration. Evaluation and Program Planning 2001;24(4):427‐44.
- Fein DJ, Lee Wang S. The ABC Evaluation. Impacts of Welfare Reform on Child Maltreatment. Cambridge, MA: Abt Associates Inc., 2000.
- Fein DJ, Lee Wang S. The impacts of welfare reform on child maltreatment in Delaware. Children and Youth Services Review 2003;25(1‐2):83‐111.
- Fein DJ, Long D, Behrens JM, Lee Wang S. Turning the Corner: Delaware's A Better Chance Welfare Reform Program at Four Years. Cambridge, MA: Abt Associates Inc., 2001.
- Fein DJ, Wang SL, Schoenfiend EC. The ABC Evaluation: Do Welfare Recipients' Children Have a School Attendance Problem?. Cambridge, MA: Abt Associates Inc., 1999.
-
- Lacroix Guy, Brouillette Dany. Assessing the impact of a wage subsidy for single parents on social assistance. Canadian Journal of Economics 2011;44(4):1195‐221.
-
- Kornfeld R, Porcari D, Peck LR. The Arizona Works Pilot Program: A Three‐year Assessment. Cambridge, MA: ABT Associates Inc., 2003.
-
- Bembry JX. Strengthening fragile families through research and practice. Journal of Family Social Work 2011;14(1):54‐67.
-
- Richburg‐Hayes L, Anzelone C, Dechausay N, Datta S, Fiorillo A, Potok L, et al. Behavioral economics and social policy: designing innovative solutions for programs supported by the administration for children and families. OPRE Report No. 2014‐16a. Washington, DC: US Department of Health and Human Services2014.
Additional references
-
- Alderson P, Green S. Cochrane Collaboration open learning material for reviewers Version 1.1. [no longer available online]: Cochrane Collaboration, 2009.
-
- Armstrong R, Waters E, Doyle J (editors). Chapter 21: Reviews in health promotion and public health. In Higgins JPT, Green S (editors). Cochrane Handbook for Systematic Reviews of Interventions Version 5.1.0 (updated March 2011). The Cochrane Collaboration, 2011. Available from www.handbook.cochrane.org..
-
- Benzeval M. The self‐reported health status of lone parents. Social Science & Medicine 1998;46(10):1337‐53. - PubMed
Publication types
MeSH terms
Grants and funding
LinkOut - more resources
Full Text Sources
Other Literature Sources
Medical
Miscellaneous

