. 2017 Aug 24;170(5):1000-1012.e19.
doi: 10.1016/j.cell.2017.07.013. Epub 2017 Aug 17.

Distinct Neural Circuits for the Formation and Retrieval of Episodic Memories

Affiliations

Distinct Neural Circuits for the Formation and Retrieval of Episodic Memories

Dheeraj S Roy et al. Cell. .

Abstract

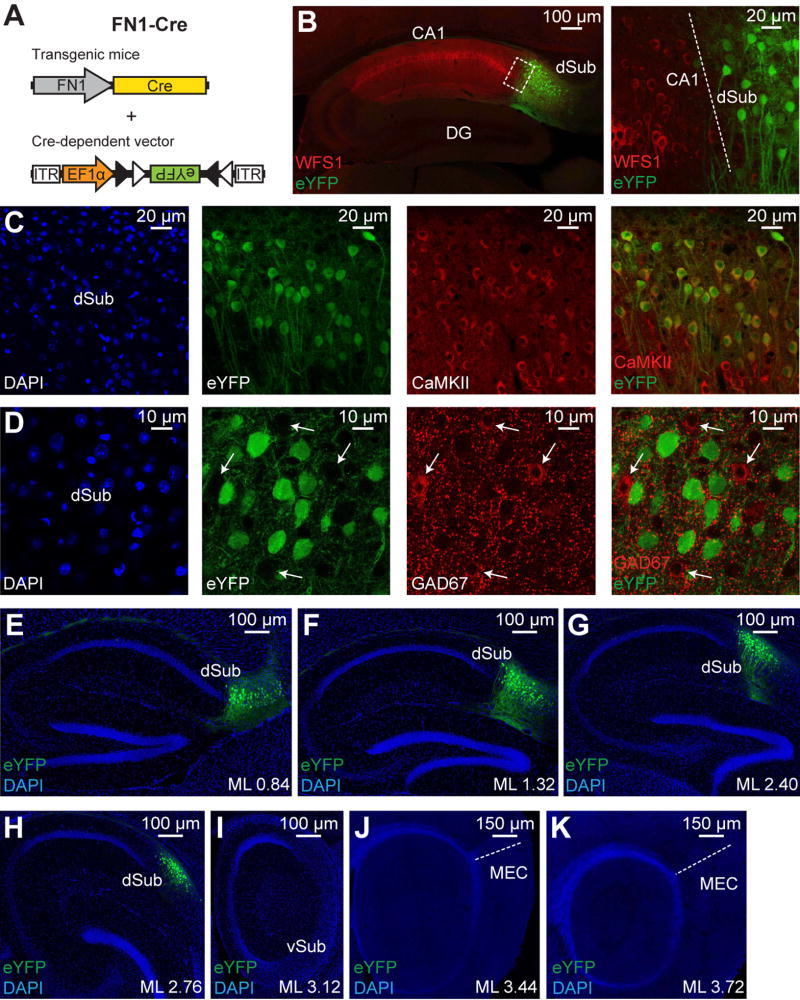
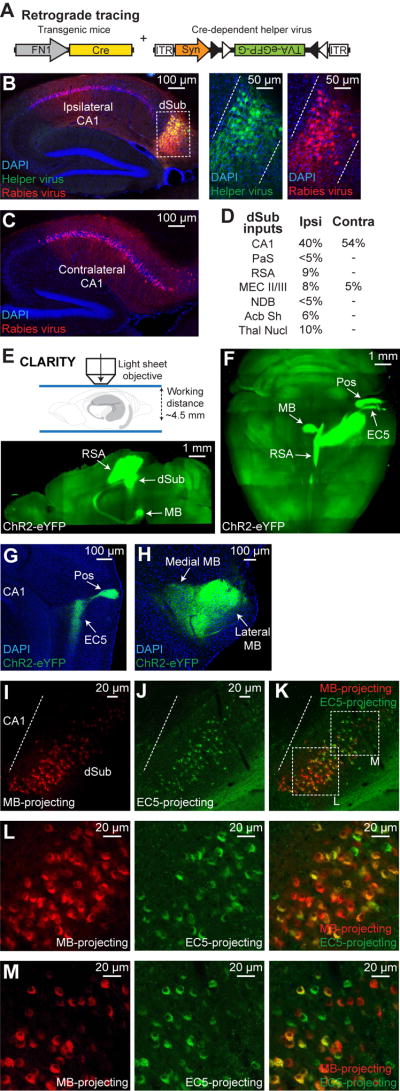
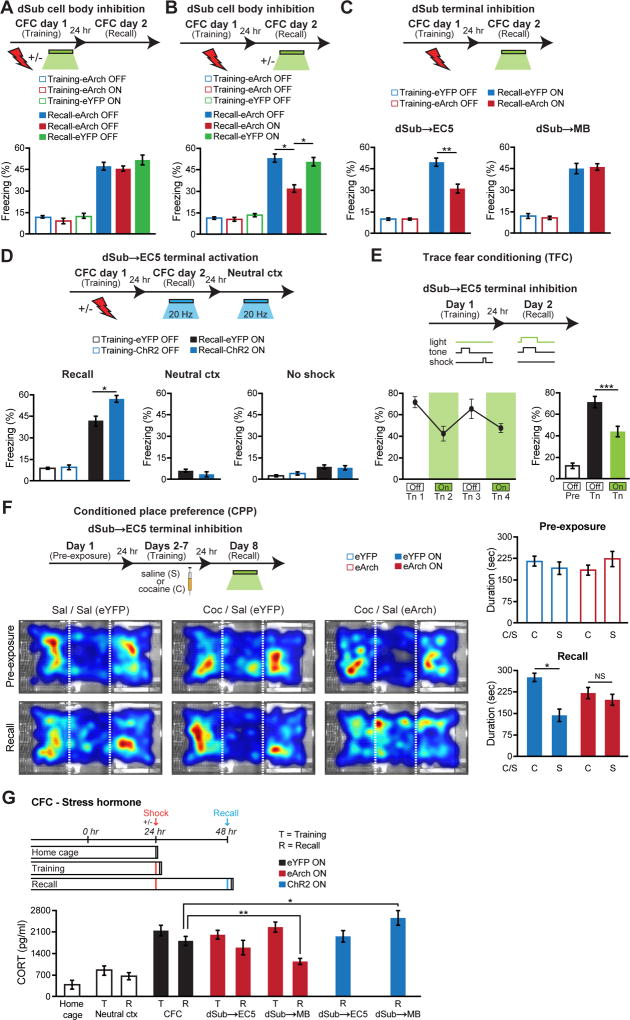
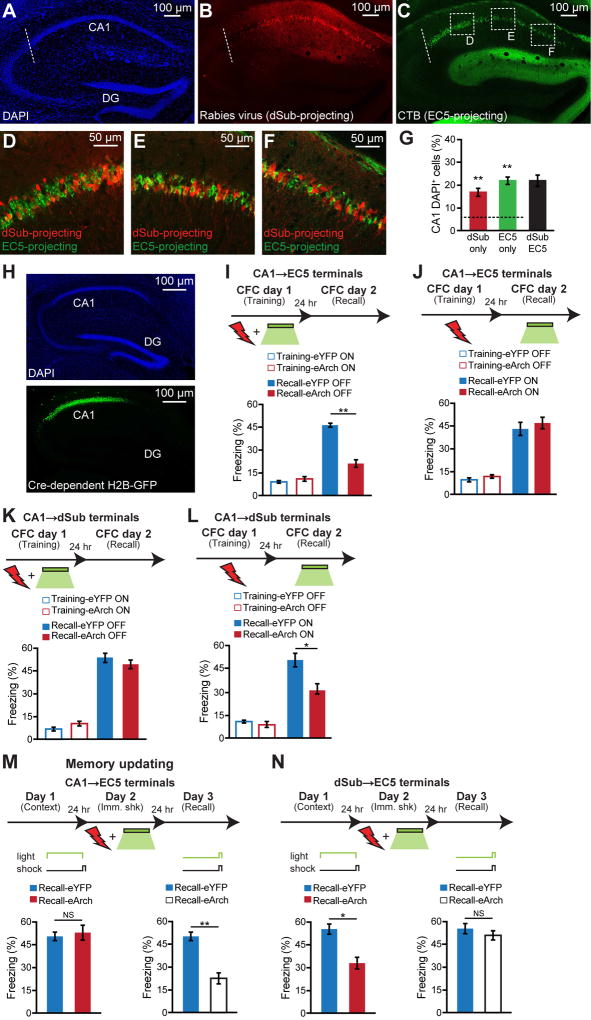
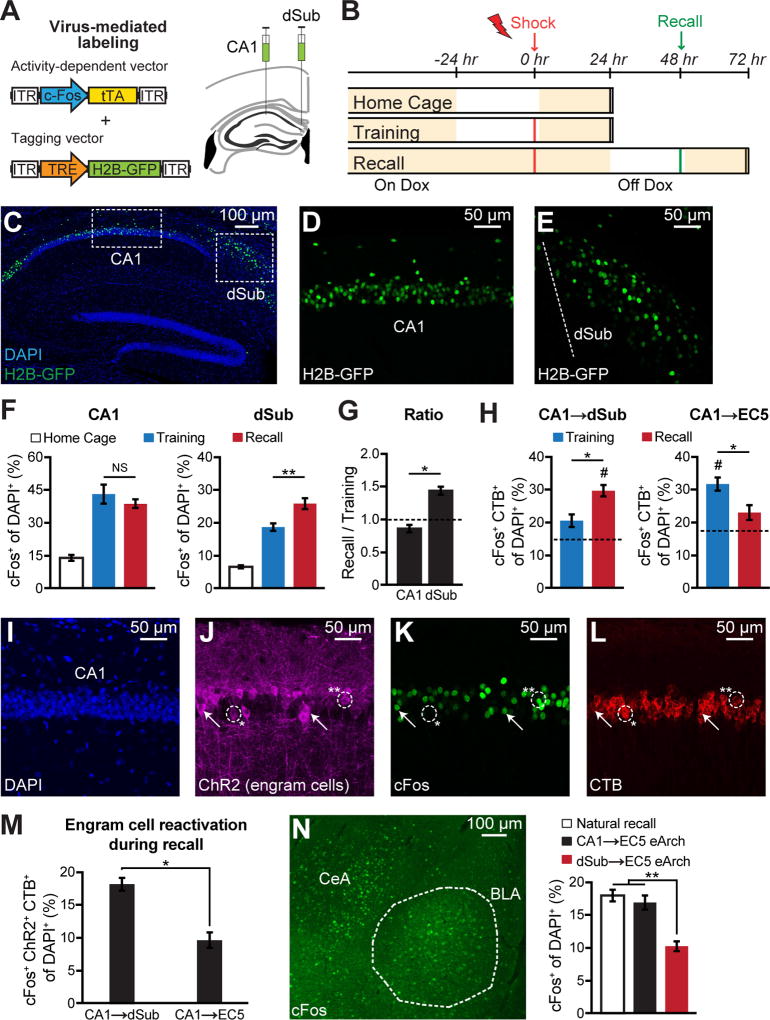
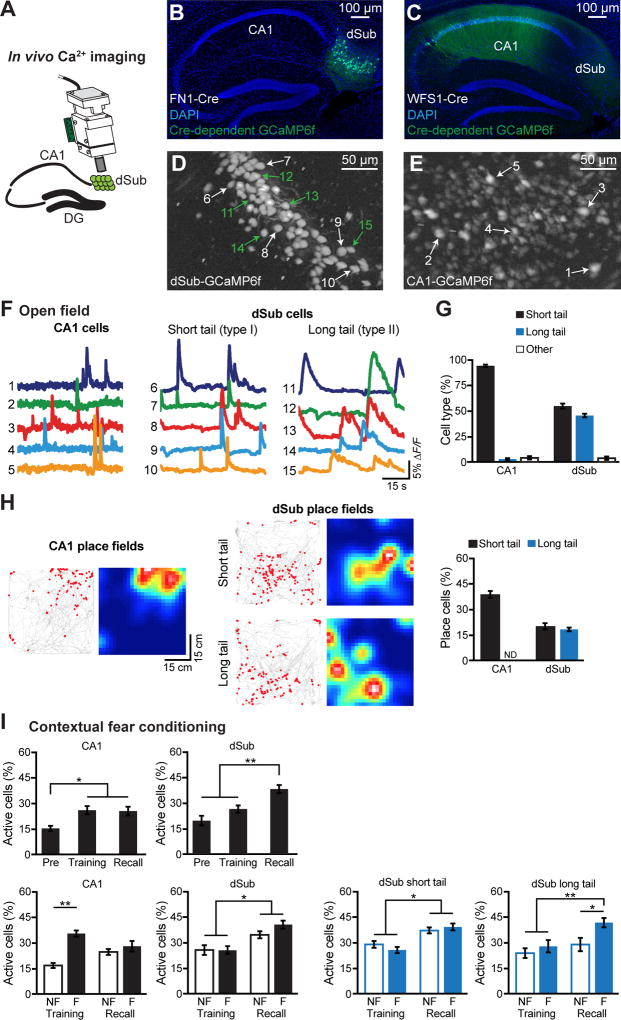
The formation and retrieval of a memory is thought to be accomplished by activation and reactivation, respectively, of the memory-holding cells (engram cells) by a common set of neural circuits, but this hypothesis has not been established. The medial temporal-lobe system is essential for the formation and retrieval of episodic memory for which individual hippocampal subfields and entorhinal cortex layers contribute by carrying out specific functions. One subfield whose function is poorly known is the subiculum. Here, we show that dorsal subiculum and the circuit, CA1 to dorsal subiculum to medial entorhinal cortex layer 5, play a crucial role selectively in the retrieval of episodic memories. Conversely, the direct CA1 to medial entorhinal cortex layer 5 circuit is essential specifically for memory formation. Our data suggest that the subiculum-containing detour loop is dedicated to meet the requirements associated with recall such as rapid memory updating and retrieval-driven instinctive fear responses.

Keywords: Subiculum; entorhinal cortex; episodic memory; hippocampus; mammillary bodies; memory formation; memory retrieval; memory updating; neural circuits; stress hormone.


Figures

Figure 1
Figure 1. Genetic targeting of dSub neurons using FN1-Cre mice
(A) FN1-Cre mice were injected with a Cre-dependent virus expressing eYFP into dSub. (B) Cre+ dSub neurons (eYFP, green) do not overlap with dCA1 excitatory neurons (labeled with WFS1, red). Sagittal image (left), higher magnification image of boxed region (right). Dashed white line denotes CA1/dSub border (right). (C, D) Cre+ dSub neurons (eYFP, green), in sagittal sections, express the excitatory neuronal marker CaMKII (red; C). Over 85% of all CaMKII+ neurons in the dSub region also expressed eYFP (n = 3 mice). Images are taken with a 20× objective. Cre+ dSub neurons do not express the inhibitory marker GAD67 (red; D). White arrows indicate GAD67+ cell bodies (D). Images are taken with a 40× objective. See also Figure S1A. DAPI staining in blue. (E–K) Medial to lateral (ML, in millimeters relative to Bregma) sagittal sections show that eYFP signal is restricted to dSub neurons. DAPI staining (blue). No eYFP signal was observed in ventral subiculum (vSub) or medial entorhinal cortex (MEC). Dashed white line denotes perirhinal cortex/MEC border (J, K).
Figure 2
Figure 2. Input-output organization of dSub excitatory neurons
(A) Monosynaptic retrograde tracing of dSub inputs used a Cre-dependent helper virus (tagged with eGFP) combined with a rabies virus (RV, mCherry) injected into dSub of FN1-Cre mice. Avian leukosis and sarcoma virus subgroup A receptor (TVA) and rabies glycoprotein (G). (B, C) Representative ipsilateral sections confirmed efficient overlap of helper and RV-infected dSub neurons. Sagittal image (left; B), higher magnification images of boxed region (right; B). Quantification revealed that 78% of dSub cells, relative to DAPI+ neurons, were RV-positive (n = 4 mice), which is the starting population for retrograde tracing. Dashed white lines denote dSub Cre+ neuron target region. Both ipsilateral and contralateral sagittal sections revealed that dorsal CA1 provides the major input to dSub Cre+ neurons (C). (D) Inputs to dSub Cre+ neurons were quantified based on percentage of neurons in the target brain region relative to DAPI+ neurons (n = 4 mice). Ipsilateral (Ipsi) and contralateral (Contra) counts. Parasubiculum (PaS), retrosplenial agranular cortex (RSA), MEC layers II/III (MEC II/III), nucleus of the diagonal band (NDB), nucleus accumbens shell (Acb Sh), and thalamic nuclei (Thal Nucl). (E) FN1-Cre mice expressing ChR2-eYFP (Cre-dependent virus) in dSub neurons were used for CLARITY followed by light sheet microscopy (top). 2.5 mm optical section in sagittal view shows projections to RSA and mammillary bodies (MB, bottom). (F) Whole-brain, stitched z-stack (horizontal view) shows all major projections from dSub Cre+ neurons including RSA, MB, EC5, and postrhinal cortex (Pos). (G, H) Standard sagittal brain sections of FN1-Cre mice expressing ChR2-eYFP (Cre-dependent virus) in dSub neurons showing dSub projections to EC5 and Pos (G), as well as medial and lateral MB (H). (I–M) Representative standard sagittal brain sections showing dSub neuronal populations projecting to MB (red, CTB555; I) or EC5 (green, CTB488; J). The respective CTB was injected into MB or EC5. Overlap image (K). Quantification, including weakly labeled CTB+ neurons, revealed that 81% of dSub cells were double positive (n = 4 mice). Scale bar in panels I–J applies to panel K. Dashed white line denotes CA1/dSub border. Higher magnification images of boxed regions indicated in Figure 2K (L–M).
Figure 3
Figure 3. Differential roles of dSub projections in hippocampal memory retrieval and retrieval-induced stress hormone responses
(A, B) FN1-Cre mice were injected with a Cre-dependent virus expressing eArch3.0-eYFP into dSub. Optogenetic inhibition of dSub neurons during contextual fear conditioning (CFC) training had no effect on long-term memory (n = 12 mice per group; A). Inhibition of dSub neurons during CFC recall impaired behavioral performance (n = 12 mice per group; B). A two-way ANOVA followed by Bonferroni post-hoc tests revealed a behavioral epoch-by-eArch interaction and significant eArch-mediated attenuation of freezing (A–B: F1,44 = 5.70, P < 0.05, recall). For dSub optogenetic manipulation experiments, injections were targeted to dSub cell bodies and the extent of virus expression is shown in Figures 1E–1K. (C) Terminal inhibition of dSub projections to EC5 (bottom left), but not MB (bottom right), disrupted CFC memory recall (n = 11 mice per group). A two-way ANOVA followed by Bonferroni post-hoc tests revealed a dSub terminal-by-eArch interaction and significant eArch-mediated attenuation of freezing (F1,40 = 7.63, P < 0.01, dSub→EC5 terminals). (D) FN1-Cre mice were injected with a Cre-dependent virus expressing ChR2-eYFP into dSub. Optogenetic activation of dSub→EC5 terminals during CFC memory recall increased freezing levels (left), which was not observed in a neutral context (middle) or using no shock mice (right, n = 10 mice per group). (E) Inhibition of dSub→EC5 terminals during trace fear conditioning (TFC) recall decreased tone (Tn)-induced freezing levels (n = 12 mice). A two-way ANOVA followed by Bonferroni post-hoc tests revealed a behavioral epoch-by-eArch interaction and significant eArch-mediated attenuation of freezing (E and Figure S4A: F1,44 = 7.11, P < 0.05, recall). Pre-tone baseline freezing (Pre). Recall-induced freezing levels during individual tone presentations (left panel), averaged freezing levels during the two light-off tones and the two light-on tones (right panel). (F) Inhibition of dSub→EC5 terminals during cocaine-induced conditioned place preference (CPP) recall impaired behavioral performance (n = 14 mice per group). Behavioral schedule (left, top part). Average heat maps showing exploration time during pre-exposure and recall trials (left, bottom part). Dashed white lines demarcate individual zones in the CPP apparatus. Pre-exposure preference duration (right, top graph) and recall preference duration (right, bottom graph). Saline (S or Sal), cocaine (C or Coc). A two-way ANOVA followed by Bonferroni post-hoc tests revealed a drug group-by-eArch interaction and significant eArch-mediated attenuation of preference duration (F1,52 = 5.16, P < 0.05, cocaine). For CPP training inhibition, see Figure S4F. NS, not significant. (G) Stress hormone: Terminal inhibition of dSub projections to MB, but not EC5, following CFC memory recall tests decreased stress responses as measured by corticosterone (CORT) levels. Optogenetic activation of dSub→MB terminals following CFC memory recall increased CORT levels (n = 10 mice per group). Context (ctx). CORT levels in CPP paradigm are shown in Figure S4H. Unless specified, statistical comparisons are performed using unpaired t tests; *P < 0.05, **P < 0.01, ***P < 0.001. Data are presented as mean ± SEM.
Figure 4
Figure 4. Projection from CA1 to EC5 is crucial for encoding, but not for retrieval, of hippocampal memories
(A–C) Retrograde monosynaptic identification of dCA1 neurons projecting to dSub (in FN1-Cre mice) using a Cre-dependent helper virus combined with a rabies virus (RV). The extent of RV-positive dSub cells, which is the starting population for retrograde tracing, is shown in Figure 2B. Simultaneous retrograde monosynaptic identification of dCA1 neurons projecting to EC5 using CTB. DAPI (blue; A), RV-mCherry (red; B), CTB488 (green; C). Representative sagittal sections, dashed white line denotes CA1/CA2 border. (D–F) Higher magnification images of boxed regions indicated in Figure 4C. (G) Percentage of dCA1 neurons labeled with mCherry (dSub only), CTB488 (EC5 only), or mCherry and CTB double positive (dSub+EC5, n = 4 mice). Dashed line indicates chance level (6%), calculated from a control experiment (Figures S5A–S5H, and see Methods). One-sample t tests against chance level were performed. (H) Representative sagittal sections of hippocampus from TRPC4-Cre mice showing dCA1 neurons labeled with a Cre-dependent histone H2B-GFP virus (green, bottom) and stained with DAPI (blue, top). (I, J) TRPC4-Cre mice were injected with a Cre-dependent virus expressing eArch3.0-eYFP into dCA1. Terminal inhibition of CA1→EC5 during CFC training impaired long-term memory (n = 10 mice per group; I). Inhibition of CA1→EC5 terminals during CFC recall had no effect on behavioral performance (n = 10 mice per group; J). A two-way ANOVA followed by Bonferroni post-hoc tests revealed a behavioral epoch-by-eArch interaction and significant eArch-mediated attenuation of freezing (I–J: F1,36 = 9.19, P < 0.01, training). (K, L) Terminal inhibition of CA1→dSub during CFC training had no effect on long-term memory (n = 13 mice per group; K). Inhibition of CA1→dSub terminals during CFC recall disrupted behavioral performance (n = 13 mice per group; L). A two-way ANOVA followed by Bonferroni post-hoc tests revealed a behavioral epoch-by-eArch interaction and significant eArch-mediated attenuation of freezing (K–L: F1,48 = 5.16, P < 0.05, recall). (M, N) Memory updating. Experimental schedule (top) for pre-exposure mediated contextual fear conditioning (PECFC) with optogenetic terminal inhibition of CA1→EC5 (using TRPC4-Cre mice; M) and dSub→EC5 (using FN1-Cre mice; N) during the pre-footshock period (left panels) or footshock period alone (right panels) on Day 2. Freezing levels during recall tests (Day 3) to the conditioned context (bottom). eYFP and eArch conditions (n = 12 mice per group). NS, not significant. Immediate shock (Imm. shk). A two-way ANOVA followed by Bonferroni post-hoc tests revealed a behavioral epoch-by-eArch interaction and significant eArch-mediated attenuation of freezing (M: F1,44 = 9.81, P < 0.01, recall in right panel; N: F1,44 = 4.75, P < 0.05, recall in left panel). Unless specified, statistical comparisons are performed using unpaired t tests; *P < 0.05, **P < 0.01. Data are presented as mean ± SEM.
Figure 5
Figure 5. Distinct cFos activation patterns in CA1 and dSub neurons
(A) Virus-mediated cFos+ neuronal labeling strategy using a cocktail of c-Fos-tTA and TRE-H2B-GFP (left). Wild-type mice raised on doxycycline (DOX) food were injected with the two viruses bilaterally into CA1 and dSub (right). (B) Behavioral schedule and H2B-GFP labeling (see Methods). Beige shading indicates animals are maintained on DOX food. (C–E) Representative sagittal section of hippocampus showing H2B-GFP-labeled cell bodies (green) in CA1 and dSub counterstained with DAPI (blue), following CFC training (C). Boxed regions in C are shown in higher magnification for CA1 (D) and dSub (E). Dashed white line denotes CA1/dSub border (E). (F) H2B-GFP+ (cFos+) cell counts in CA1 (left) and dSub (right) from home cage, CFC training (encoding), and CFC recall groups (n = 6 mice per group). NS, not significant. (G) Ratio of recall to training H2B-GFP+ neurons in CA1 and dSub (cell counts from Figure 5F). A ratio of 1.0 indicates comparable H2B-GFP+ counts during training and recall epochs. Statistical comparison used a Fisher’s exact test. (H) Overlap between CFC-induced cFos and CA1 neurons projecting (labeled by CTB555) to dSub (left) or EC5 (right). Representative overlap images are shown in Figures S5K–S5N. Dashed lines indicate chance levels (n = 5 mice per group, see Methods). One-sample t tests against chance level were performed (#P < 0.05). (I–M) Wild-type mice raised on DOX were used for these experiments. Representative coronal section of CA1 showing DAPI staining (I), CFC training-induced cFos-positive engram cells labeled with a cocktail of c-Fos-tTA and TRE-ChR2-eYFP (J), cFos antibody staining following CFC recall tests performed one day after training and engram labeling (K), and CA1 neurons projecting to either dSub or EC5 visualized by retrograde CTB555 labeling (L). The circled region with a single asterisk (*) shows an engram cell that is cFos but CTB555+ and the region with two asterisks (**) shows an engram cell that is cFos+ and CTB555+. White arrows show additional examples of CA1 engram cells that are both cFos+ and CTB555+. Overlap of recall-induced cFos, CA1 engram cells labeled during training, and circuit specific CA1 projection neurons (n = 6 mice per group; M). (N) Representative coronal section of basolateral amygdala (BLA) showing cFos activation following memory recall (left). cFos+ cell counts (n = 6 mice per group) in BLA following natural recall, and recall with eArch inhibition of the CA1→EC5 or dSub→EC5 circuits (right). TRPC4-Cre mice were used for CA1 circuit manipulations and FN1-Cre mice were used for dSub circuit manipulations. Unless specified, statistical comparisons are performed using unpaired t tests; *P < 0.05, **P < 0.01. Data are presented as mean ± SEM.
Figure 6
Figure 6. dSub neurons exhibit enhanced neuronal activity during hippocampal memory retrieval
(A–C) Implantation of a microendoscope right above dSub of FN1-Cre mice (A) or dCA1 of WFS1-Cre mice. For dCA1, the medial region along the proximodistal axis was targeted (see also Figures S6A–S6B). Calcium (Ca2+). Representative sagittal sections of hippocampus from FN1-Cre (B) and WFS1-Cre (C) mice showing GCaMP6f-labeled cells (green) and DAPI staining (blue). (D, E) Representative maximum intensity projection images, as seen through the microendoscope camera, of dSub neurons expressing GCaMP6f (D) or CA1 neurons expressing GCaMP6f (E) acquired during a 30 min recording session in an open field arena (see Methods). (F, G) Representative Ca2+ traces of CA1 cells (left, labeled in E) and two types of dSub cells (middle and right, labeled in D) from the open field paradigm (F), and cell type quantification (n = 759 CA1 cells, n = 428 dSub short tail cells, n = 371 dSub long tail cells, n = 4 mice per group; G). See also Figure S6G. (H) Representative place field Ca2+ events (red dots, left panels) and heat maps (right panels) for CA1 and dSub cells (cell counts in Figure 6G), along with quantification. See also Figure S6H and Methods. ND, not detected. (I) Ca2+ activity during CFC. Pre-footshock levels (Pre). Percentage of active cells (see Methods) during Pre, training, and recall tests (top), including non-freezing (NF) and freezing (F) epochs (bottom), in CA1 and dSub (n = 550 CA1 cells, n = 429 dSub short tail cells, n = 203 dSub long tail cells, n = 3 CA1 mice, n = 4 dSub mice). Within session NF and F comparisons used paired t tests. Comparisons across sessions used a two-way ANOVA with repeated measures followed by Bonferroni post-hoc tests. See also Figures S6I–S6K. For statistical comparisons, *P < 0.05, **P < 0.01. Data are presented as mean ± SEM.

Comment in

References

    1. Bourque CW, Oliet SH, Kirkpatrick K, Richard D, Fisher TE. Extrinsic and intrinsic modulatory mechanisms involved in regulating the electrical activity of supraoptic neurons. Ann. N. Y. Acad. Sci. 1993;689:512–519. - PubMed
    1. Chung K, Wallace J, Kim SY, Kalyanasundaram S, Andalman AS, Davidson TJ, Mirzabekov JJ, Zalocusky KA, Mattis J, Denisin AK, et al. Structural and molecular interrogation of intact biological systems. Nature. 2013;497:332–337. - PMC - PubMed
    1. Deng W, Aimone JB, Gage FH. New neurons and new memories: how does adult hippocampal neurogenesis affect learning and memory? Nat. Rev. Neurosci. 2010;11:339–350. - PMC - PubMed
    1. Ding SL. Comparative anatomy of the prosubiculum, subiculum, presubiculum, postsubiculum, and parasubiculum in human, monkey, and rodent. J. Comp. Neurol. 2013;521:4145–4162. - PubMed
    1. Eichenbaum E, Yonelinas AP, Ranganath C. The medial temporal lobe and recognition memory. Annu. Rev. Neurosci. 2007;30:123–152. - PMC - PubMed

LinkOut - more resources