. 2017 Aug 30;95(5):1074-1088.e7.
doi: 10.1016/j.neuron.2017.07.038. Epub 2017 Aug 17.

Neuronal Depolarization Drives Increased Dopamine Synaptic Vesicle Loading via VGLUT

Affiliations

Neuronal Depolarization Drives Increased Dopamine Synaptic Vesicle Loading via VGLUT

Jenny I Aguilar et al. Neuron. .

Abstract

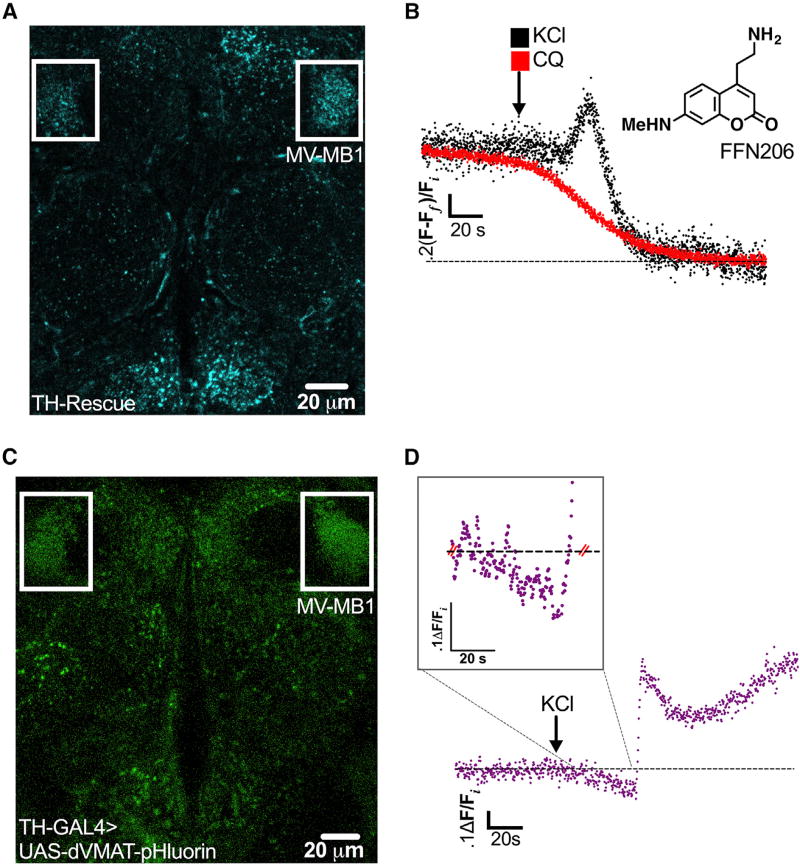
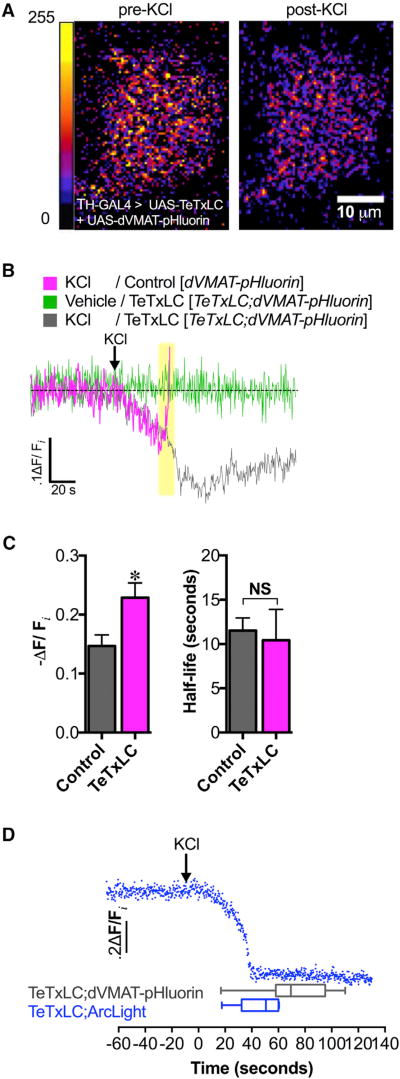
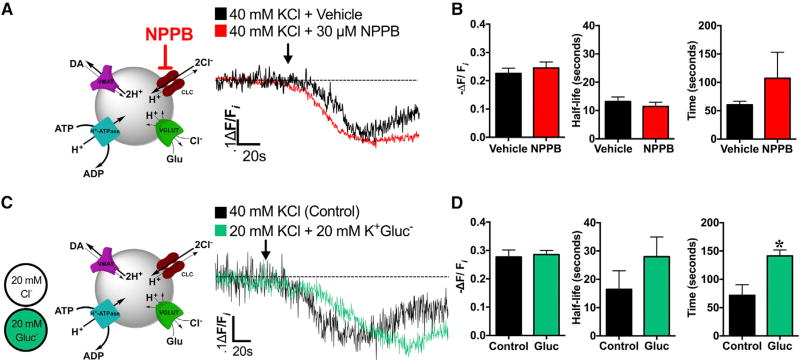
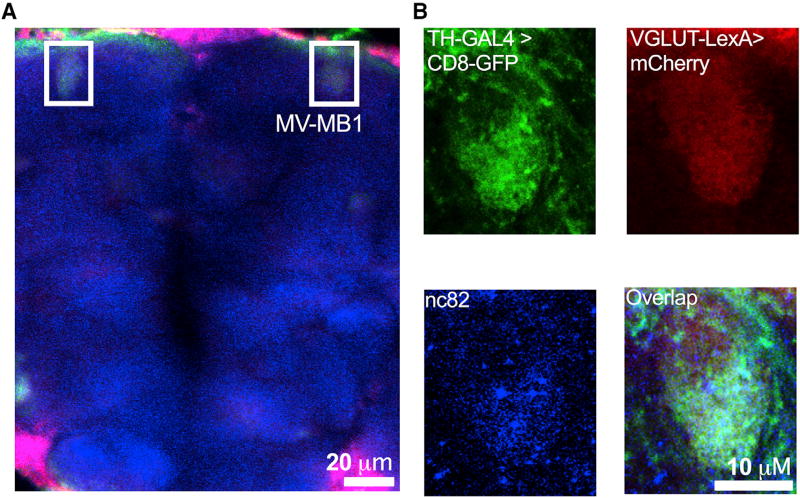
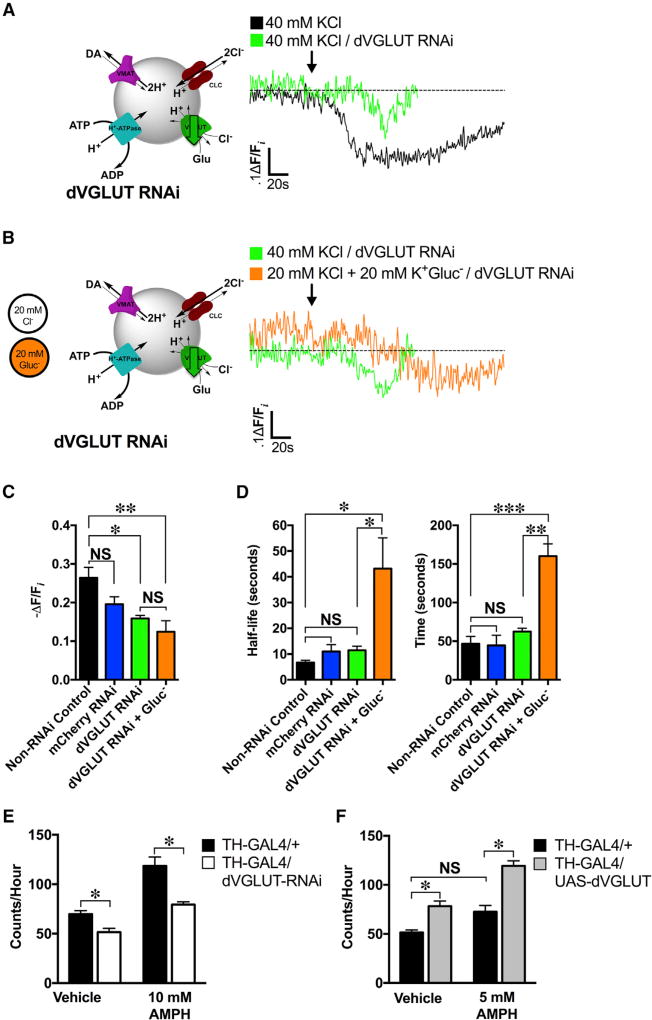
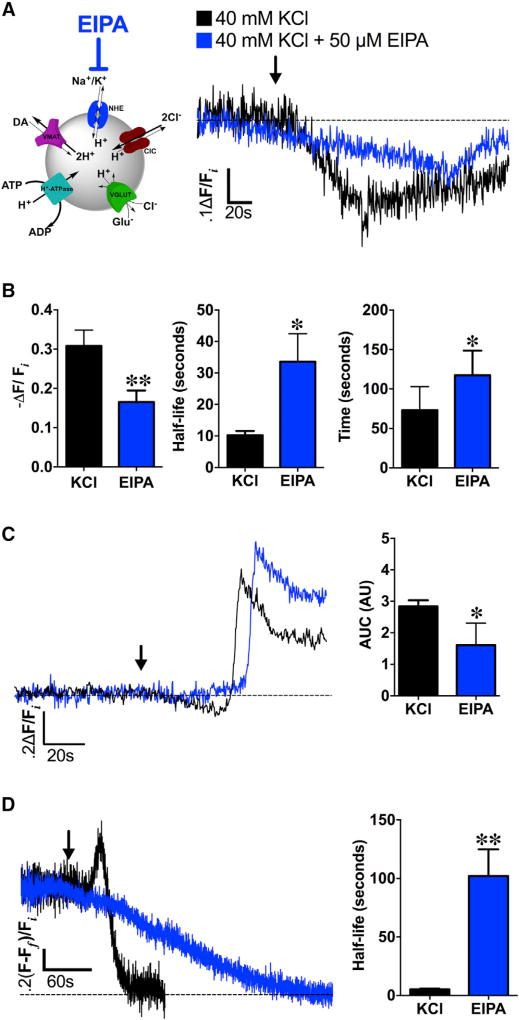
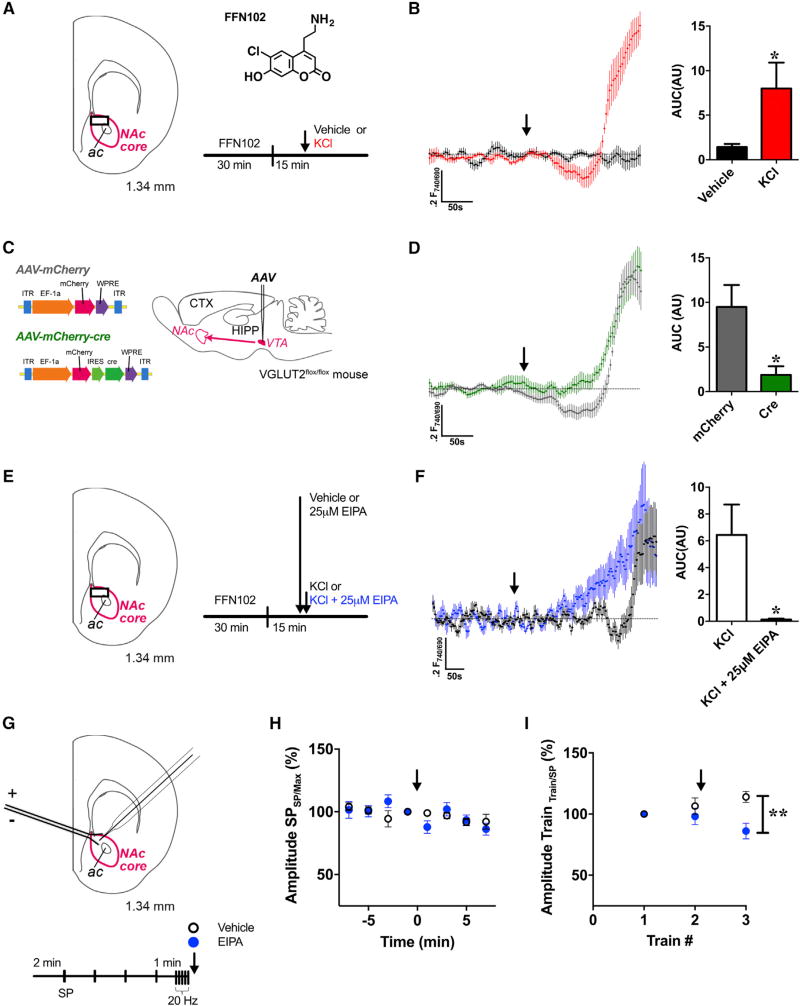
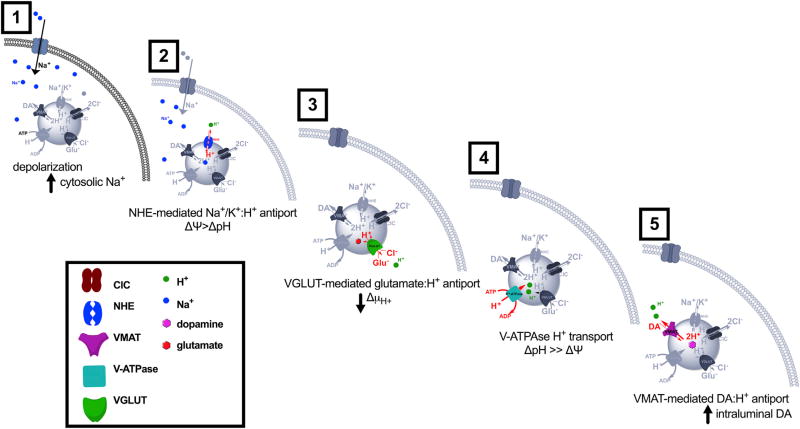
The ability of presynaptic dopamine terminals to tune neurotransmitter release to meet the demands of neuronal activity is critical to neurotransmission. Although vesicle content has been assumed to be static, in vitro data increasingly suggest that cell activity modulates vesicle content. Here, we use a coordinated genetic, pharmacological, and imaging approach in Drosophila to study the presynaptic machinery responsible for these vesicular processes in vivo. We show that cell depolarization increases synaptic vesicle dopamine content prior to release via vesicular hyperacidification. This depolarization-induced hyperacidification is mediated by the vesicular glutamate transporter (VGLUT). Remarkably, both depolarization-induced dopamine vesicle hyperacidification and its dependence on VGLUT2 are seen in ventral midbrain dopamine neurons in the mouse. Together, these data suggest that in response to depolarization, dopamine vesicles utilize a cascade of vesicular transporters to dynamically increase the vesicular pH gradient, thereby increasing dopamine vesicle content.

Keywords: VGLUT2; depolarization; dopamine; glutamate; neurotransmission; pH; presynaptic; synaptic vesicle; vesicle content.


Figures

Figure 1
Figure 1. Depolarization-Induced Increase in Vesicular Acidification Is Simultaneous with Increase in SV Filling in DA Terminals
(A) Presynaptic DA nerve terminals were labeled with FFN206 (300 nM, shown as a free base) in adult TH Rescue brains and subsequently treated with either KCl or CQ. The representative single-plane image highlights the MB-MV1 region (boxed in white; 25 µm scale bar; false color). (B) An average of fluorescent imaging traces demonstrated a 21.5% ±3.4% increase in FFN206 vesicle filling prior to 40 mM KCl-induced destaining, best fit to a monoexponential decay (black trace, n = 4 flies). Weak base CQ (red trace, 100 µM) also caused FFN206 destaining, best fit to a monoexponential decay (t1/2 = 25.2 ± 2.6 s, n = 4), but with no additional vesicle filling prior to content release. (C) dVMAT-pHluorin, a reporter of SV intraluminal pH, was expressed in DA neurons in a wild-type (WT) background (20 µm scale bar; false color). The representative single-plane image highlights MB-MV1 (boxed in white). (D) Representative trace of dVMAT-pHluorin fluorescence measuring vesicular pH over time in response to KCl treatment (40 mM; arrow indicates treatment onset). KCl treatment induced a 14.7% ± 1.9% (n = 6) decrease in dVMAT-pHluorin fluorescence relative to the pre-KCl baseline, indicating a net increase in vesicle acidification. The trace displays changes in single-plane fluorescence intensity measured in ~250 ms intervals, corrected for background fluorescence, and normalized to initial values (Fi). Inset demonstrates a zoomed-in view of the period of KCl-induced vesicle acidification. All traces were recorded from the MB-MV1 region. Fly strains: WT background (TH-GAL4, UAS-dVMAT-pHluorin); TH Rescue (dVMATP1; TH-GAL4, UAS-dVMAT). See also Figure S1.
Figure 2
Figure 2. Depolarization-Induced Increase in Vesicular Acidification Is Independent of Exocytosis
(A) High K+ stimulation (40 mM KCl) caused increased SV acidification in DA nerve terminals as indicated by the decrease in dVMAT-pHluorin fluorescence (right) compared to pre-treatment (left) (10 µm scale bar; false color, arbitrary fluorescence intensity units). We show a representative single-plane image of DA nerve terminals in the MV-MB1 region in adult fly brains selectively expressing dVMAT-pHluorin and TeTxLC. (B) Averaged dVMAT-pHluorin fluorescence traces measuring depolarization-induced changes in vesicular pH in TeTxLC-expressing DA terminals (gray trace) versus control DA terminals that do not express TeTxLC (magenta trace). DA terminal-selective expression of TeTxLC eliminated the rapid dVMAT-pHluorin brightening associated with vesicle exocytosis in response to KCl (highlighted in yellow); vehicle treatment did not cause fluorescence changes (green trace). (C) Expression of TeTxLC in DA terminals significantly enhanced SV acidification during KCl-induced stimulation relative to the pre-stimulation baseline (22.9% ± 2.5% decrease in dVMAT-pHluorin fluorescence, n=3 flies; gray bar) compared to controls where TeTxLC was not expressed (14.7% ± 1.9% decrease, n = 6; magenta bar) (p=0.037). TeTxLC expression did not affect the half-life to reach maximal acidification (t1/2 = 10.4 ± 3.5 s, n = 3) compared to the non-TeTxLC control (t1/2 = 11.5 ± 1.4 s, n = 6; p > 0.05). (D) Optical recording of membrane depolarization of DA nerve terminals selectively co-expressing TeTxLC and ArcLight (top; blue trace). KCl treatment (indicated by arrow) decreased ArcLight fluorescence, indicating membrane depolarization. KCl-induced membrane depolarization (46.1 ± 6.7 s, n = 6) preceded exocytosis-independent vesicular acidification (71.9 ± 5.9 s, n = 17; p = 0.03). Error bars, SEM. Unpaired t tests were conducted for all analyses in (C) and (D). Fly strains: Control (TH-GAL4, UAS-dVMAT-pHluorin); TeTxLC background (UAS-TeTxLC; TH-GAL4, UAS-dVMAT-pHluorin); TeTxLC/Arc-Light (UAS-TeTxLC; UAS-ArcLight/TH-GAL4).
Figure 3
Figure 3. Depolarization-Induced Increases in SV Acidification Occur Independently of Acute Chloride Channel Inhibition or Diminished Extracellular Cl
(A) Left: schematic illustrating ClC blockade by NPPB during high K+ stimulation (40 mM KCl). Right: averaged dVMAT-pHluorin fluorescence traces measuring SV pH during high K+ stimulation in brains acutely pre-treated with ClC blocker, NPPB (30 µM, 25°C, 15 min; red trace, n = 6 flies) compared to KCl stimulation alone (black trace, n = 3). (B) NPPB pre-treatment (30 µM, 15 min, n = 6) did not significantly alter the time to reach maximal SV acidification (t = 107.3 ± 46.0 s), kinetics (t1/2 = 11.4 ± 1.5 s), or magnitude of acidification during KCl stimulation (−ΔF/Fi = 24.5% ± 2.1%) compared to the non-NPPB pretreated control (t = 60.5 ± 6.0 s; t1/2 = 13.2 ± 1.6 s; −ΔF/Fi = 22.6% ± 1.8%, n = 3; p > 0.05). (C) Left: schematic illustrating isosmotic substitution of extracellular Cl with gluconate (GluCl) during high K+ stimulation (40 mM KCl). Right: averaged dVMAT-pHluorin fluorescence traces during stimulation under low Cl (20 mM Cl, n = 5; green trace) or control conditions (40 mM Cl, n = 3; black trace). (D) Stimulation under low Cl (n = 5) did not significantly affect the kinetics (t1/2 = 28.0 ± 6.0 s) or magnitude of depolarization-induced increases in DA vesicular acidification (−ΔF/Fi = 28.6% ± 1.5%) compared to control conditions (n = 3; t1/2 = 16.4 ± 6.6 s, −ΔF/Fi = 27.7% ±2.4%; p > 0.05). Low Cl significantly delayed absolute time to maximal acidification (t = 141.4 ± 10.6 s) compared to control conditions (t = 71.7 ± 18.7 s; p = 0.01). An ~60 s baseline was recorded prior to KCl application (indicated by arrow). Error bars, SEM. Unpaired t tests were conducted for all analyses in (B) and (D). Fly strains: TeTxLC background (UAS-TeTxLC; TH-GAL4, UAS-dVMAT-pHluorin).
Figure 4
Figure 4. dVGLUT Localizes to Subpopulations of DA Nerve Terminals
Fluorescent tags were co-expressed by dVGLUT-LexA (mCherry) and TH-GAL4 (mCD8::GFP) enhancer-driven expression drivers in WT back-ground. (A) Representative image from a projected z series highlights co-localization of dVGLUT- and TH-promoter driven fluorescent tags in the DA terminal-rich MB-MV1 region (boxed in white; 20 µm scale bar; false color). (B) Single-channel images zoomed in on MV-MB1 show TH-GAL4-driven mCD8::GFP (top left; green), VGLUT-LexA-driven mCherry (top right; red), and nc82 (labeling synaptic active zone marker Bruchpilot; bottom left; blue). Merged image (bottom right) shows co-localization of these fluorescent tags and nc82 labeling in DA terminal active zones. Fly strain: VGLUT-LexA/LexAOP-6x mCherry;TH-GAL4/UAS-mCD8::GFP. Data are representative of n > 3 experiments. See also Figures S2 and S3.
Figure 5
Figure 5. VGLUT Mediates Depolarization-Induced SV Hyperacidification in DA Nerve Terminals and DA-Mediated Behavior
(A) Left: a schematic illustrating high K+ stimulation (40 mM KCl) with concomitant dVGLUT RNAi knockdown. Right: representative dVMAT-pHluorin fluorescence traces showed decreased KCl-induced hyperacidification in the dVGLUT RNAi background (n = 3 flies; green trace) compared to the non-RNAi control (n = 4; black trace). (B) Left: a schematic illustrating DA neuron stimulation (40 mM K+) under low Cl conditions by isosmotic gluconate (GluCl) substitution with concomitant dVGLUT RNAi knockdown. Right: representative dVMAT-pHluorin fluorescence traces comparing effects of low Cl (orange trace; n = 3) to non-Cl substituted controls (green trace; n = 3) on depolarization-induced SV hyperacidification in a dVGLUT RNAi background in DA neurons. (C) dVGLUT RNAi expression in DA neurons attenuated depolarization-induced increases in SV acidification (−ΔF/Fi = 15.9% ± 0.7%; n = 3) relative to non-RNAi (−ΔF/Fi = 26.4% ± 2.7%; n = 4) or mCherry RNAi (−ΔF/Fi = 19.6% ± 1.9%; n = 5) controls (F(3,11) = 6.43, p = 0.009). Low Cl (20 mM) conditions in a dVGLUT knockdown background did not further alter depolarization-induced increases in SV acidification (−ΔF/Fi = 15.9% ± 0.7%; n = 3) compared to dVGLUT knockdown in unsubstituted (40 mM) Cl conditions (−ΔF/Fi = 12.4% ± 2.9%, n = 3; p > 0.05). (D) dVGLUT RNAi knockdown did not significantly modify timing (t = 62.5 ± 4.4 s) or half-life (t1/2 = 11.5 ± 1.6 s) to reach maximal acidification compared to the non-RNAi control (t = 46.6 ± 9.5 s; t1/2 = 6.7 ± 1.0 s; p > 0.05) or mCherry RNAi (t = 44.5 ± 13.2; t1/2 = 11.0 ± 2.7 s; p > 0.05) conditions. Low Cl conditions significantly delayed the absolute time (t = 160.0 ± 16.0 s, n = 3; p = 0.002) and kinetics (t1/2 = 43.2 ± 11.9 s, n = 3; p = 0.01) to reach maximal vesicle acidification compared to control levels of extracellular Cl in the dVGLUT RNAi condition. (E) RNAi knockdown of dVGLUT in presynaptic DA neurons (n = 27) diminished basal locomotion relative to that of control flies (26.2% reduction, n = 23; p = 0.0375). dVGLUT knockdown in DA neurons also decreased rates of hyperlocomotor activity in response to treatment with 10 mM AMPH compared to that of control flies (33.0% reduction, p < 0.0001; control: n = 16; dVGLUT RNAi: n = 68). (F) dVGLUT overexpression in presynaptic DA neurons (n = 43) significantly increased basal locomotion under vehicle-fed conditions compared to control flies (52% increase, p = 0.0175; n = 23). Flies overexpressing dVGLUT in DA neurons exhibited greater rates of locomotion in response to AMPH than controls (64.4% increase, p < 0.0001; n = 23). This AMPH-induced hyperlocomotion was produced at an AMPH concentration (5 mM) otherwise insufficient to produce hyperlocomotion in control flies (p > 0.05). All experiments were conducted on ≥2 separate occasions. (A)–(D): an ~60s baseline was recorded prior to KCl application (indicated by arrow). One-way ANOVAs with Tukey’s multiple comparisons test: (C) and (D); two-way ANOVAs with Tukey’s multiple comparisons test: (E) and (F). Error bars, SEM. Fly strains: dVGLUT RNAi (UAS-TeTxLC; TH-GAL4, UAS-dVMAT-pHluorin/ UAS-dVGLUT RNAi); non-RNAi control (UAS-TeTxLC; TH-GAL4, UAS-dVMAT-pHluorin/+); mCherry RNAi control (UAS-TeTxLC/UAS-mCherry RNAi; TH-GAL4, UAS-dVMAT-pHluorin/UAS-TeTxLC). Fly strains used in behavior: dVGLUT RNAi (TH-GAL4/UAS-dVGLUT RNAi); control (TH-GAL4/+). See also Figures S4–S6 and Table S1.
Figure 6
Figure 6. NHEs Mediate Depolarization-Induced Changes in SV pH and DA Content
(A) Left: schematic illustrating NHE inhibition by EIPA during high K+ stimulation (40 mM KCl). Right: averaged dVMAT-pHluorin fluorescence traces measuring changes in SV pH during KCl stimulation in brains pre-treated with NHE inhibitor EIPA (50 µM, 15 min; blue trace, n = 5 flies) compared to high K+ stimulation alone (black trace, n = 8). (B) EIPA pre-treatment (n = 5) significantly decreased the magnitude of depolarization-induced SV hyperacidification compared to the non-EIPA control (n = 8; p = 0.02). EIPA pre-treatment also delayed the timing (t = 117.5 ± 14.0 s; p = 0.03) and kinetics (t1/2 = 33.6 ± 8.9 s; p = 0.004) to reach maximal vesicle acidification compared to the non-pretreated control. (C) In the absence of TeTxLC expression in DA terminals, EIPA still attenuated SV hyperacidification preceding KCl-induced exocytic SV fusion (blue trace, n = 5) compared to the non-pretreated control (black trace, n = 6; p < 0.05); duration and magnitude of SV hyperacidification is represented as area under the curve (AUC). Curves represent average dVMAT-pHluorin fluorescence traces. (D) Left: EIPA pre-treatment abolished depolarization-induced increases in DA vesicle loading in presynaptic DA nerve terminals (blue trace; n = 4) compared to non-pretreated controls (black trace; n = 4). Right: EIPA pre-treatment significantly slowed FFN206 vesicle destaining (t1/2=102.1±22.8 s; n=4) compared to non-EIPA pre-treated controls (t1/2 = 5.2 ± 0.9 s, n = 4; p = 0.005) as fit to a monoexponential decay. An ~60 s baseline was recorded prior to KCl application (indicated by arrow). Unpaired t tests: (B)–(D). Error bars, SEM. Fly strains: (A) and (B): TeTxLC; TH-GAL4, UAS-dVMAT-pHluorin; (C): +; TH-GAL4, UAS-dVMAT-pHluorin; (D): dVMATP1; TH-GAL4, UAS-dVMAT.
Figure 7
Figure 7. Depolarization-Induced SV Acidification Is Present in Mammalian DA Nerve Terminals and Mediated by VGLUT2 and NHE
(A) Schematic illustration shows the coronal brain slice used for FFN102 recordings through the NAc core (outlined in magenta). FFN102 imaging was conducted at the site indicated by the black box. The structural formula of FFN102 (phenol pKa = 6.2, shown as a free base) is alongside the schedule for FFN102 release experiments. Medioventral acute brain slices were pre-loaded with FFN102 for 30 min followed by perfusion over a 15 min interval. Half the slices were perfused with ACSF (vehicle) and the other half with KCl (40 mM) after acquisition of an unstimulated baseline (indicated by arrow). (B) Averaged traces of FFN102 fluorescence ratios in the presence (red trace) or absence (black trace) of KCl stimulation. KCl stimulation increased SV acidification ~6-fold relative to baseline (measured as AUC; n = 7 slices) compared to non-stimulated vehicle controls (n = 8; p = 0.03). (C) Schematic of the constructs AAV-mCherry and AAV-mCherry-cre and an illustration of the VTA injection site for VGLUT2 cKO experiments. (D) Averaged traces of FFN102 fluorescence ratios from mouse medioventral striatal brain slices in response to KCl stimulation. Slices were obtained from VGLUT2flox/flox mice injected with mCherry-tagged AAV-cre virus (VGLUT2 cKO, n = 6; green trace) or AAV-mCherry virus (control, n = 9; black trace). Experiments were conducted according to the schedule in (A). VGLUT2 cKO significantly reduced depolarization-induced SV hyperacidification compared to controls (p = 0.03). (E) Schematic illustration of the coronal brain slice used for FFN102 recordings in EIPA experiments and alongside is the schedule. Brain slices from WT C57BL/6J mice were either pre-treated with EIPA (25 µM; 2.5 min) or ACSF vehicle, followed by KCl stimulation (40 mM; indicated by arrow) in the continued presence of EIPA or vehicle. (F) Averaged traces of FFN102 fluorescence ratios in WT medioventral striatal brain slices acutely pre-treated with EIPA prior to KCl stimulation (blue trace) compared to vehicle pre-treated control slices (black trace). Acute EIPA treatment (n = 6) significantly decreased depolarization-induced hyperacidification prior to exocytosis compared with untreated controls (n = 7, p = 0.03); see STAR Methods for y axis normalization. (G) Effects of electrical stimulation on striatal DA release paired with acute NHE inhibition. Schematic illustration shows the coronal brain slice used for FSCV recordings in the NAc core (outlined in magenta). Alongside is the schedule for electrical stimulation. Brain slices from WT mice were stimulated by single pulses (SPs; 1 ms, 40 µA) every 2 min followed by a train of stimulation (20 pulses, 20 Hz). This schedule was repeated three times with either EIPA (25 µM) or ACSF vehicle application following train 2. (H) No significant differences in evoked DA release were detected between EIPA-treated (blue circle; n = 9) versus vehicle controls (open circle; n = 8) in response to SPs (p > 0.5). Evoked DA release after each SP was normalized to the maximal DA release within each stimulation cycle (arrow indicates onset of EIPA treatment). (I) EIPA treatment (25 µM; blue circle, n = 9)decreased evoked DA release following the third train compared to the vehicle control (open circle, n = 8; p = 0.004). In vehicle-treated slices, a significant increase in evoked DA release was evident following repeated trains of stimulation (train 1 versus 3; p = 0.018). EIPA or the ACSF control was applied following the second stimulation cycle (indicated by arrow). Unpaired t tests: (B), (D), and (E); repeated-measures ANOVAs: (H) and (I). Error bars, SEM: (B)–(D). See also Figures S7 and S8.
Figure 8
Figure 8. Model for the Proposed Mechanism for Depolarization-Induced SV Hyperacidification
We propose a model for increases in SV acidification and content in DA terminals in response to neuronal stimulation as follows: (1) neuronal depolarization triggers increases in cytoplasmic Na+ concentration; (2) NHE-mediated cation influx into SVs increases vesicle ΔΨ; (3) changes in ΔΨ drive glutamate transport into SVs via VGLUT; (4) the resulting buildup of intraluminal negative charge increases the vesicular proton-motive force, causing the V-ATPase to pump more H+ into the vesicle; and (5) the rise in ΔpH increases the driving force for VMAT-dependent DA loading into SVs.

Comment in

References

    1. Baek M, Enriquez J, Mann RS. Dual role for Hox genes and Hox co-factors in conferring leg motoneuron survival and identity in Drosophila. Development. 2013;140:2027–2038. - PMC - PubMed
    1. Barker DJ, Root DH, Zhang S, Morales M. Multiplexed neurochemical signaling by neurons of the ventral tegmental area. J. Chem. Neuroanat. 2016;73:33–42. - PMC - PubMed
    1. Beck ES, Gasque G, Imlach WL, Jiao W, Jiwon Choi B, Wu PS, Kraushar ML, McCabe BD. Regulation of Fasciclin II and synaptic terminal development by the splicing factor beag. J. Neurosci. 2012;32:7058–7073. - PMC - PubMed
    1. Birgner C, Nordenankar K, Lundblad M, Mendez JA, Smith C, le Greveés M, Galter D, Olson L, Fredriksson A, Trudeau LE, et al. VGLUT2 in dopamine neurons is required for psychostimulant-induced behavioral activation. Proc. Natl. Acad. Sci. USA. 2010;107:389–394. - PMC - PubMed
    1. Blakely RD, Edwards RH. Vesicular and plasma membrane transporters for neurotransmitters. Cold Spring Harb. Perspect. Biol. 2012;4:4. - PMC - PubMed

MeSH terms