Review
. 2017 Aug 3:11:390.
doi: 10.3389/fnhum.2017.00390. eCollection 2017.

When Null Hypothesis Significance Testing Is Unsuitable for Research: A Reassessment

Affiliations
Review

When Null Hypothesis Significance Testing Is Unsuitable for Research: A Reassessment

Denes Szucs et al. Front Hum Neurosci. .

Abstract

Null hypothesis significance testing (NHST) has several shortcomings that are likely contributing factors behind the widely debated replication crisis of (cognitive) neuroscience, psychology, and biomedical science in general. We review these shortcomings and suggest that, after sustained negative experience, NHST should no longer be the default, dominant statistical practice of all biomedical and psychological research. If theoretical predictions are weak we should not rely on all or nothing hypothesis tests. Different inferential methods may be most suitable for different types of research questions. Whenever researchers use NHST they should justify its use, and publish pre-study power calculations and effect sizes, including negative findings. Hypothesis-testing studies should be pre-registered and optimally raw data published. The current statistics lite educational approach for students that has sustained the widespread, spurious use of NHST should be phased out.

Keywords: Bayesian methods; false positive findings; null hypothesis significance testing; replication crisis; research methodology.


Figures

Figure 1
Figure 1
NHST concepts make sense in the context of a long run of studies. 3 × 10,000 studies with normally distributed data were simulated for 3 situations (A: True H0 situation: Mean = 0; SD = 1; n = 16. B: Mean = 0.5; SD = 1; n = 16; Power = 0.46. C: Mean = 0.5; SD = 1; n = 32; Power = 0.78.). One sample two-tailed t-tests determined whether the sample means were zero. The red dots in the top panels show t scores for 3 × 1,000 studies (not all studies are shown for better visibility). The vertical dashed lines mark the critical rejection thresholds for H0, t(α/2) for the two-tailed test. The studies producing a t statistic more extreme than these thresholds are declared statistically significant. The middle panels show the distribution of t scores for all 3 × 10,000 studies (bins = 0.1). The bottom panels show the distribution of p-values for all 3 × 10,000 studies (bins = 0.01) and state the proportion of significant studies. The inset in the bottom right panel shows the mean absolute effect sizes in standard deviation units for situations A-C from all significant (Sig.) and non-significant (n.s.) studies with 95% bias corrected and accelerated bootstrap confidence intervals (10,000 permutations). The real effect size was 0 in situation (A) and 0.5 in situations (B,C). Note that the less is the power the more statistically significant studies overstate the effect size. Also note that p-values are randomly distributed and the larger is power the more right skewed is the distribution of p-values. In the true H0 situation the distribution of p-values is uniform between 0 and 1. See further explanation of this figure in Appendix 2 in Supplementary Material.
Figure 2
Figure 2
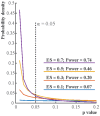
The distribution of p-values if the alternative hypothesis (H1) is true. Each line depicts the distribution of p-values resulting from one-sample two-tailed t-tests testing whether the sample mean was zero. Effect sizes (ES) indicate the true sample means for normally distributed data with standard deviation 1. For each effect size one million simulations were run with 16 cases in each simulation. The distribution of the p-value is becoming increasingly right skewed with increasing effect size and power. Note that α, the Type I error rate, is fix irrespective of what p-value is found in an experiment.
Figure 3
Figure 3
The relationship of the p-value, test statistic and effect sizes. (A) The relationship of t values, degrees of freedoms and p-values for Pearson correlation studies (df = n–2). (B) The relationship of Pearson correlation (r) values, degrees of freedoms, and p-values [r = t/sqrt(df + t2)]. (C) The relationship of r- and t-value pairs for each degree of freedom at various p-values. The bold black lines mark the usual significance level of α = 0.05. Note that typically only results which exceed the α = 0.05 threshold are reported in papers. Hence, papers mostly report exaggerated effect sizes.
Figure 4
Figure 4
Illustration of long run False Positive Probability (FRP) and True Positive Probability (TRP) of studies. Let's assume that we run 2 × 100 studies, H0 is true in 100 studies and H1 is true in 100 studies with α = 0.05 and Power = 1−β = 0.6. (A) Shows the outcome of true H0 studies, 5 of the 100 studies coming up statistically significant. (B) Shows the outcome of true H1 studies, 60 of the 100 studies coming up statistically significant [note that realistically the 60 studies would be scattered around just as in panel (A) but for better visibility they are represented in a block]. (C) Illustrates that true H0 and true H1 studies would be indistinguishable. That is, researchers do not know which study tested a true H0 or true H1 situation (i.e., they could not distinguish studies represented by black and gray squares). All they know is whether the outcome of a particular study out of the 200 studies run was statistically significant or not. FRP is the ratio of false positive (H0 is true) statistically significant studies to all statistically significant studies: 5/65 = 0.0769. TRP is the ratio of truly positive (H1 is true) statistically significant studies to all statistically significant studies: 60/65 = 0.9231 = 1 − FRP = 1 − 0.0769.

References

    1. Aarts A. A., Anderson J. E., Anderson C. J., Attridge P. R., Attwood A., Axt J., et al. (2015). Estimating the reproducibility of psychological science. Science 349, 943 10.1126/science.aac4716 - DOI - PubMed
    1. Bakan D. (1966). The test of significance in psychological research. Psychol. Bull. 66, 423–437. 10.1037/h0020412 - DOI - PubMed
    1. Bakker M., Wicherts J. M. (2001). The misreporting of statistical results in psychology journals. Behav. Res. Methods 43, 666–678. 10.3758/s13428-011-0089-5 - DOI - PMC - PubMed
    1. Bayarri M. J., Benjamin D. J., Berger J. O., Sellke T. M. (2016). Rejection odds and rejection ratios: a proposal for statistical practice in testing hypotheses. J. Math. Psychol. 72, 90–103. 10.1016/j.jmp.2015.12.007 - DOI - PMC - PubMed
    1. Begley C. G., Ellis L. M. (2012). Raise standards for preclinical cancer research. Nature 483, 531–533. 10.1038/483531a - DOI - PubMed

LinkOut - more resources