. 2017 Aug 3:8:1337.
doi: 10.3389/fpsyg.2017.01337. eCollection 2017.

Evaluating Hierarchical Structure in Music Annotations

Affiliations

Evaluating Hierarchical Structure in Music Annotations

Brian McFee et al. Front Psychol. .

Abstract

Music exhibits structure at multiple scales, ranging from motifs to large-scale functional components. When inferring the structure of a piece, different listeners may attend to different temporal scales, which can result in disagreements when they describe the same piece. In the field of music informatics research (MIR), it is common to use corpora annotated with structural boundaries at different levels. By quantifying disagreements between multiple annotators, previous research has yielded several insights relevant to the study of music cognition. First, annotators tend to agree when structural boundaries are ambiguous. Second, this ambiguity seems to depend on musical features, time scale, and genre. Furthermore, it is possible to tune current annotation evaluation metrics to better align with these perceptual differences. However, previous work has not directly analyzed the effects of hierarchical structure because the existing methods for comparing structural annotations are designed for "flat" descriptions, and do not readily generalize to hierarchical annotations. In this paper, we extend and generalize previous work on the evaluation of hierarchical descriptions of musical structure. We derive an evaluation metric which can compare hierarchical annotations holistically across multiple levels. sing this metric, we investigate inter-annotator agreement on the multilevel annotations of two different music corpora, investigate the influence of acoustic properties on hierarchical annotations, and evaluate existing hierarchical segmentation algorithms against the distribution of inter-annotator agreement.

Keywords: evaluation; hierarchy; inter-annotator agreement; music structure.


Figures

Figure 1
Figure 1
The L-measure is computed by identifying triples of time instants (t, u, v) where (t, u) meet at a deeper level of the hierarchy (indicated by solid lines) than (t, v) (dashed lines), as illustrated in the left plot (Annotator 1). In this example, the left annotation has M(t, u) = 2 (both belong to lower-level segments labeled as d), and M(t, v) = 1 (both belong to upper-level segments labeled as C). The right annotation has M(t, u) = M(t, v) = 2: all three instants belong to segment label f, as indicated by the solid lines. This triple is therefore counted as evidence of disagreement between the two hierarchies.
Figure 2
Figure 2
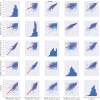
Relations between the different segment labeling metrics on the SALAMI dataset. Each subplot (i, j) corresponds to a pair of distinct metrics for ij, while the main diagonal illustrates the histogram of scores for the ith metric. Each point within a subplot corresponds to a pair of annotations of the same recording. The best-fit linear regression line between each pair of metrics is overlaid in red, with shaded regions indicating the 95% confidence intervals.
Figure 3
Figure 3
For each pair of annotations in the SALAMI dataset, we compare the L-measure to the maximum and minimum agreement between the upper and lower levels. Agreement is measured by pairwise frame classification metrics. Red lines indicate the median values for each metric. A small maximum F-measure (quadrants II and III in the left plot) indicates disagreement at both levels; a large minimum F-measure (quadrants I and IV in the right plot) indicates agreement at both levels.
Figure 4
Figure 4
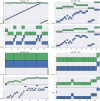
Four example tracks from SALAMI, one drawn from each quadrant of Figure 3 (Left), which compares L-measure to the maximum of upper- and lower-level pairwise F-measure between tracks. For each track, two hierarchical annotations are displayed (top and bottom), and within each hierarchy, the upper level is marked in green and the lower in blue. (Upper right) Track 555 (L = 0.94, upper F = 0.92, lower F = 0.69) has high agreement at the upper level, and small agreement at the lower level. (Upper left) Track 347 (L = 0.89, upper F = 0.65, lower F = 0.19) has little within-level agreement between annotations, but the upper level of the top annotation is nearly identical to the lower level of the bottom annotation, and the L-measure identifies this consistency. (Bottom left) Track 436 (L = 0.24, upper F = 0.35, lower F = 0.44) has little agreement at any level, and receives small scores in all metrics. (Bottom right) Track 616 (L = 0.30, upper F = 0.998, lower F = 0.66) has high agreement within the upper level, but disagreement in the lower levels.
Figure 5
Figure 5
Four example tracks from SALAMI, one drawn from each quadrant of Figure 3 (Right), which compares L-measure to the minimum of upper- and lower-level pairwise F-measure between tracks. (Upper right) Track 829 (L = 0.94, upper F = 0.93, lower F = 0.96) has high agreement at the both levels, and consequently a large L-measure. (Upper left) Track 307 (L = 0.94, upper F = 0.92, lower F = 0.11) has high agreement in the upper level, but the first annotator did not detect the same repetition structure as the second in the lower level. (Bottom left) Track 768 (L = 0.06, upper F = 0.43, lower F = 0.18) has little agreement at any level because the first annotator produced only single-label annotations. (Bottom right) Track 1342 (L = 0.39, upper F = 0.80, lower F = 0.80) has high pairwise agreement at both levels, but receives a small L-measure because the first annotator did not identify the distinct C/c sections indicated by the second annotator.
Figure 6
Figure 6
Features extracted from an example track in the SALAMI dataset, as described in Section 5.
Figure 7
Figure 7
Feature correlation compared to L-measures on the SALAMI (Left) and SPAM (Right) datasets.
Figure 8
Figure 8
The mean feature correlation for each feature type and annotator on the SPAM dataset. Error bars indicate the 95% confidence intervals estimated by bootstrap sampling (n = 1, 000). Left: results are grouped by annotator ID; Right: results are grouped by feature type.
Figure 9
Figure 9
Feature correlation for SALAMI track #410: Erik TruffazBetty, which achieves δ = 0.67, L-measure = 0.25. The two annotations encode different hierarchical repetition structures, depicted in the meet matrices in the right-most column. Annotator 1's hierarchy is more highly correlated with the feature-based similarities: z = (0.62, 0.42, 0.26, 0.48) for tempo, rhythm, chroma, and MFCC, compared to z = (0.03, 0.07, 0.07, 0.04) for Annotator 2.
Figure 10
Figure 10
Feature correlation for SALAMI track #936: Astor PiazzolaTango Aspasionado, which achieves δ = 0.45, L-measure = 0.46. Annotator 1 is highly correlated with the features: z = (0.57, 0.40, 0.11, 0.25) for tempo, rhythm, chroma, and MFCC, compared to z = (0.16, 0.12, 0.13, 0.25) for Annotator 2.
Figure 11
Figure 11
The distribution L-measure scores for inter-annotator agreement, OLDA-2DFMC, and Laplacian on the SALAMI (Top row) and SPAM (Bottom row) datasets. The left, middle, and right columns compare algorithm L-precision, L-recall, and L-measure to inter-annotator scores. For each algorithm, the two-sample Kolmogorov-Smirnov test statistic K is computed against the inter-annotator distribution (smaller K is better).

References

    1. Balke S., Arifi-Müller V., Lamprecht L., Müller M. (2016). Retrieving audio recordings using musical themes, in Proceedings of the IEEE International Conference on Acoustics, Speech, and Signal Processing (ICASSP) (Shanghai: ).
    1. Barwick L. (1989). Creative (ir) regularities: the intermeshing of text and melody in performance of central australian song. Aus. Aboriginal Stud. 1, 12–28.
    1. Bharucha J. J., Curtis M., Paroo K. (2006). Varieties of musical experience. Cognition 100, 131–172. 10.1016/j.cognition.2005.11.008 - DOI - PubMed
    1. Bruderer M. J. (2008). Perception and Modeling of Segment Boundaries in Popular Music. PhD thesis, Doctoral dissertation, JF Schouten School for User-System Interaction Research, Technische Universiteit Eindhoven.
    1. Clayton M. (1997). Le mètre et le tāl dans la musique de l'inde du nord. Cahiers Musiques Traditionnelles 10, 169–189. 10.2307/40240271 - DOI