. 2017 Aug 2:8:913.
doi: 10.3389/fimmu.2017.00913. eCollection 2017.

Intrinsic Plasma Cell Differentiation Defects in B Cell Expansion with NF-κB and T Cell Anergy Patient B Cells

Affiliations

Intrinsic Plasma Cell Differentiation Defects in B Cell Expansion with NF-κB and T Cell Anergy Patient B Cells

Swadhinya Arjunaraja et al. Front Immunol. .

Abstract

B cell Expansion with NF-κB and T cell Anergy (BENTA) disease is a novel B cell lymphoproliferative disorder caused by germline, gain-of-function mutations in the lymphocyte scaffolding protein CARD11, which drives constitutive NF-κB signaling. Despite dramatic polyclonal expansion of naive and immature B cells, BENTA patients also present with signs of primary immunodeficiency, including markedly reduced percentages of class-switched/memory B cells and poor humoral responses to certain vaccines. Using purified naive B cells from our BENTA patient cohort, here we show that BENTA B cells exhibit intrinsic defects in B cell differentiation. Despite a profound in vitro survival advantage relative to normal donor B cells, BENTA patient B cells were severely impaired in their ability to differentiate into short-lived IgDloCD38hi plasmablasts or CD138+ long-lived plasma cells in response to various stimuli. These defects corresponded with diminished IgG antibody production and correlated with poor induction of specific genes required for plasma cell commitment. These findings provide important mechanistic clues that help explain both B cell lymphocytosis and humoral immunodeficiency in BENTA disease.

Keywords: B cell Expansion with NF-κB and T cell Anergy; BLIMP-1; CARD11; antibodies; humans; plasma cells; primary immunodeficiency.


Figures

Figure 1
Figure 1
Naive B cell isolation from healthy donor and B cell Expansion with NF-κB and T cell Anergy (BENTA) patient peripheral blood mononuclear cell (PBMC). Flow cytometric analysis of CD19+ CD10+ transitional B cells (A) and CD19+ CD27+ memory B cells (B) from healthy human control (top row) versus BENTA patient P4 PBMC (bottom row) before and after naive B cell isolation along with CD10+ depletion.
Figure 2
Figure 2
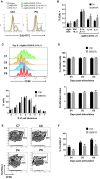
Normal proliferation of B cell Expansion with NF-κB and T cell Anergy (BENTA) B cells upon activation in culture. (A) In vitro proliferation assay using EdU incorporation for healthy control and BENTA patient P6 B cells in response to various activating stimuli in culture, assessed by flow cytometry. Data are representative of seven independent experiments. (B) Quantification of proliferating cells (% EdU+) for healthy control (black) and BENTA B cells (gray) subjected to different stimuli in culture. Data are mean ± SEM of seven independent experiments (n = 6 controls, four BENTA patients). (C) Flow cytometric CFSE dilution analysis of naive control (C7, C8) and BENTA patient (P4, P6) B cells activated with anti-IgM/anti-CD40/IL-21/IL-2 for 6 days. The percentage of control (black) and BENTA (gray) B cells that divided 0–7 times on day 6 is displayed below. Data are mean ± SEM for two independent experiments (n = 4 controls, three BENTA patients). (D) Bar graphs displaying the percentage of divided cells (top, mean ± SEM) and proliferative index (bottom, mean ± SEM) for data shown in (C), days 4–6 in culture. (E) Flow cytometric analysis of CFSE dilution versus TO-PRO-3 live/dead cell indicator staining on day 6 of cultures in (C). Percentage of dead cells (TO-PRO-3+) is noted for gates shown in each plot. (F) Quantification of dead (TO-PRO3+) control (black) and BENTA (gray) B cells over days 4–6 in culture. Data are mean ± SEM for two independent experiments (n = 4 controls, three BENTA patients). Asterisk denotes statistical significance (Student’s t-test with Welch correction, p < 0.05).
Figure 3
Figure 3
Impaired plasma cell differentiation of B cell Expansion with NF-κB and T cell Anergy (BENTA) B cells in culture. (A) Purified control and BENTA P6 naive B cells were stimulated with anti-IgM/anti-CD40/IL-21 and IL-2 for 6 days. The percentages of short-lived plasma cells (PCs) (IgDlo CD38hi cells) in control (upper panel) and BENTA (lower panel) B cells were identified by gating on viable cells based on forward/side scatter. Data are representative of seven independent experiments. (B) Bar graph representing percentages of short-lived PCs (mean ± SEM) in control (black) and BENTA B cell cultures (gray) from seven independent experiments (n = 6 controls, four BENTA patients). Asterisk denotes statistical significance (Student’s t-test with Welch correction, p < 0.05). (C) Purified control and BENTA P6 naive B cells stimulated in (A) were supplemented with additional cytokines (IFN-α, IL-6, and IL-21) from day 6 onward until day 13. The percentage of short-lived PC (IgDlo CD38hi cells, left) and long-lived PCs (CD38hi CD138hi cells, right) for control and BENTA B cells were determined by flow cytometry. (D) Bar graph representing percentages (mean ± SEM) of short-lived (top) and long-lived PC (bottom) in control (black) and BENTA (gray) B cell cultures from seven independent experiments (n = 6 controls, four patients). Asterisks denote statistical significance (Student’s t-test with Welch correction, p < 0.05).
Figure 4
Figure 4
Poor IgG production from stimulated B cell Expansion with NF-κB and T cell Anergy (BENTA) B cells. (A,B) Supernatants from purified healthy control (black) versus BENTA (gray) naive B cells cultured with various activating stimuli were collected on day 10 and used for quantification of IgM (A) or IgG (B) by ELISA. Data represent IgM or IgG levels (mean ± SEM) for control (n = 6) and BENTA patient (n = 4) B cells from seven independent experiments. Asterisks denote statistical significance (Student’s t-test with Welch correction, p < 0.05).
Figure 5
Figure 5
Decreased frequency of IgG antibody secreting cells (ASC) from in vitro stimulated B cell Expansion with NF-κB and T cell Anergy (BENTA) patient B cells. (A) Representative enzyme-linked immunosorbent spot (ELISPOT) data for control (left) and BENTA P6 (right) B cells following various activating stimuli. Red spots (IgM) and blue spots (IgG) indicate the number of antibody secreting cells as shown. Data are representative of six different experiments (n = 5 controls, four patients). Comparison of IgM (B) or IgG (C) ASC per million B cells (mean ± SEM) in control (black) and BENTA (gray) B cells analyzed in (A). (D) Flow cytometric staining for surface IgG+ B cells for control (C7, C8) and BENTA patient (P4, P6) B cells stimulated with anti-IgM/anti-CD40/IL-21/IL-2 for 10 days.
Figure 6
Figure 6
Lower expression of key plasma cell (PC) differentiation factors in activated B cell Expansion with NF-κB and T cell Anergy (BENTA) B cells. (A) Heatmap display of PC differentiation genes in activated control and BENTA RNA samples (day 4). Red color indicates high expression while blue color indicates low expression. Four different control and four different BENTA patient samples with two replicates were used for analysis. (B) Validation of gene expression comparing BENTA patients vs. controls (Log2 ratio, mean ± SEM) for select PC genes by qPCR. Data represent the average of relative normalized gene expression (based on housekeeping genes HPRT2 and RPL13) from four different control and four different BENTA samples each with two replicates. Asterisks denote statistical significance (Student’s t-test with Welch correction, p < 0.05). (C) Representative immunoblots of B cell lysates prepared from activated naive control and BENTA B cells for the indicated proteins. Data are representative of three independent experiments (n = 4 controls, four BENTA patients). (D) Bar graph represents comparison of normalized densitometric intensity (mean ± SD) of key PC differentiation factors and IgG in control (black) and BENTA (gray) B cells shown in (C). Protein expression was normalized to GAPDH expression.

References

    1. Arjunaraja S, Snow AL. Gain-of-function mutations and immunodeficiency: at a loss for proper tuning of lymphocyte signaling. Curr Opin Allergy Clin Immunol (2015) 15(6):533–8.10.1097/ACI.0000000000000217 - DOI - PMC - PubMed
    1. Snow AL, Xiao W, Stinson JR, Lu W, Chaigne-Delalande B, Zheng L, et al. Congenital B cell lymphocytosis explained by novel germline CARD11 mutations. J Exp Med (2012) 209(12):2247–61.10.1084/jem.20120831 - DOI - PMC - PubMed
    1. Blonska M, Lin X. CARMA1-mediated NF-kappaB and JNK activation in lymphocytes. Immunol Rev (2009) 228(1):199–211.10.1111/j.1600-065X.2008.00749.x - DOI - PMC - PubMed
    1. Hamilton KS, Phong B, Corey C, Cheng J, Gorentla B, Zhong X, et al. T cell receptor-dependent activation of mTOR signaling in T cells is mediated by Carma1 and MALT1, but not Bcl10. Sci Signal (2014) 7(329):ra55.10.1126/scisignal.2005169 - DOI - PMC - PubMed
    1. Thome M, Charton JE, Pelzer C, Hailfinger S. Antigen receptor signaling to NF-kappaB via CARMA1, BCL10, and MALT1. Cold Spring Harb Perspect Biol (2010) 2(9):a003004.10.1101/cshperspect.a003004 - DOI - PMC - PubMed