. 2017 Aug 3:8:1347.
doi: 10.3389/fpls.2017.01347. eCollection 2017.

Knock-Down of the IFR1 Protein Perturbs the Homeostasis of Reactive Electrophile Species and Boosts Photosynthetic Hydrogen Production in Chlamydomonas reinhardtii

Affiliations

Knock-Down of the IFR1 Protein Perturbs the Homeostasis of Reactive Electrophile Species and Boosts Photosynthetic Hydrogen Production in Chlamydomonas reinhardtii

Deepak Venkanna et al. Front Plant Sci. .

Abstract

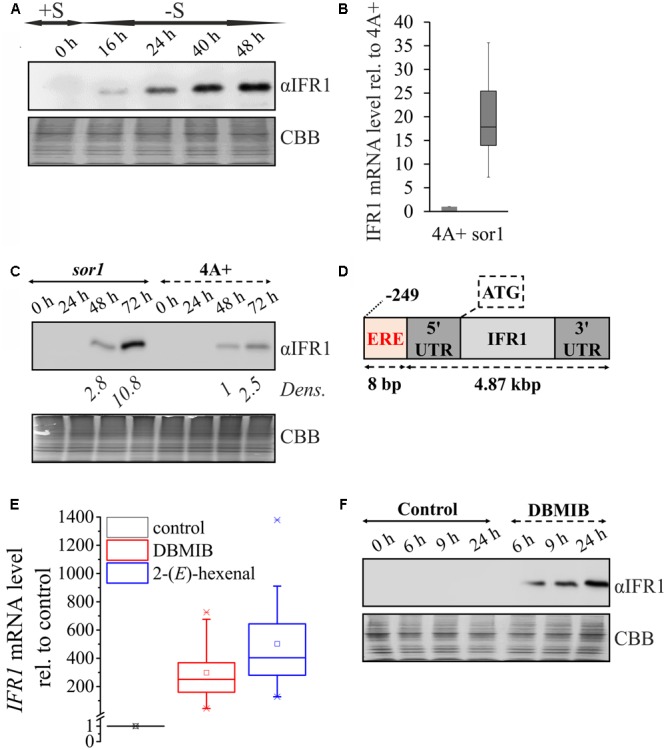
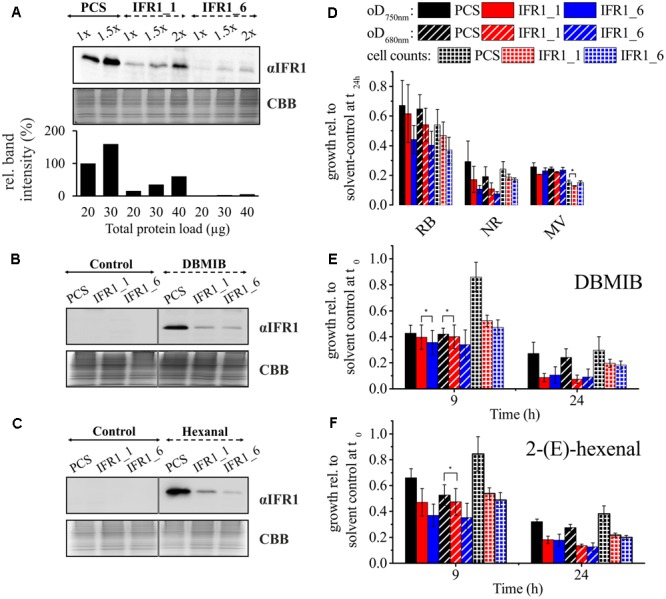
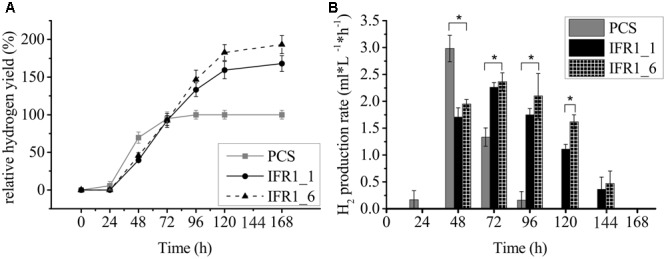
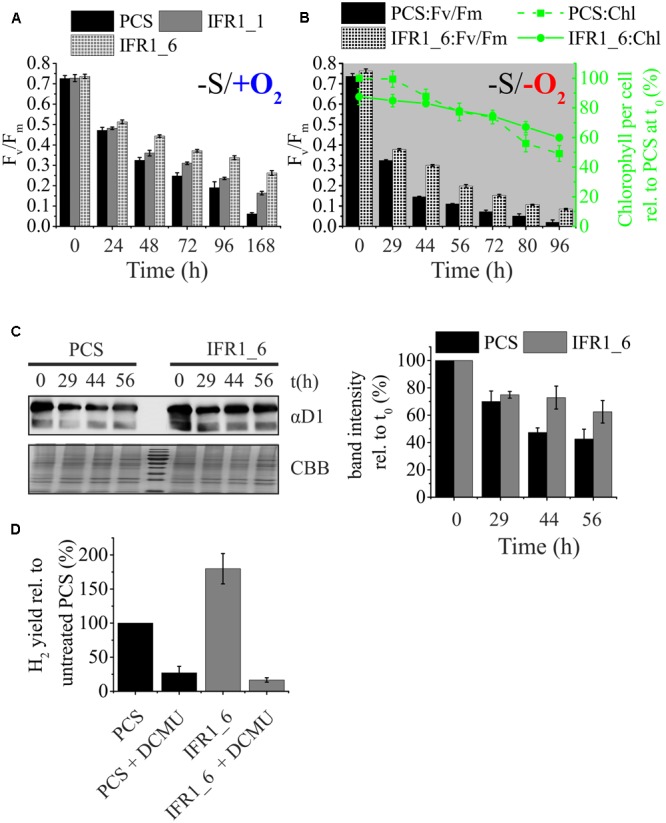
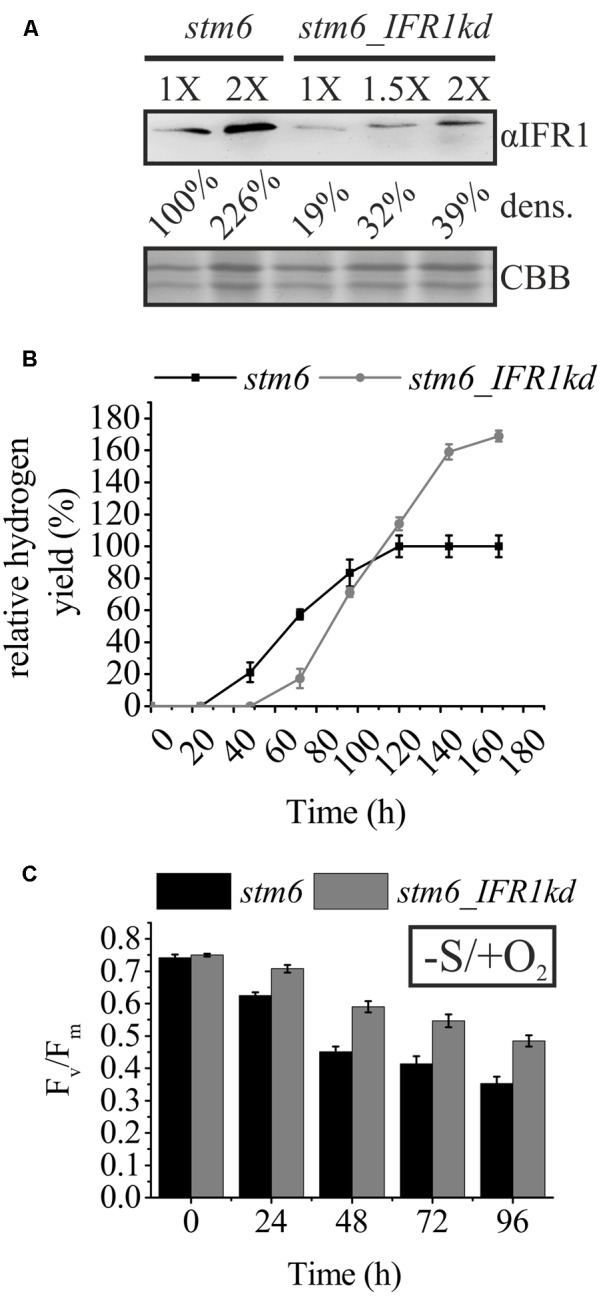
The protein superfamily of short-chain dehydrogenases/reductases (SDR), including members of the atypical type (aSDR), covers a huge range of catalyzed reactions and in vivo substrates. This superfamily also comprises isoflavone reductase-like (IRL) proteins, which are aSDRs highly homologous to isoflavone reductases from leguminous plants. The molecular function of IRLs in non-leguminous plants and green microalgae has not been identified as yet, but several lines of evidence point at their implication in reactive oxygen species homeostasis. The Chlamydomonas reinhardtii IRL protein IFR1 was identified in a previous study, analyzing the transcriptomic changes occurring during the acclimation to sulfur deprivation and anaerobiosis, a condition that triggers photobiological hydrogen production in this microalgae. Accumulation of the cytosolic IFR1 protein is induced by sulfur limitation as well as by the exposure of C. reinhardtii cells to reactive electrophile species (RES) such as reactive carbonyls. The latter has not been described for IRL proteins before. Over-accumulation of IFR1 in the singlet oxygen response 1 (sor1) mutant together with the presence of an electrophile response element, known to be required for SOR1-dependent gene activation as a response to RES, in the promoter of IFR1, indicate that IFR1 expression is controlled by the SOR1-dependent pathway. An implication of IFR1 into RES homeostasis, is further implied by a knock-down of IFR1, which results in a diminished tolerance toward RES. Intriguingly, IFR1 knock-down has a positive effect on photosystem II (PSII) stability under sulfur-deprived conditions used to trigger photobiological hydrogen production, by reducing PSII-dependent oxygen evolution, in C. reinhardtii. Reduced PSII photoinhibition in IFR1 knock-down strains prolongs the hydrogen production phase resulting in an almost doubled final hydrogen yield compared to the parental strain. Finally, IFR1 knock-down could be successfully used to further increase hydrogen yields of the high hydrogen-producing mutant stm6, demonstrating that IFR1 is a promising target for genetic engineering approaches aiming at an increased hydrogen production capacity of C. reinhardtii cells.

Keywords: Chlamydomonas reinhardtii; isoflavone reductase-like proteins; photobiological hydrogen production; reactive electrophile species; short-chain dehydrogenases/reductases; singlet oxygen response 1 (sor1).


Figures

FIGURE 1
FIGURE 1
IFR1 localizes to the cytosol in Chlamydomonas reinhardtii cells. Laser scanning confocal microscopy detection of subcellular localization of the mVenus (yellow) fluorescent reporter fused to N- or C-terminus of IFR1 (N/C). A cell line expressing mVenus in the cytosol (Cyto, Lauersen et al., 2015) and the parental strain (PCS) served as controls. Individual imaging channels are presented, YFP: mVenus reporter signal in the yellow range, Chlorophyll: autofluorescence of chlorophyll visualized in the red range and used to orient the cells, Overlay: YFP and Chloro channel overlay, DIC: differential interference contrast. Scale bars represent 5 μm.
FIGURE 2
FIGURE 2
IFR1 accumulation is triggered by the SOR1-dependent pathway. (A) Samples were taken before (0 h, +S) and during the course of hydrogen production induced by sulfur deprivation of a wild type cell line (16–48 h; –S). IFR1 accumulation was analyzed with an IFR1-specific antiserum (αIFR1) and equal protein loading confirmed by colloidal Coomassie staining (CBB). (B) Comparison of IFR1 mRNA levels in the sor1 mutant (Fischer et al., 2012) and its parental strain (4A+) with samples taken in the late exponential phase. mRNA levels were determined by RTqPCR and the IFR1 transcript level in 4A+ was set to 1. Median and interquartile range shown in the box-and-whisker diagram are derived from two biological replicates, each including nine technical replicates (n = 18). (C) Representative immunoblot (αIFR1) showing IFR1 accumulation during growth of mutant sor1 and its parental strain (4A+) in nutrient-replete TAP medium for 3 days. Relative band intensities (Dens.) determined by densitometric scanning of immunblot signals are given relative to the band intensity of the 4A+ sample at t48 h (set to 1). (D) Position of the octanucleotide motif CAACGTTG described to represent an electrophile response element (ERE; Fischer et al., 2012) implicated in the genetic response to reactive electrophile species (RES) and SOR1-dependent signaling relative to the start codon (ATG) of the 4.87 kbp IFR1 gene, comprising exons, introns and untranslated regions (UTRs). (E) IFR1 mRNA levels determined by RTqPCR following dark treatment of WT cell cultures with DBMIB (5 μM) and 2-(E)-hexenal (500 μM) for 24 h. The mRNA level of the solvent control sample was set to 1. Median and interquartile range shown in the box-and-whisker diagram are derived from two biological replicates, each including six technical replicates (n = 12). (F) Immunoblot (αIFR1) showing IFR1 accumulation distinct time points (6–24 h) after the addition of DBMIB (5 μM) or only solvent (Control) to a liquid TAP culture of the C. reinhardtii wild type CC124 and subsequent dark incubation for 24 h.
FIGURE 3
FIGURE 3
IFR1 knock-down causes diminished tolerance toward RES in C. reinhardtii. (A) Immunodetection of IFR1 protein (αIFR1) in the parental strain (PCS; wild type CC124) and IFR1 knock-down strains (IFR1_1 and IFR1_6) detected after 48 h of cultivation in sulfur deplete medium. A colloidal Coomassie stained gel (CBB) served as loading control. Different amounts of proteins were used and band intensities (lower bar diagram) determined by densitometric analysis (1x PCS set to 100%). (B,C) IFR1 accumulation in PCS and IFR1 knock-down strains grown for 24 h in TAP supplemented with DBMIB (5 μM) or 2-(E)-hexenal (500 μM). (D) Growth inhibition by reactive oxygen species determined for the PCS and the two IFR1 knock-down strains during 24 h of growth in TAP supplemented with 4 μM rose Bengal (RB), 15 μM neutral red (NR), or 0.5 μM methyl viologen (MV). Optical densities (determined at 680 and 750 nm) and cell counts are given relative to the untreated/solvent-control sample (set to 1). Error bars indicate standard errors derived from three biological replicates including technical replicates (n = 3). Asterisks indicate significant differences between PCS and knock-down strains according to a two-tailed Student’s t-test (p < 0.05). (E,F) Growth inhibition following treatment of PCS and IFR1 knock-down strains with 5 μM DBMIB and 500 μM 2-(E)-hexenal for 9 or 24 h in TAP medium. Standard errors are derived from three biological replicates, including technical replicates (n = 3). Except for the data indicated by asterisks (p > 0.05) differences between PCS and knock-down strains were significant according to a two-tailed Student’s t-test (p < 0.05).
FIGURE 4
FIGURE 4
Prolonged hydrogen production in IFR1 knock-down strains compared to the wild type. (A) Time course of hydrogen production for the parental strain (PCS) and IFR1 knock-down strains. Hydrogen yields in the knock-down strains are given relative to the final yield of the parental strain (set to 100%). Each data curve represents an average of three biological replicates including three technical triplicates (n = 9) with error bars representing the standard error. (B) H2 production rates during the course of hydrogen production. Error bars indicate the standard error (n = 9) and asterisks indicate differences between PCS and knock-down strains which are significant according to a two-tailed Student’s t-test (p < 0.05).
FIGURE 5
FIGURE 5
Contribution of PSII and photosynthetic/respiration (P/R) rates on hydrogen production. (A) Maximum quantum yield (Fv/Fm) of dark-adapted cells of the parental strain (PCS) and IFR1 knock-down strains (IFR1_1/IFR1_6) before (t0) and after exposure to sulfur limitation (t24–t168 h) and aerobic conditions. Error bars indicate the standard error from three biological replicates (n = 3). (B) Time course of the maximum quantum yield (Fv/Fm; left y-axis) and the cellular chlorophyll content (right y-axis) during photosynthetic hydrogen production of the parental strain (PCS) and one of the IFR1 knock-down strains (IFR1_6). Chlorophyll data were normalized to the chlorophyll content of PCS at t0 (set to 100%). Standard errors derived from three biological replicates (n = 3) are indicated as error bars. Except for t0, the differences between PCS and IFR1_6 in regard to Fv/Fm were significant according to a two-tailed Student’s t-test (p < 0.05). (C) Representative immunoblot showing the immunodetection of PSII subunit D1 (upper left panel; αD1) in samples of the parental strain (PCS) and IFR1_6 taken at indicated times during a hydrogen production experiment. A colloidal Coomassie stain (lower left panel; CBB) served as a loading control. Results from densitometric scanning (right panel) of blot signals are given relative to the D1 signal intensity determined for t0 (set to 100%). Error bars indicate standard errors (three biological replicates; n = 3). (D) Relative H2 yields obtained with the parental control strain (PCS) (black bars) and knock-down strain IFR1_6 (gray bars) in the absence or presence of 20 μM DCMU. Hydrogen yields determined for the untreated PCS were set to 100%. Error bars represent standard error (n = 6).
FIGURE 6
FIGURE 6
Knock-down of IFR1 in the boosts hydrogen production in the high hydrogen producer mutant stm6. (A) Immunoblot analysis of IFR1 accumulation in stm6 and stm6_IFR1kd cultivated under sulfur-limiting conditions. Different amounts of total protein (1X; 1.5X; and 2X) were used for immunodetection of IFR1 (αIFR1) with a colloidal Coomassie stain (CBB) serving as a loading control. Results from densitometric signal analysis (dens.) are indicated. (B) Relative time-dependent H2 yields of the stm6 parental strain (black curve) and stm6_IFR1kd (gray curve) with the final yield in stm6 set to 100%. Error bars represent the standard error (three biological replicates including technical triplicates, n = 9). (C) Maximum quantum yield of PSII determined after dark incubation (Fv/Fm) determined in cultures of stm6 (black bars) and stm6_IFR1kd (gray bars) exposed to sulfur starvation. Standard errors, shown as error bars are derived from three biological replicates including technical duplicates (n = 6). Except for t0, differences between stm6 and stm6_IFR1kd were significant according to a two-tailed Student’s t-test (p < 0.05).

References

    1. Andrianopoulos A., Kourambas S., Sharp J. A., Davis M. A., Hynes M. J. (1998). Characterization of the Aspergillus nidulans nmra gene involved in nitrogen metabolite repression. J. Bacteriol. 180 1973–1977. - PMC - PubMed
    1. Annamalai J., Nallamuthu T. (2014). Antioxidant potential phytochemicals from methanol extract of Chlorella vulgaris and Chlamydomonas reinhardtii. J. Algal Biomass Util. 5 60–67.
    1. Antal T. K., Krendeleva T. E., Laurinavichene T. V., Makarova V. V., Ghirardi M. L., Rubin A. B., et al. (2003). The dependence of algal H2 production on Photosystem II and O2 consumption activities in sulfur-deprived Chlamydomonas reinhardtii cells. Biochim. Biophys. Acta 1607 153–160. 10.1016/j.bbabio.2003.09.008 - DOI - PubMed
    1. Babbs C. F., Pham J. A., Coolbaugh R. C. (1989). Lethal hydroxyl radical production in paraquat-treated plants. Plant Physiol. 90 1267–1270. 10.1104/pp.90.4.1267 - DOI - PMC - PubMed
    1. Babiychuk E., Kushnir S., Belles-Boix E., Van Montagu M., Inze D. (1995). Arabidopsis thaliana NADPH oxidoreductase homologs confer tolerance of yeasts toward the thiol-oxidizing drug diamide. J. Biol. Chem. 270 26224–26231. 10.1074/jbc.270.44.26224 - DOI - PubMed

LinkOut - more resources