. 2017 Jul 8;7(11):2837-2848.
doi: 10.7150/thno.18968. eCollection 2017.

Non-Invasive Monitoring of CNS MHC-I Molecules in Ischemic Stroke Mice

Affiliations

Non-Invasive Monitoring of CNS MHC-I Molecules in Ischemic Stroke Mice

Jing Xia et al. Theranostics. .

Abstract

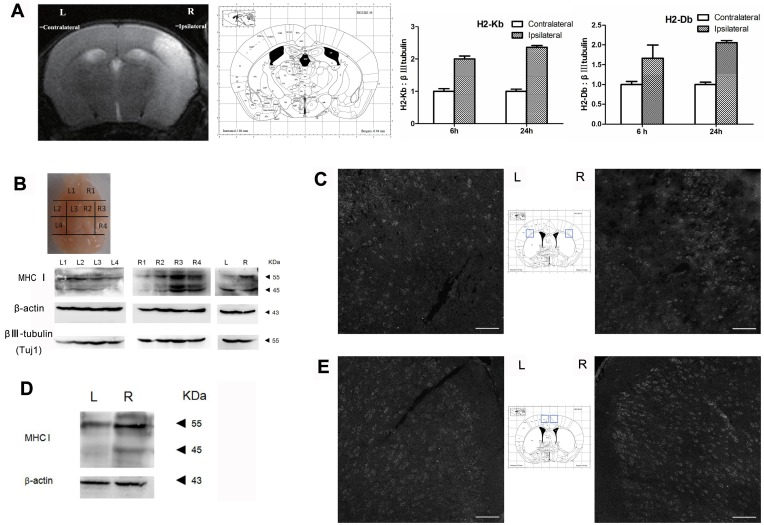
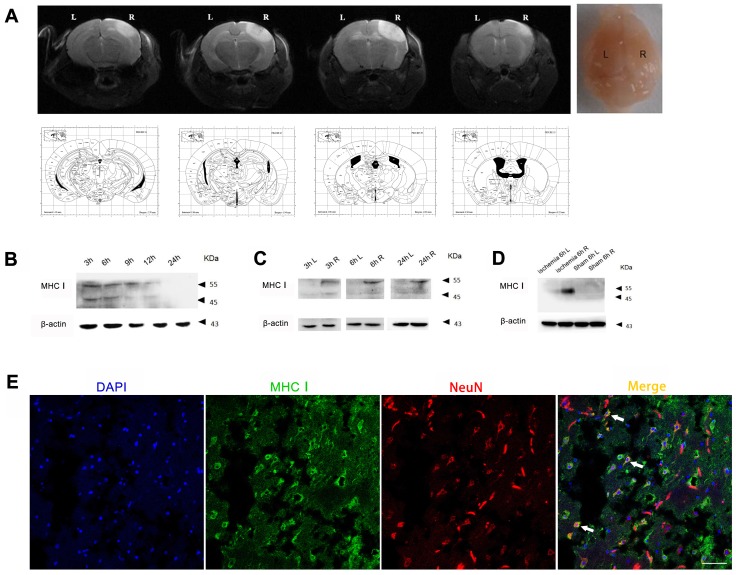
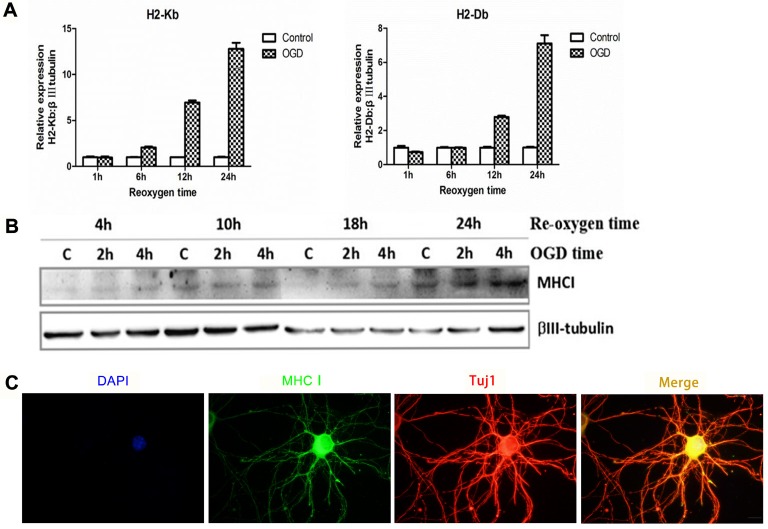
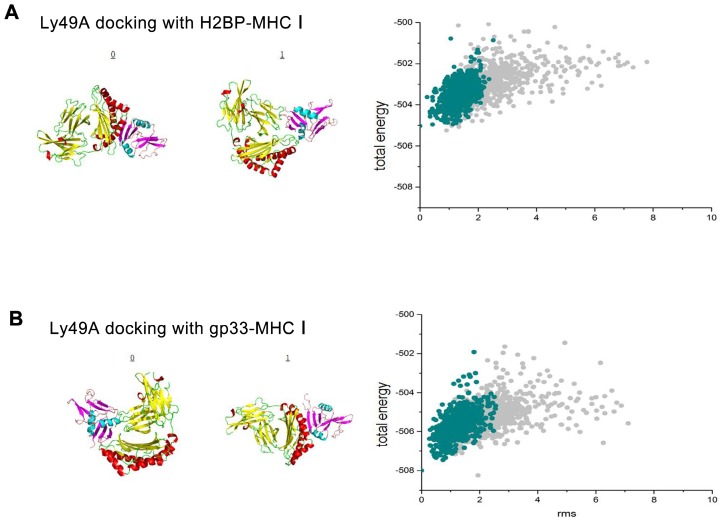
Ischemic stroke is one of the leading causes of morbidity and mortality worldwide. The expression of major histocompatibility complex class I (MHC-I) molecules in the central nervous system, which are silenced under normal physiological conditions, have been reported to be induced by injury stimulation. The purpose of this study was to determine whether MHC-I molecules could serve as molecular targets for the acute phase of ischemic stroke and to assess whether a high-affinity peptide specific for MHC-I molecules could be applied in the near-infrared imaging of cerebral ischemic mice. Quantitative real-time PCR and Western blotting were used to detect the expression of MHC-I molecules in two mouse models of cerebral ischemic stroke and an in vitro model of ischemia. The NetMHC 4.0 server was used to screen a high-affinity peptide specific for mouse MHC-I molecules. The Rosetta program was used to identify the specificity and affinity of the screened peptide (histocompatibility-2 binding peptide, H2BP). The results demonstrated that MHC-I molecules could serve as molecular targets for the acute phase of ischemic stroke. Cy5.5-H2BP molecular probes could be applied in the near-infrared imaging of cerebral ischemic mice. Research on the expression of MHC-I molecules in the acute phase after ischemia and MHC-I-targeted imaging may not only be helpful for understanding the mechanism of ischemic and hypoxic brain injury and repair but also has potential application value in the imaging of ischemic stroke.

Keywords: H2BP peptide; Ischemic stroke; MHC-I molecules; molecular imaging..


Conflict of interest statement

Competing Interests: The authors have declared that no competing interest exists.

Figures

Figure 1
Figure 1
MHC-I expression increases after MCAO. (A) Mouse MCAO model 24 h after ischemia-reperfusion. MRI-T2 imaging showing the changes in H2-Db and H2-Kb mRNA expression in the MCAO model 6 h and 24 h after ischemia-reperfusion. (B, C) Expression of the MHC-I protein in the mouse MCAO stroke model 6 h after ischemia-reperfusion (scale bar, 100 μm). (D, E) Expression of the MHC-I protein in the mouse MCAO stroke model 24 h after ischemia-reperfusion (scale bar, 100 μm).
Figure 2
Figure 2
MHC-I expression increases after photothrombotic stroke. (A) Mouse ischemia 24 h after photothrombotic stroke. MRI-T2 imaging. (B) Expression of the MHC-I protein in the cerebral ischemic cortex from 3-24 h after ischemia in the photothrombotic model. (C) The changes in MHCⅠprotein expression between the left and right cerebral cortex were measured at different time points. (D) The changes in MHC-I protein expression in the cerebral cortex of the photothrombotic experimental group and the sham-operated group 6 h after ischemia. (E) Brain tissue immunofluorescence staining showing MHC-I expression in NeuN-positive neurons 24 h after photothrombotic ischemia (scale bar, 50 μm).
Figure 3
Figure 3
Expression pattern of MHC-I molecules in the OGD primary cortical neuronal culture model in mice. (A) The mRNA expression trends for H2-Db and H2-Kb in the OGD culture model 1-24 h after hypoxia and reoxygenation. (B) The expression of MHC-I molecules after 2 h or 4 h of OGD, followed by reoxygenation for 4-24 h.(C) The results of immunofluorescence staining showing that the staining signals of the MHC-I molecules co-localized with the β-tubulin (Tuj1)-positive neurons 24 h after reoxygenation (scale bar, 10 μm).
Figure 4
Figure 4
The results of the rigid, flexible docking and scoring assessment of the H2BP-MHC-I complex or gp33-MHC-I complex to Ly49A using bioinformatics methods. (A) Cluspro 2.0 platform was used to generate the H2BP-MHC-I complex/gp33-MHC-I complex and Ly49A docking diagrams. (B) The total energy landscapes of the H2BP-MHC-I complex/gp33-MHC-I complex and Ly49A full atomic models, as generated using Rosetta.
Figure 5
Figure 5
In vitro assay showing the structure and binding of FITC-H2BP with MHC-I on the cell surface in mice. (A) Structure of the FITC-H2BP molecular probes. (B) Binding percentages of FITC-H2BP to C57BL/6 WT and C57BL/6 H-2Kb-/-Db-/- mouse spleen cells, as detected by flow cytometry. (C) Cellular immunofluorescence showing the imaging effect of the FITC-H2BP peptide and the C57BL/6 wild-type mouse cortical neuron OGD model (scale bar, 10 μm).
Figure 6
Figure 6
Fluorescence optical in vivo imaging of FITC-H2BP in the photothrombotic stroke mouse model. (A) The imaging results 24 h after ischemia. (B) Histogram of the tissue section. (C) Fluorescence signal detection in the brain tissue sections (scale bar, 100 μm).
Figure 7
Figure 7
Effect of the Cy5.5-H2BP probe on neuronal survival and in vitro spleen cell imaging. (A) The influence of the Cy5.5-H2BP NIRF imaging molecular probe on the survival of primary cultured cortical neurons. (B) Cy5.5-H2BP and (C) FITC-H2BP NIRF spleen cell imaging.
Figure 8
Figure 8
NIRF imaging of the Cy5.5-H2BP probe in the photothrombotic stroke mice. (A) In vivo Cy5.5-H2BP imaging results in mice 1-24 h after cerebral ischemia. (B) The statistical results for the TBR signal at each time point was calculated for the Cy5.5-H2BP and Cy5.5-H2CP (control) probes from the NIRF images of the ischemic/contralateral hemispheres following in vivo imaging in mice. (C) T2-MR in vivo and in vitro imaging results and TBR numerical statistics for the brain tissue of mice injected with the Cy5.5-H2BP and Cy5.5-H2CP (control) probes 24 h after cerebral ischemia.(D) Intensity of the NIRF signals in the brain, heart, liver, spleen, lung and kidney. The data are represented as the mean±SEM, n=6, *P<0.05, **P<0.01, ***P<0.001. (E) Detection of the Cy5.5-H2BP probe and Cy5.5-H2CP probe in the ischemic brain sections. (Upper) MRI-T2 imaging of the probes injected into the mice 24 h after photothrombotic stroke. (Lower) Confocal scanning analysis of brain tissues sections from mice injected with the Cy5.5-H2BP probe and Cy5.5-H2CP probe (scale bar, 50 μm). C, P and I represent the ischemic core, peri-ischemic zone and intact zone, respectively.

References

    1. Cebrián C, Zucca FA, Mauri P, Steinbeck JA, Studer L, Scherzer CR. et al. MHC-I expression renders catecholaminergic neurons susceptible to T-cell-mediated degeneration. Nat Commun. 2014;5:3633. - PMC - PubMed
    1. Lv D, Shen Y, Peng Y, Liu J, Miao F, Zhang J. Neuronal MHC Class I Expression Is Regulated by Activity Driven Calcium Signaling. PLoS One. 2015;10:e0135223. - PMC - PubMed
    1. Lv D, Shi Q, Liu J, Zhang A, Miao F, He Y. et al. The similar expression pattern of MHC class I molecules in human and mouse cerebellar cortex. Neurochem Res. 2014;39:180–6. - PubMed
    1. Liu J, Shen Y, Li M, Shi Q, Zhang A, Miao F. et al. The expression pattern of classical MHC class I molecules in the development of mouse central nervous system. Neurochem Res. 2013;38:290–9. - PubMed
    1. Andreatta M, Nielsen M. Gapped sequence alignment using artificial neural networks: application to the MHC class I system. Bioinformatics. 2016;32:511–7. - PMC - PubMed

Publication types

MeSH terms

Substances