. 2017 Jul 8;7(11):2888-2899.
doi: 10.7150/thno.19425. eCollection 2017.

A Normalization-Free and Nonparametric Method Sharpens Large-Scale Transcriptome Analysis and Reveals Common Gene Alteration Patterns in Cancers

Affiliations

A Normalization-Free and Nonparametric Method Sharpens Large-Scale Transcriptome Analysis and Reveals Common Gene Alteration Patterns in Cancers

Qi-Gang Li et al. Theranostics. .

Abstract

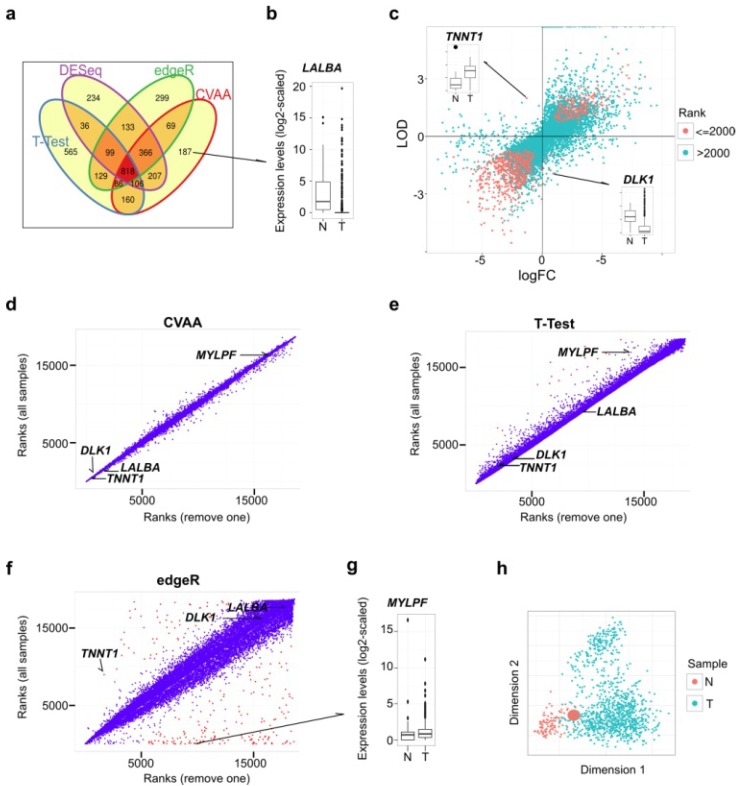
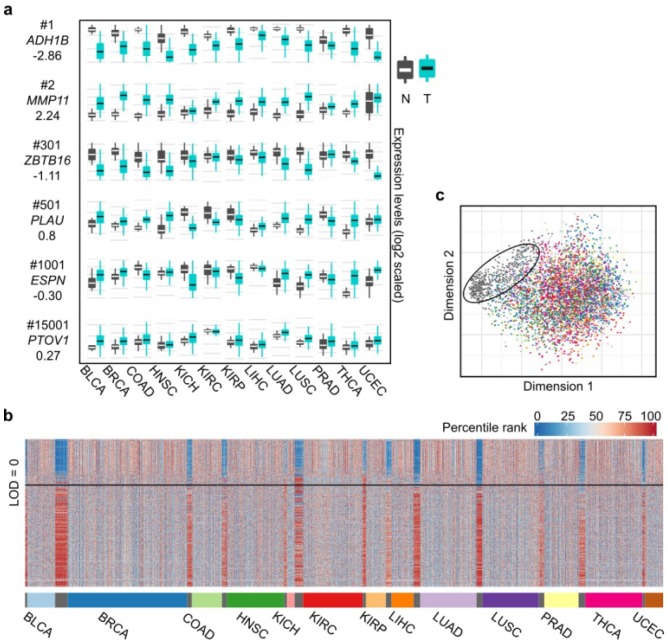
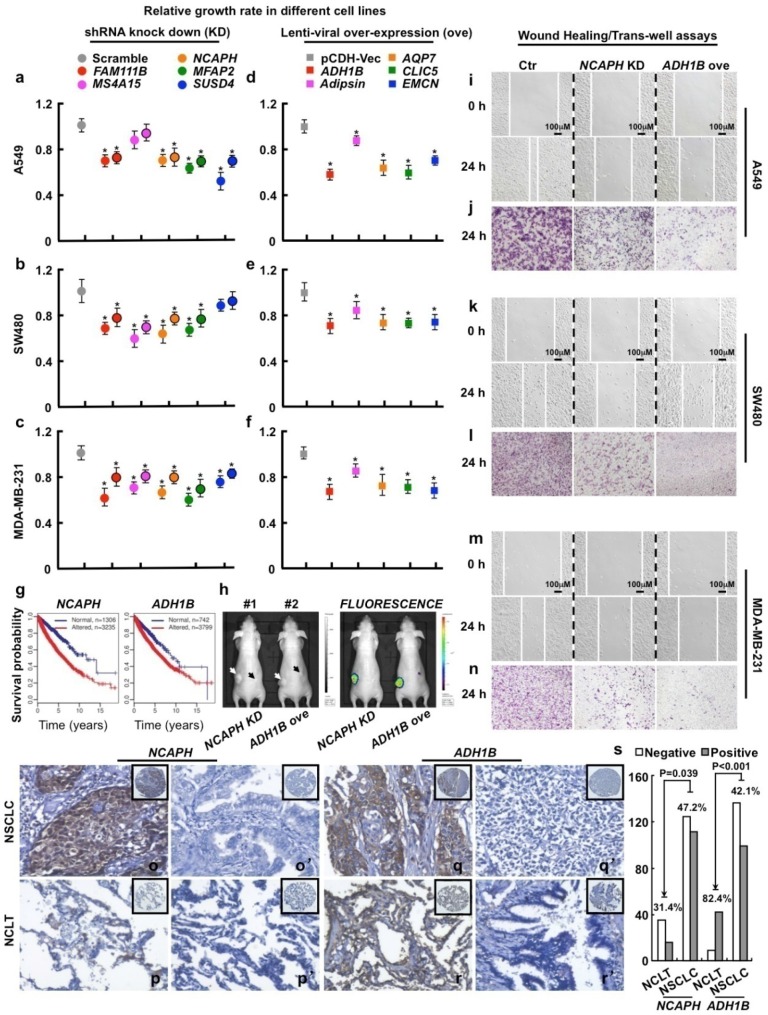
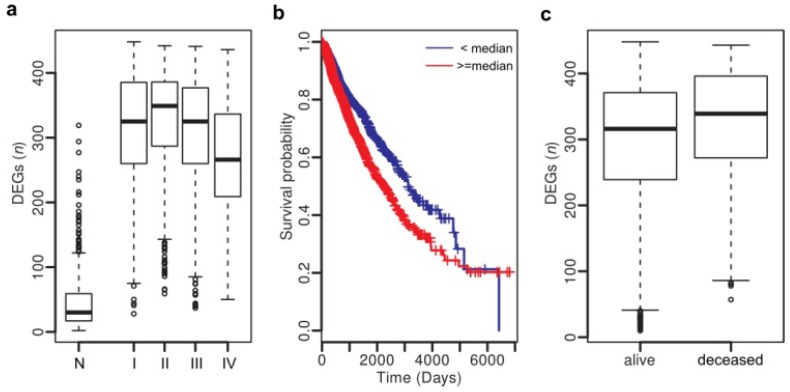
Heterogeneity in transcriptional data hampers the identification of differentially expressed genes (DEGs) and understanding of cancer, essentially because current methods rely on cross-sample normalization and/or distribution assumption-both sensitive to heterogeneous values. Here, we developed a new method, Cross-Value Association Analysis (CVAA), which overcomes the limitation and is more robust to heterogeneous data than the other methods. Applying CVAA to a more complex pan-cancer dataset containing 5,540 transcriptomes discovered numerous new DEGs and many previously rarely explored pathways/processes; some of them were validated, both in vitro and in vivo, to be crucial in tumorigenesis, e.g., alcohol metabolism (ADH1B), chromosome remodeling (NCAPH) and complement system (Adipsin). Together, we present a sharper tool to navigate large-scale expression data and gain new mechanistic insights into tumorigenesis.

Keywords: Cross-Value Association Analysis; heterogeneity.; normalization-free; pan-cancer; transcriptome.


Conflict of interest statement

Competing Interests: The authors have declared that no competing interest exists.

Figures

Figure 1
Figure 1
Comparisons among CVAA, T-Test, edgeR and DESeq in analyzing the same breast cancer data comprising 110 normal/noncancerous tissue (N) and 1,037 tumor samples (T). (a) Venn diagram of the top 2,000 DEGs generated by CVAA, T-Test, DESeq and edgeR, respectively. (b) Expression levels of LALBA gene in normal and tumor samples. LALBA severs as an example of the genes showing higher ranks in CVAA but lower in others (cf. Table S2). (c) Gene expression changes estimated by LODs (CVAA) and logFC (T-Test, edgeR and DESeq). LOD or logFC > 0 indicates up-regulation; LOD or logFC < 0 indicates down-regulation. The top 2,000 genes identified by CVAA are indicated by red dots. (d-f) Gene ranks before (Y-axis) and after (X-axis) removing the sample with the extreme value of TNNT1 in Figure 1c (Barcode: TCGA-GI-A2C8-11A-22R-A16F-07) by CVAA, T-Test and edgeR. Genes with ranking changes for more than 5,000 are indicated by red dots, indicating that these genes are very sensitive to the sample removal. (g) Expression levels of MYLPF gene between normal and tumor samples. MYLPF serves as an example of the genes showing a higher rank in CVAA but smaller in other above-mentioned methods. (h) Multidimensional scaling analysis of all samples considered here, the enlarged red dot indicates the removed sample.
Figure 2
Figure 2
Differential expression spectra between tumors and normal tissues across the 13 cancer types. (a) Expression boxplot of selected genes ranked by the CVAA. Each row in the first column indicates gene symbol, rank number and LOD value, respectively. Y axis of mRNA levels is log2 scaled. (b) Expression profile of the top 500 genes across the 13 cancer types. As tissue-varied gene expression, original expression values of each gene are percentile ranked (Methods) within each cancer type (color bar on the left top). (c) Multidimensional scaling shows relative similarity among all samples, with the circled dots indicating the normal tissues.
Figure 3
Figure 3
Functional study of 10 picked genes from the top 500 dysregulated ones in different tumor cell lines. (a-c) 3 up-regulated genes (FAM111B, NCAPH and MFAP2) and 2 cancer-specifically dysregulated genes (MS4A15 and SUSD4) were inhibited by 2 independent shRNAs targeting to different mRNA regions (indicated by different colors with or without black circle), respectively. Here, representative day 4 cell numbers normalized to scramble shRNA cells (considered as 1) were shown, *P < 0.05. (d-f) 5 down-regulated genes (ADH1B, Adipsin, AQP7, CLIC5 and EMCN) were over-expressed, respectively. The cell numbers were counted and normalized to pCDH-Vec control cells (considered as 1), *P < 0.05. (g) Survival curves of ADH1B and NCAPH across cancer types (NCAPH, P = 2.22e-16; ADH1B, P = 6.75e-06). Normal/altered: a gene is expressed in the normal/altered levels in a sample (see Methods). (h, left) Representative photographs captured with visible light of the animals corresponding to each treatment group at day 28th after A549-luc cell injection. White arrow (#1 mouse) indicates scramble shRNA control, dark arrow (#1 mouse) indicates NCAPH KD; white arrow (#2 mouse) indicates pCDH-Vec control, dark arrow (#2 mouse) indicates ADH1B ove; total 2×10⁶ cells for each line were injected. (h, right) Representative whole body fluorescence imaging showing a significant reduction in tumor size when NCAPH was depleted or ADH1B was over-expressed. (i, k, m) Representative wound healing assay using indicated cancer cell lines at 0 or 24 hours, respectively. (j, l, n) Representative trans-well cell migration assay using indicated cell lines at 24 hours. (o-r') IHC, DAB staining, 200X. (o-o', q-q') The positive and negative expression patterns of NCAPH or ADH1B protein, respectively, were shown in the NSCLC (p-p', r-r') The positive and negative expression patterns of NCAPH or ADH1B protein, respectively, were shown in the NCLT. (s) Quantification data for IHC. All the experiments were repeated at least 3 times, representative images were shown.
Figure 4
Figure 4
Clinical association analysis across cancer types. (a) Number of DEGs in normal tissues and tumors at stages I - IV. (b) Patients with more DEGs (> 320) show poor survival. (c) Deceased patients have more DEGs than the livings.

References

    1. Davoli T, Xu AW, Mengwasser KE, Sack LM, Yoon JC, Park PJ. et al. Cumulative haploinsufficiency and triplosensitivity drive aneuploidy patterns and shape the cancer genome. Cell. 2013;155:948–62. - PMC - PubMed
    1. Kandoth C, McLellan MD, Vandin F, Ye K, Niu B, Lu C. et al. Mutational landscape and significance across 12 major cancer types. Nature. 2013;502:333–9. - PMC - PubMed
    1. Zack TI, Schumacher SE, Carter SL, Cherniack AD, Saksena G, Tabak B. et al. Pan-cancer patterns of somatic copy number alteration. Nat Genet. 2013;45:1134–40. - PMC - PubMed
    1. Vogelstein B, Papadopoulos N, Velculescu VE, Zhou S, Diaz LA, Kinzler KW. Cancer Genome Landscapes. Science. 2013;339:1546–58. - PMC - PubMed
    1. Ramaswamy S, Ross KN, Lander ES, Golub TR. A molecular signature of metastasis in primary solid tumors. Nat Genet. 2003;33:49–54. - PubMed

Publication types

LinkOut - more resources