

Chromatin and Genomic determinants of alternative splicing
- PMID: 28825057
- PMCID: PMC5558438
- DOI: 10.1145/2808719.2808755
Chromatin and Genomic determinants of alternative splicing
Abstract
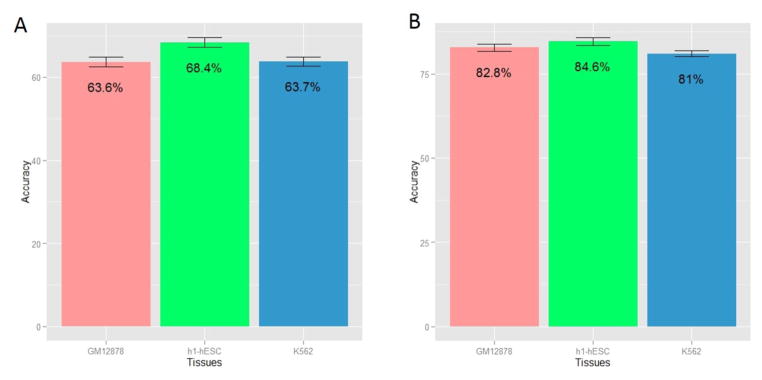
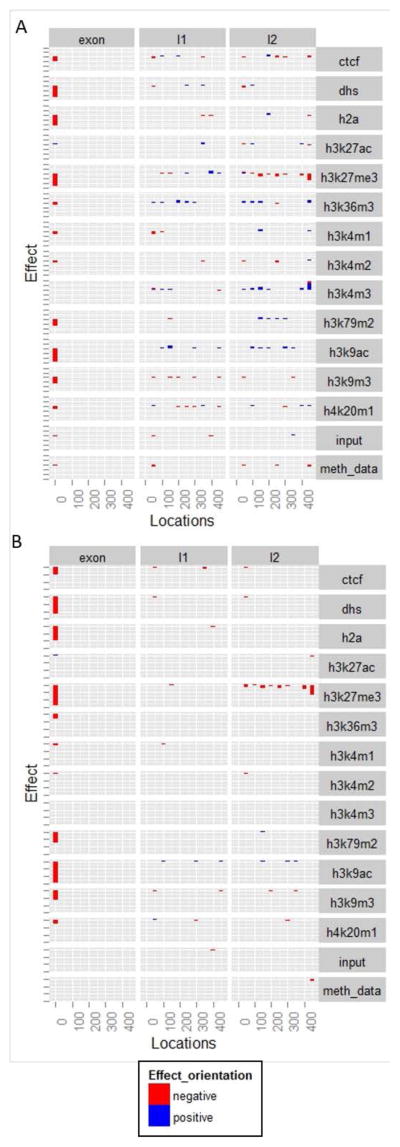
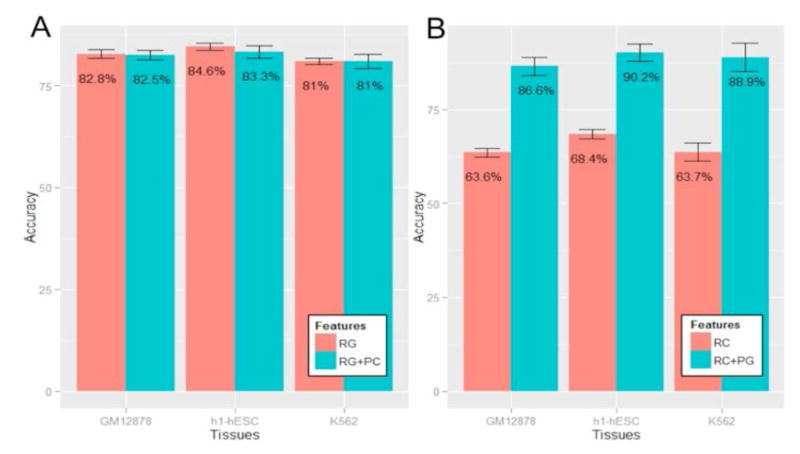
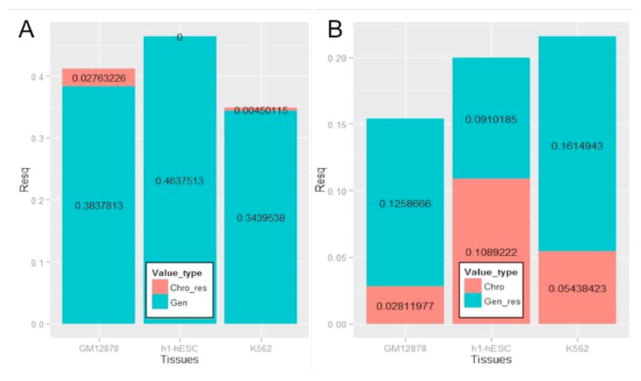
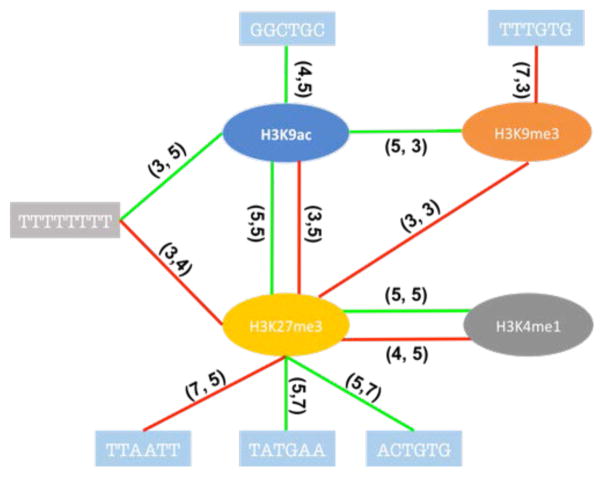
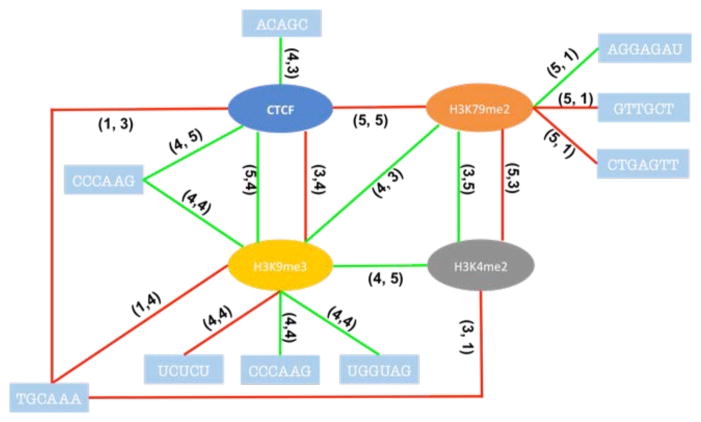
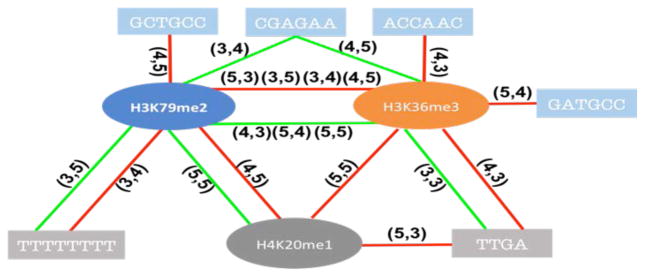
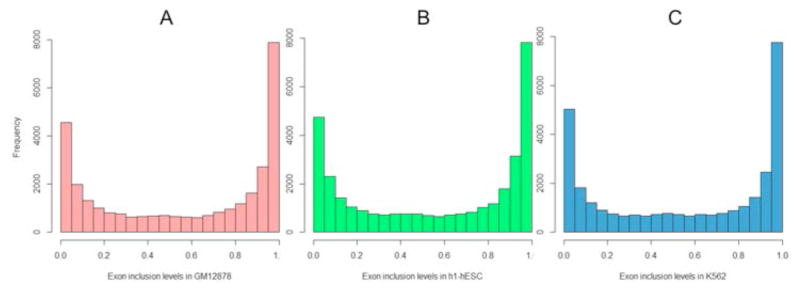
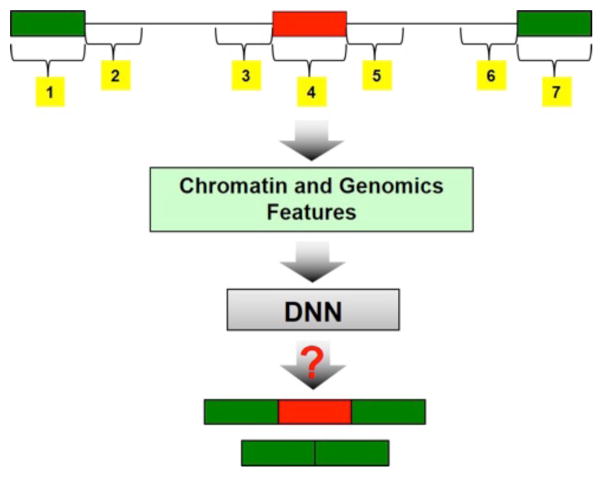
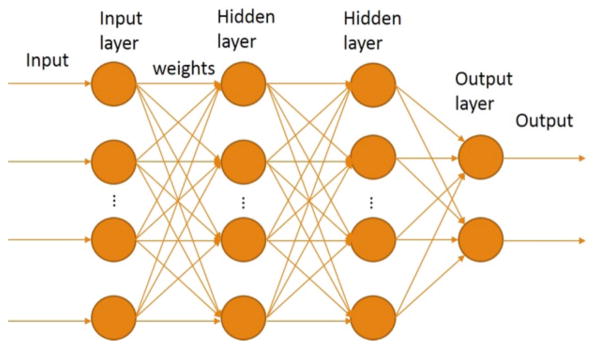
Alternative splicing significantly contributes to proteomic diversity and mis-regulation of splicing can cause diseases in human. Although both genomic and chromatin features have been shown to associate with splicing, the mechanisms by which various chromatin marks influence splicing is not clear for the most part. Moreover, it is not known whether the influence of specific genomic features on splicing is potentially modulated by the chromatin context. Here we report a deep neural network (DNN) model for predicting exon inclusion based on comprehensive genomic and chromatin features. Our analysis in three cell lines shows that, while both genomic and chromatin features can predict splicing to varying degrees, genomic features are the primary drivers of splicing, and the predictive power of chromatin features can largely be explained by their correlation with genomic features; chromatin features do not yield substantial independent contribution to splicing predictability. However, our model identified specific interactions between chromatin and genomic features suggesting that the effect of genomic elements may be modulated by chromatin context.
Keywords: Algorithms; Alternative splicing; Chromatin; Deep Neural Network; Exon skipping; Experimentation; Machine Learning; Measurement; Performance; Verification.
Figures
Similar articles
-
A chromatin code for alternative splicing involving a putative association between CTCF and HP1α proteins.BMC Biol. 2015 May 2;13:31. doi: 10.1186/s12915-015-0141-5. BMC Biol. 2015. PMID: 25934638 Free PMC article.
-
Connections between chromatin signatures and splicing.Wiley Interdiscip Rev RNA. 2013 Jan-Feb;4(1):77-91. doi: 10.1002/wrna.1142. Epub 2012 Oct 16. Wiley Interdiscip Rev RNA. 2013. PMID: 23074139 Review.
-
Chromatin and alternative splicing.Cold Spring Harb Symp Quant Biol. 2010;75:103-11. doi: 10.1101/sqb.2010.75.023. Epub 2011 Feb 2. Cold Spring Harb Symp Quant Biol. 2010. PMID: 21289049
-
Epigenome-based splicing prediction using a recurrent neural network.PLoS Comput Biol. 2020 Jun 25;16(6):e1008006. doi: 10.1371/journal.pcbi.1008006. eCollection 2020 Jun. PLoS Comput Biol. 2020. PMID: 32584815 Free PMC article.
-
Regulation of alternative splicing through coupling with transcription and chromatin structure.Annu Rev Biochem. 2015;84:165-98. doi: 10.1146/annurev-biochem-060614-034242. Annu Rev Biochem. 2015. PMID: 26034889 Review.
Cited by
-
Deep learning for computational biology.Mol Syst Biol. 2016 Jul 29;12(7):878. doi: 10.15252/msb.20156651. Mol Syst Biol. 2016. PMID: 27474269 Free PMC article. Review.
-
Characterization of bovine (Bos taurus) imprinted genes from genomic to amino acid attributes by data mining approaches.PLoS One. 2019 Jun 6;14(6):e0217813. doi: 10.1371/journal.pone.0217813. eCollection 2019. PLoS One. 2019. PMID: 31170205 Free PMC article.
-
Comprehensive map of age-associated splicing changes across human tissues and their contributions to age-associated diseases.Sci Rep. 2018 Jul 19;8(1):10929. doi: 10.1038/s41598-018-29086-2. Sci Rep. 2018. PMID: 30026530 Free PMC article.
References
-
- [Accessed: 28-Jan-2015];Molecular Biology of the Cell, 5th Edition: The Problems Book/Edition 5 by John Wilson | 9780815341109 | Paperback | Barnes & Noble. [Online]. Available: http://www.barnesandnoble.com/w/molecular-biology-of-the-cell-5th-editio....
-
- Eriksson M, Brown WT, Gordon LB, Glynn MW, Singer J, Scott L, Erdos MR, Robbins CM, Moses TY, Berglund P, Dutra A, Pak E, Durkin S, Csoka AB, Boehnke M, Glover TW, Collins FS. Recurrent de novo point mutations in lamin A cause Hutchinson-Gilford progeria syndrome. Nature. 2003 May;423(6937):293–8. - PMC - PubMed
Grants and funding
LinkOut - more resources
Full Text Sources
Other Literature Sources