. 2017 Oct;148(4):395-406.
doi: 10.1007/s00418-017-1604-2. Epub 2017 Aug 19.

Recapitulating in vivo-like plasticity of glioma cell invasion along blood vessels and in astrocyte-rich stroma

Affiliations

Recapitulating in vivo-like plasticity of glioma cell invasion along blood vessels and in astrocyte-rich stroma

Pavlo Gritsenko et al. Histochem Cell Biol. 2017 Oct.

Abstract

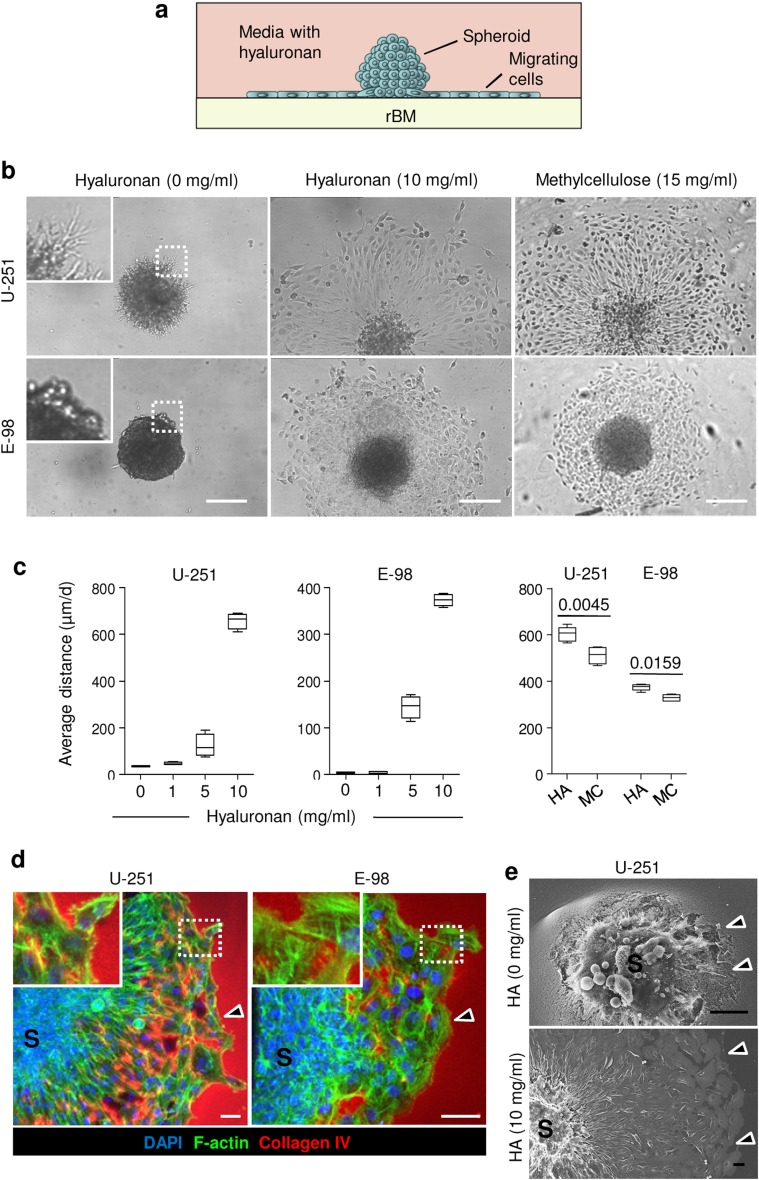
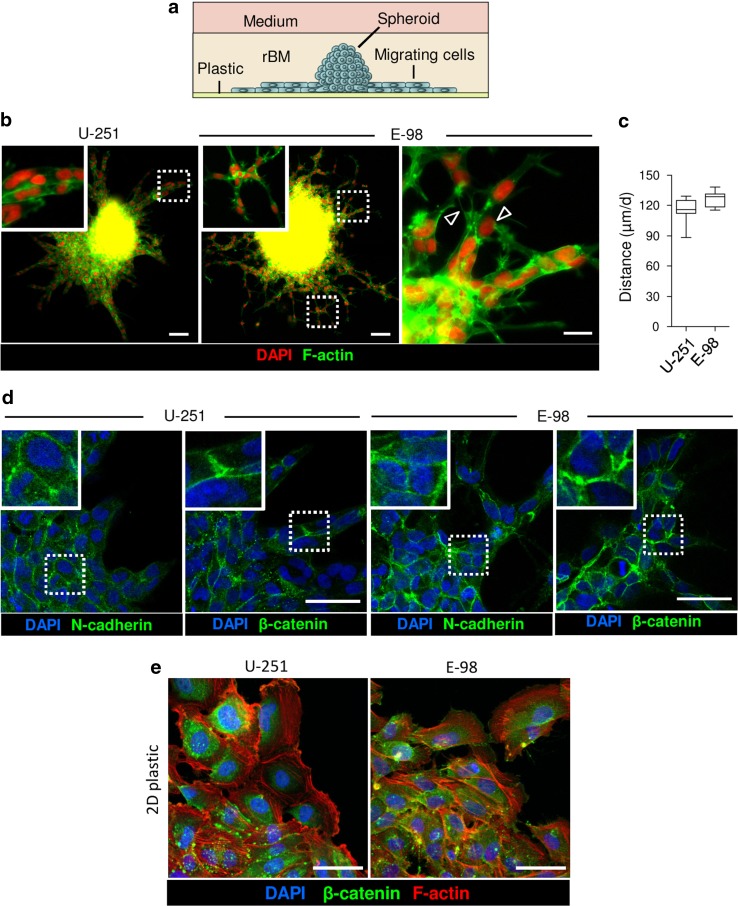
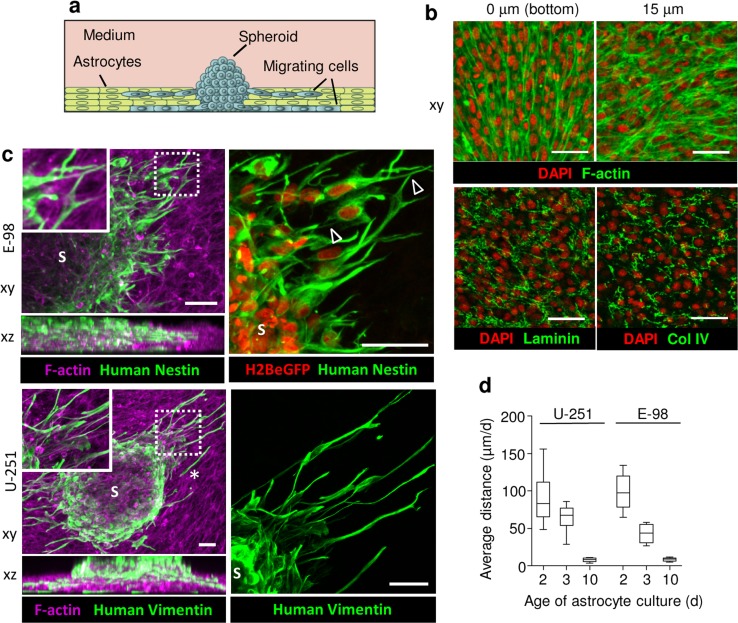
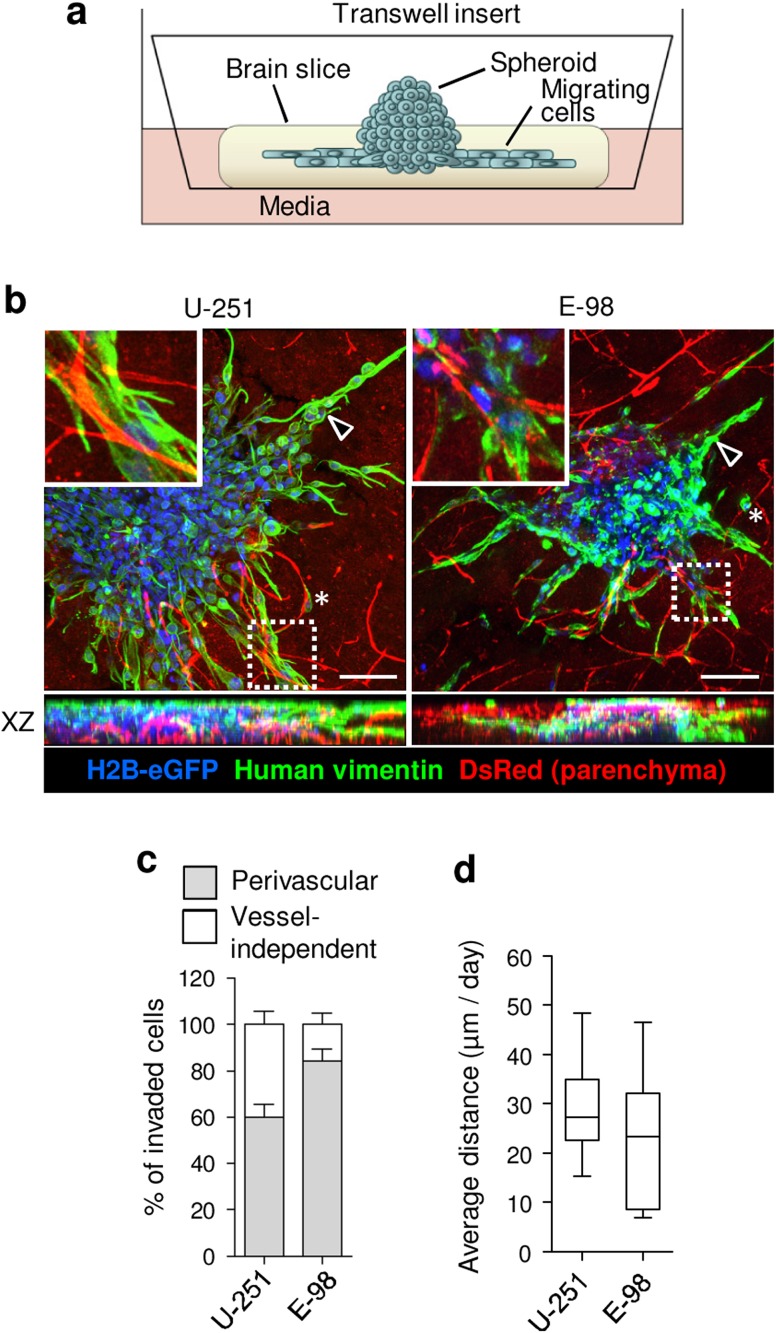
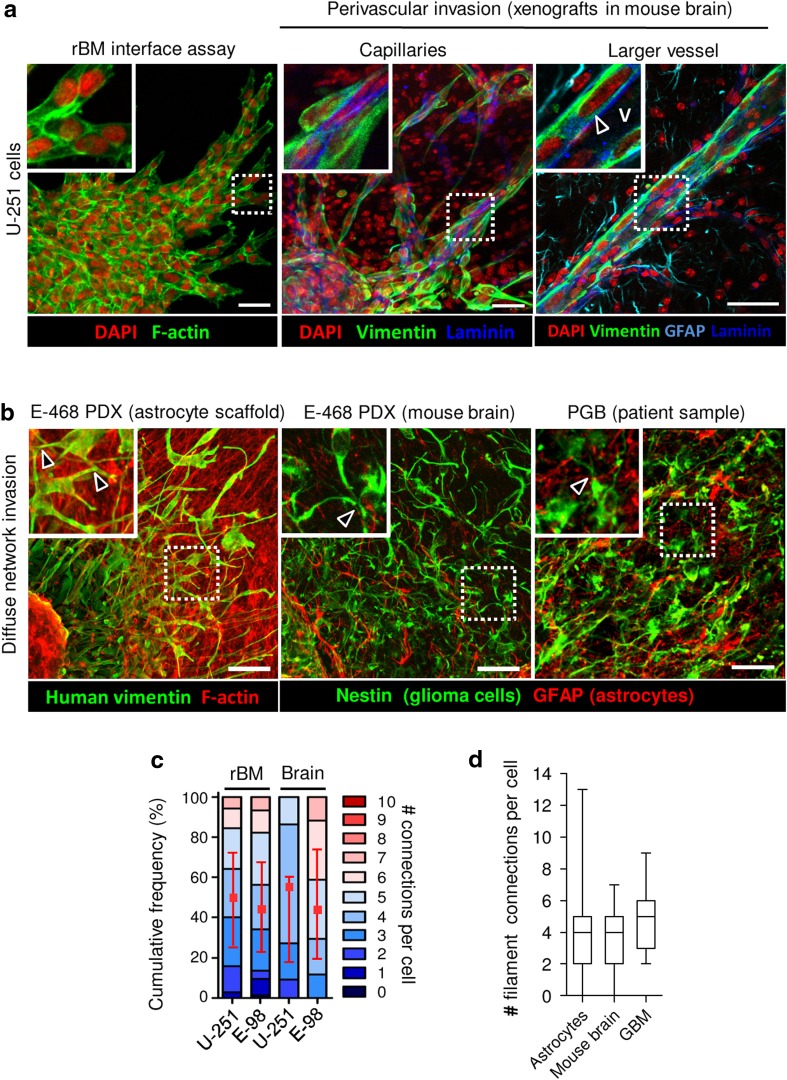
Diffuse invasion of glioma cells into the brain parenchyma leads to nonresectable brain tumors and poor prognosis of glioma disease. In vivo, glioma cells can adopt a range of invasion strategies and routes, by moving as single cells, collective strands and multicellular networks along perivascular, perineuronal and interstitial guidance cues. Current in vitro assays to probe glioma cell invasion, however, are limited in recapitulating the modes and adaptability of glioma invasion observed in brain parenchyma, including collective behaviours. To mimic in vivo-like glioma cell invasion in vitro, we here applied three tissue-inspired 3D environments combining multicellular glioma spheroids and reconstituted microanatomic features of vascular and interstitial brain structures. Radial migration from multicellular glioma spheroids of human cell lines and patient-derived xenograft cells was monitored using (1) reconstituted basement membrane/hyaluronan interfaces representing the space along brain vessels; (2) 3D scaffolds generated by multi-layered mouse astrocytes to reflect brain interstitium; and (3) freshly isolated mouse brain slice culture ex vivo. The invasion patterns in vitro were validated using histological analysis of brain sections from glioblastoma patients and glioma xenografts infiltrating the mouse brain. Each 3D assay recapitulated distinct aspects of major glioma invasion patterns identified in mouse xenografts and patient brain samples, including individually migrating cells, collective strands extending along blood vessels, and multicellular networks of interconnected glioma cells infiltrating the neuropil. In conjunction, these organotypic assays enable a range of invasion modes used by glioma cells and will be applicable for mechanistic analysis and targeting of glioma cell dissemination.

Keywords: Astrocyte scaffolds; Glioma invasion; Multicellular networks; Organotypic culture; Perivascular invasion.


Conflict of interest statement

The authors declare that they have no conflict of interest.

Figures

Fig. 1
Fig. 1
Reconstituted basement membrane/hyaluronan interface migration assay. a Assay design. b Radial migration of U-251 and E-98 cells from spheroids along the rBM–hyaluronan (HA) or methylcellulose (MC) interface after 1 day of culture, detected by bright-field microscopy. c Average distance migrated by U-251 and E-98 cells along the rBM/HA or rBM/MC interface at different concentration of HA or MC; values display medians (black line), 25/75 percentiles (boxes) and maximum/minimum (whiskers) from three independent experiments. p values, Mann–Whitney test. d 3D projection from confocal z-stack of U-251 and E-98 cell migration from multicellular spheroids (S) along rBM/HA interface (10 mg/ml HA concentration). Arrowheads indicate the invasion front. e Scanning electron microscopy of U-251 cells after 1 day of radial migration from spheroids (S) on rBM in media without or with HA (10 mg/ml). Arrowheads, invasion front with signs of degradation of rBM (HA, 0 mg/ml) or without rBM degradation (HA, 10 mg/ml). Scale bars 200 μm (b), 50 μm (d, e)
Fig. 2
Fig. 2
rBM-plastic interface migration assay. a Assay design. b Overviews of U-251 and E-98 cells after 2 days of radial migration from spheroids under rBM in neurobasal media. Arrowheads, focal cell–cell interactions. c Average migration distance of U-251 and E-98 cells under rBM. Values display median (black line), 25/75 percentiles (boxes) and maximum/minimum (whiskers) from three independent experiments. d Molecular topology of adherens junction proteins in U-251 and E-98 cells migrating under rBM. Images were obtained by epifluorescence (b) and confocal microscopy (d). e Maximum z-projection of U-251 and E-98 cells after 2 days of emigration from multicellular spheroids maintained on polystyrene surface coated with rBM. Scale bars 100 μm (b), 20 μm (zoomed insert b), 50 μm (d,e)
Fig. 3
Fig. 3
3D astrocyte scaffold invasion assay. a Assay design. b Confocal xy-sections of astrocyte culture (3 days) stained for F-actin, laminin and collagen type IV (Col IV). c 3D reconstruction (confocal z-stack, 90 μm, horizontal and orthogonal projections) of E-98 and U-251 cell invasion from spheroids (S) into 3-day old mouse astrocyte scaffolds. Glioma cells were identified by vimentin staining with human-specific antibody and constitutive expression of H2BeGFP in the nucleus, and murine astrocytes using phalloidin (F-actin). Arrowheads point to contacts between glioma cells via dendrite-like filaments. Asterisk, detached single cell. d Average migration distance of U-251 and E-98 cells invading astrocyte scaffolds matured for 2, 3 or 10 days before addition of glioma spheroids. Values display median (black line), 25/75 percentiles (boxes) and maximum/minimum (whiskers) from three independent experiments. Scale bars 50 μm
Fig. 4
Fig. 4
Organotypic mouse brain slice invasion assay. a Assay design. b 3D reconstruction (confocal z-stack, 90 μm, horizontal and orthogonal projections) of U-251 and E-98 cell migration from spheroids in mouse brain slices after 2 days of culture. Arrowheads indicate multicellular strands. Asterisks, detached single cells. Red signal originates from the DsRed mouse background, as contrast of vessels (bright signals) and stromal cells (dim signal). c Fractions of glioma cells associated with blood vessels, identified by vimentin staining with human-specific antibody. d Average distance of U-251 and E-98 cell migration in mouse brain slices. Values display median (black line), 25/75 percentiles (boxes) and maximum/minimum (whiskers) from three independent experiments. Scale bars 100 μm
Fig. 5
Fig. 5
Validation of in vitro assays by glioma invasion in murine and human brain in vivo. a 3D reconstruction of U-251 cell invasion along rBM-plastic interface in vitro compared to invasion pattern in the mouse brain 1 month after orthotopic implantation of U-251 cells. Glioma cells were identified using human-specific anti-vimentin, basement membranes with anti-laminin, and astrocytes and glia limitans perivascularis with anti-GFAP antibody. Arrowhead indicates glioma cells invading along basement membrane of a linear brain vessel under glia limitans. V–vessel lumen. In vivo images are projections from 100 μm-thick z-stacks. b E-468 patient-derived glioblastoma cells invading (2 days) 3D astrocyte scaffolds in vitro, or mouse brain 2 months after orthotopic implantation, compared with the peritumoral region of a primary glioblastoma (PGB) patient sample. Images represent 100 μm-thick z-stacks. Arrowheads denote contacts between glioma cells via dendrite-like filaments. Glioma cells were positive for vimentin (E-468) or nestin (E-468 and human sample), detected with human specific antibodies. Astrocytes were detected by anti-GFAP antibody. c Number of cell–cell junctions between U-251 and E-98 glioma cells in different assays, including collective strands under rBM compared to perivascular invasion in mouse brain. Values represent the number of cell contacts per glioma cell (colour code of stacked boxes) and their relative frequency in the population. The number of connected neighbour cells is indicated as median (red square), 25/75 percentiles (whiskers), representing three independent in vitro experiments and 2 mice per cell line in mouse brain. d Number of filaments connecting glioblastoma cells during astrocyte scaffold invasion compared with mouse brain tissue and primary glioblastoma lesion. Values display median (black line), 25/75 percentiles (boxes) and maximum/minimum (whiskers). Data represent three independent in vitro experiments; two E-468 xenografts in mouse brain, and four glioblastoma patients. Scale bars 50 μm

References

    1. Albini A, Iwamoto Y, Kleinman HK, et al. A rapid in vitro assay for quantitating the invasive potential of tumor cells. Cancer Res. 1987;47:3239–3245. - PubMed
    1. Alfi STP, Eguerinel CAL, Asset MIM. Invasion of human glioma biopsy specimens in cultures of rodent brain slices: a quantitative analysis. J Neurosurg. 2002;97:169–176. doi: 10.3171/jns.2002.97.1.0169. - DOI - PubMed
    1. Ananthanarayanan B, Kim Y, Kumar S. Elucidating the mechanobiology of malignant brain tumors using a brain matrix-mimetic hyaluronic acid hydrogel platform. Biomaterials. 2011;32:7913–7923. doi: 10.1016/j.biomaterials.2011.07.005. - DOI - PMC - PubMed
    1. Asano S, Ito S, Takahashi K, et al. Matrix stiffness regulates migration of human lung fibroblasts. Physiol Rep. 2017;5:e13281. doi: 10.14814/phy2.13281. - DOI - PMC - PubMed
    1. Assanah MC, Bruce JN, Suzuki SO, et al. PDGF stimulates the massive expansion of glial progenitors in the neonatal forebrain. Glia. 2009;57:1835–1847. doi: 10.1002/glia.20895. - DOI - PubMed

LinkOut - more resources