. 2017 Sep 1;127(9):3375-3391.
doi: 10.1172/JCI94292. Epub 2017 Aug 21.

Histone methyltransferase SETD2 modulates alternative splicing to inhibit intestinal tumorigenesis

Affiliations

Histone methyltransferase SETD2 modulates alternative splicing to inhibit intestinal tumorigenesis

Huairui Yuan et al. J Clin Invest. .

Abstract

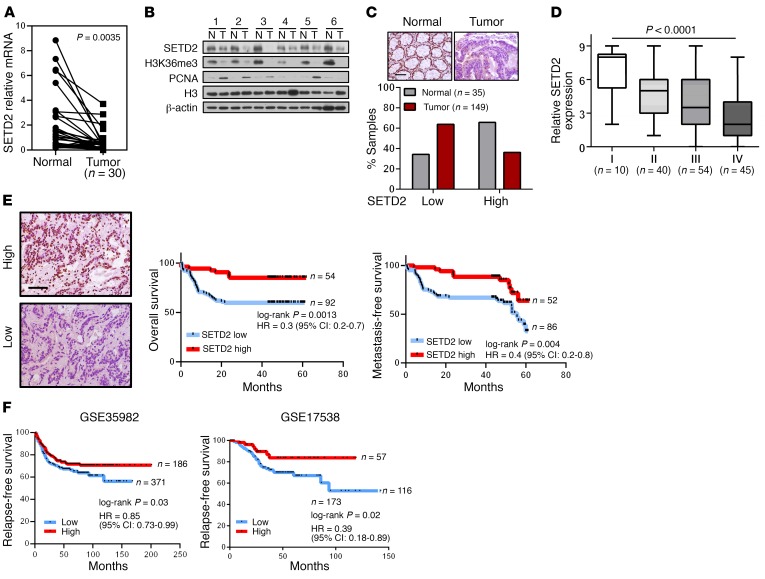
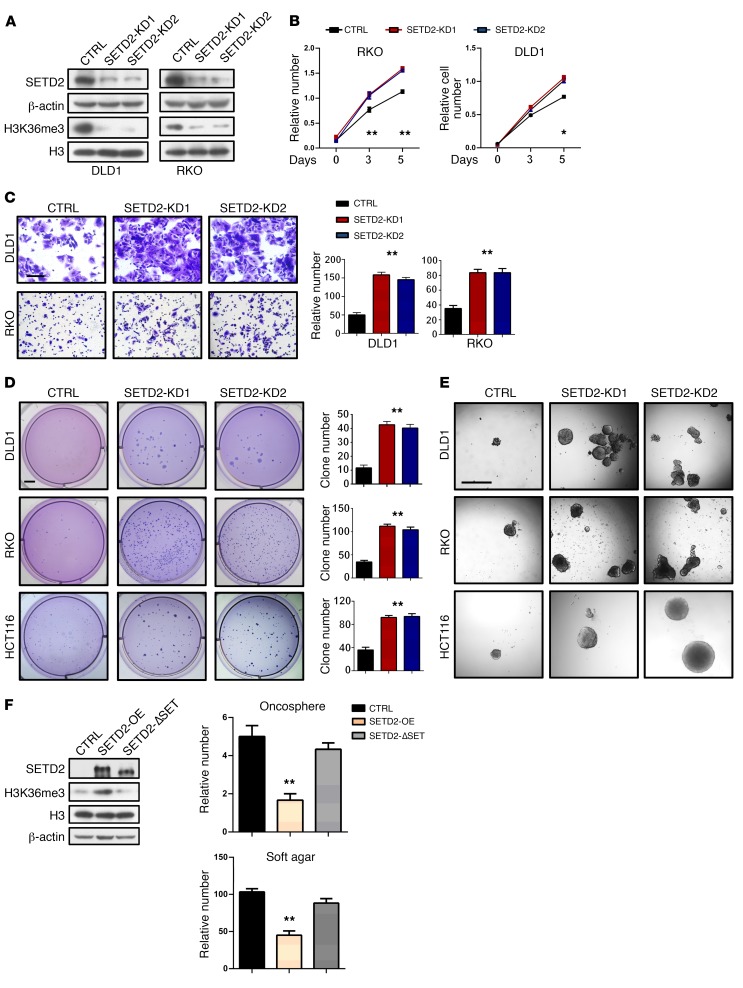
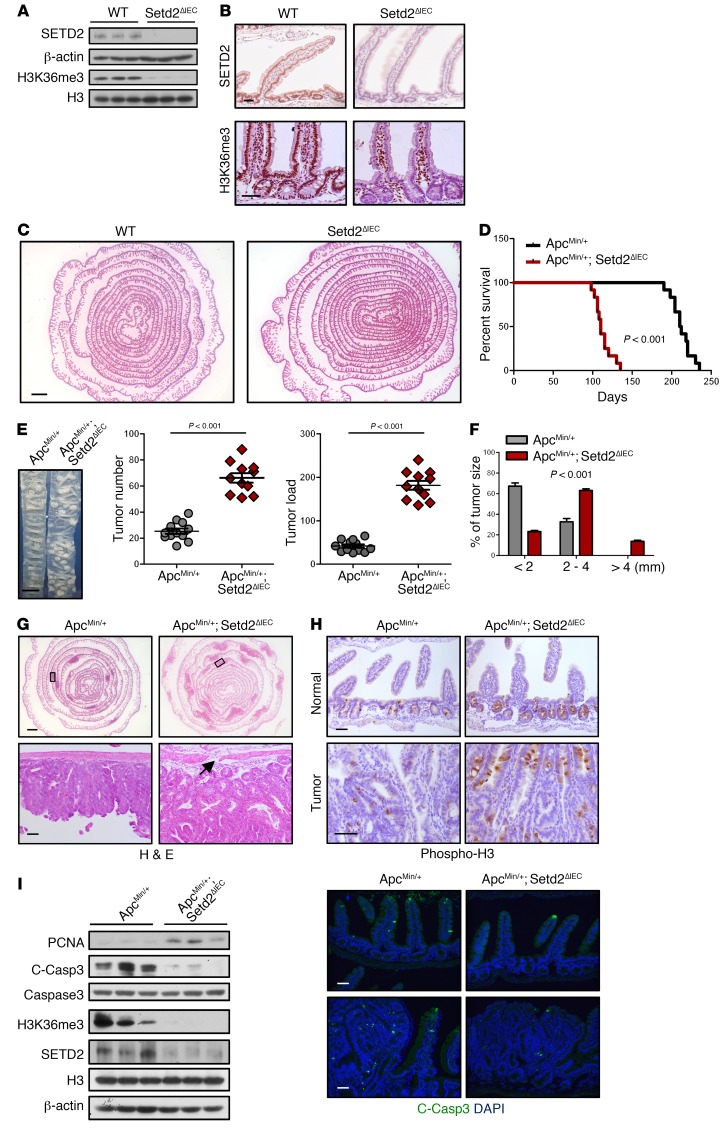
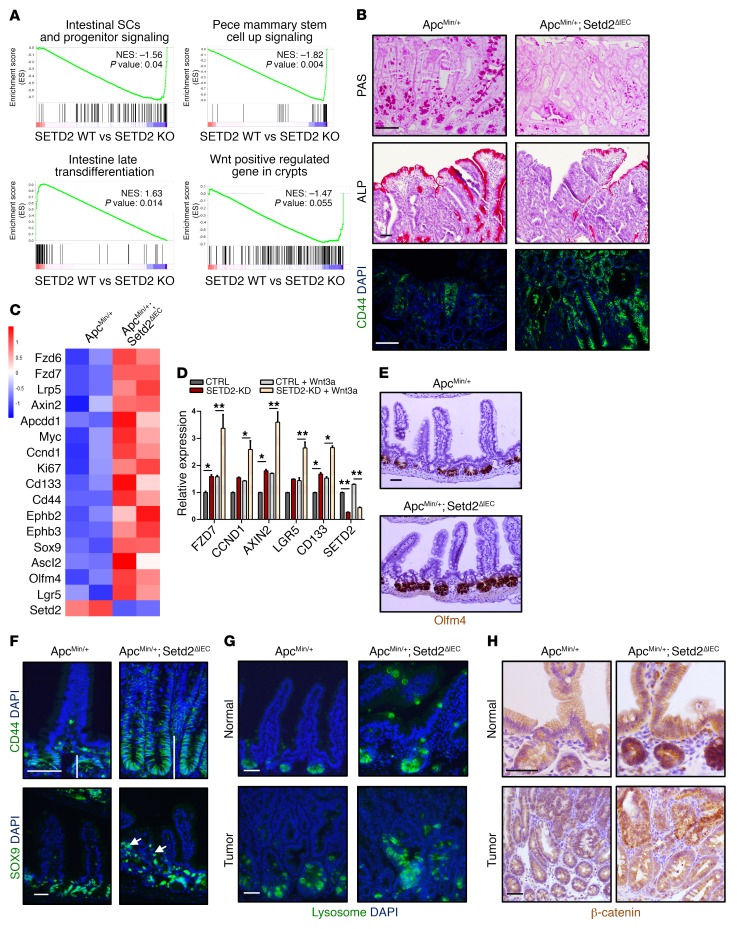
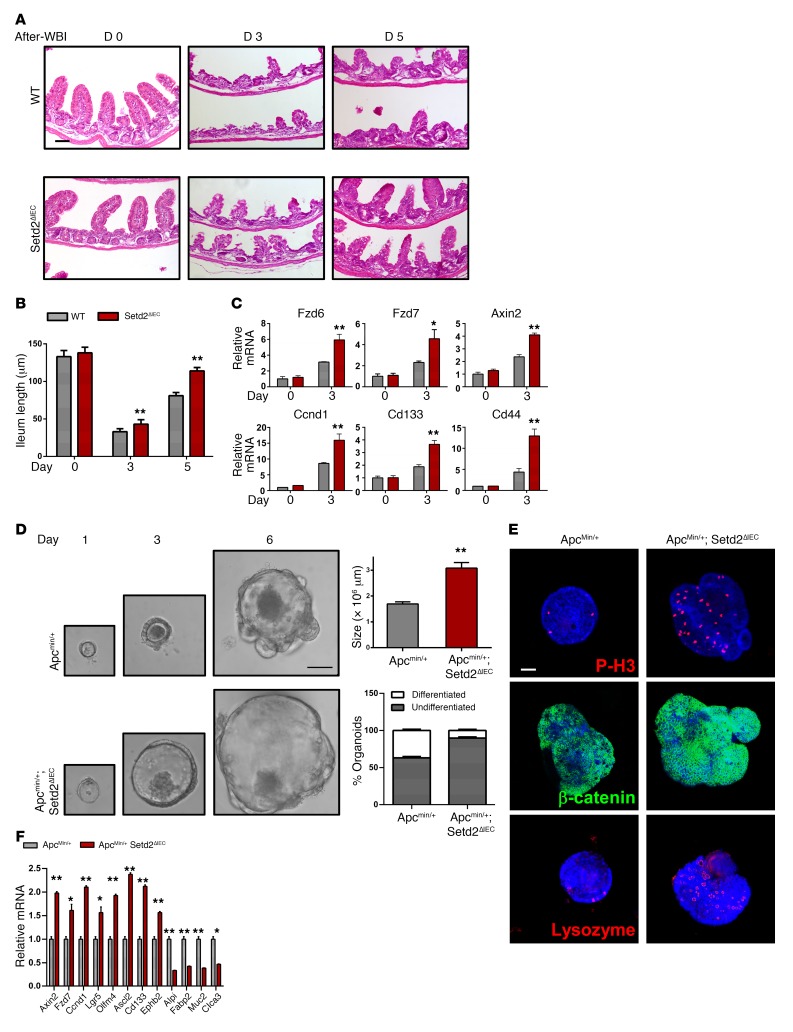
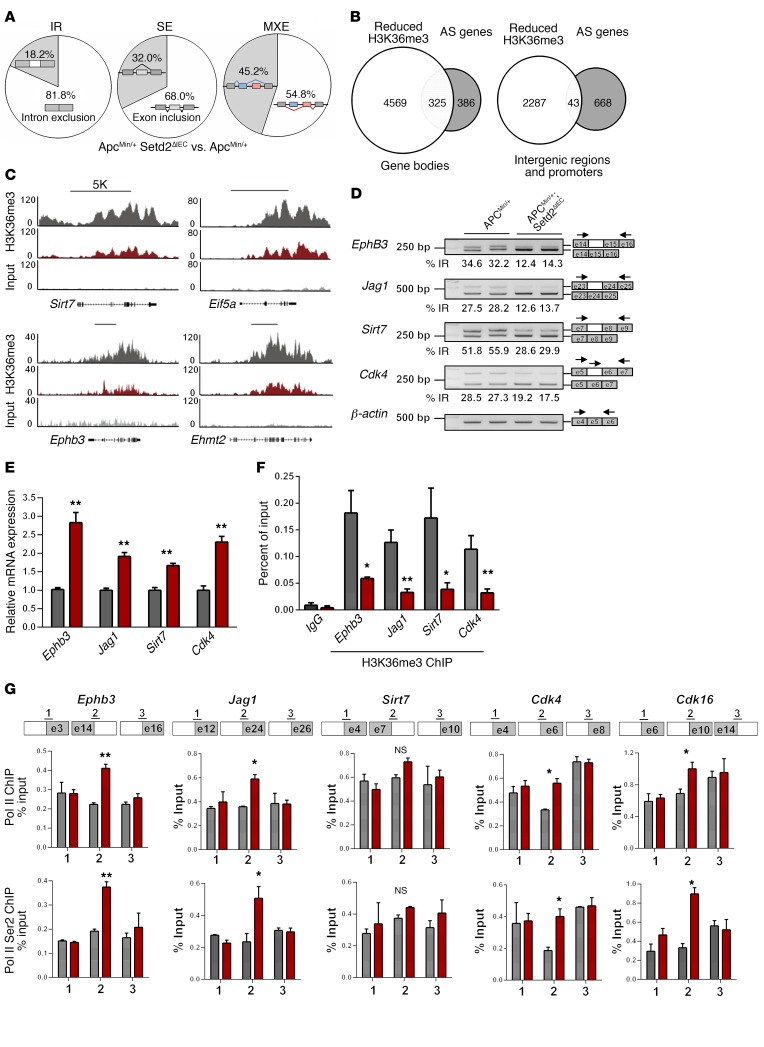
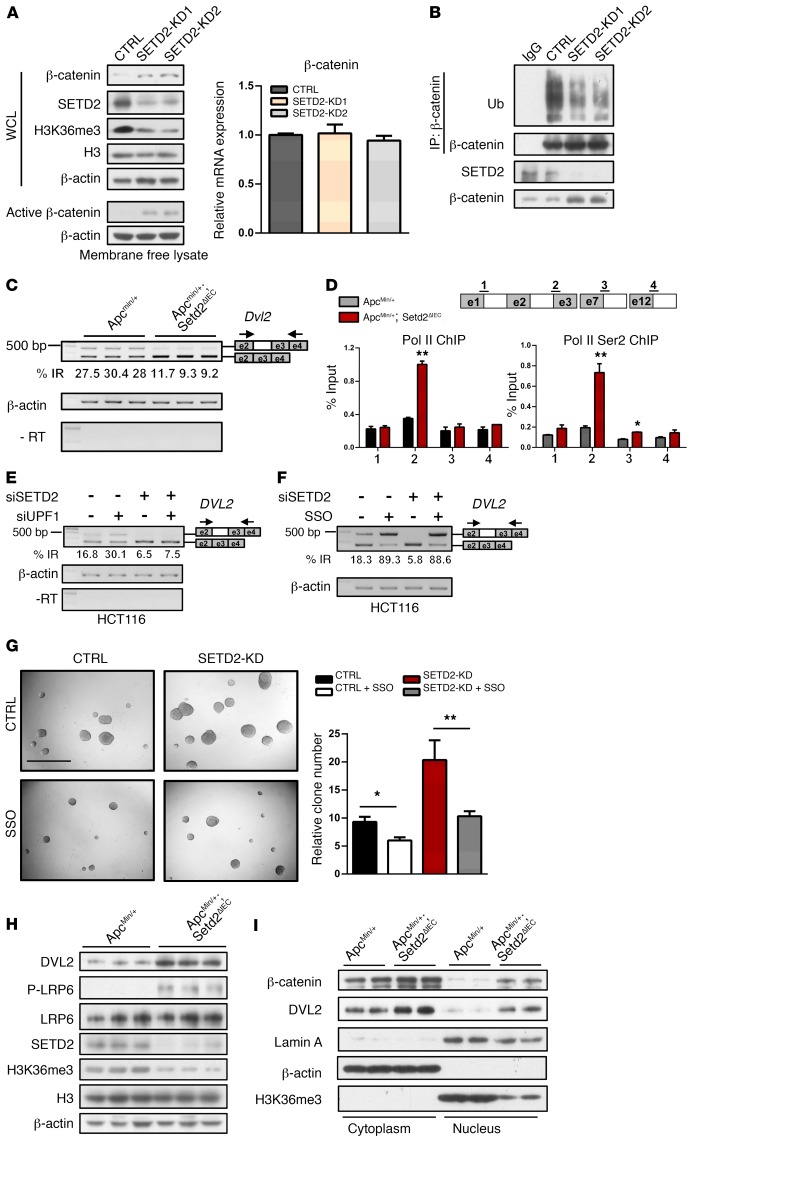
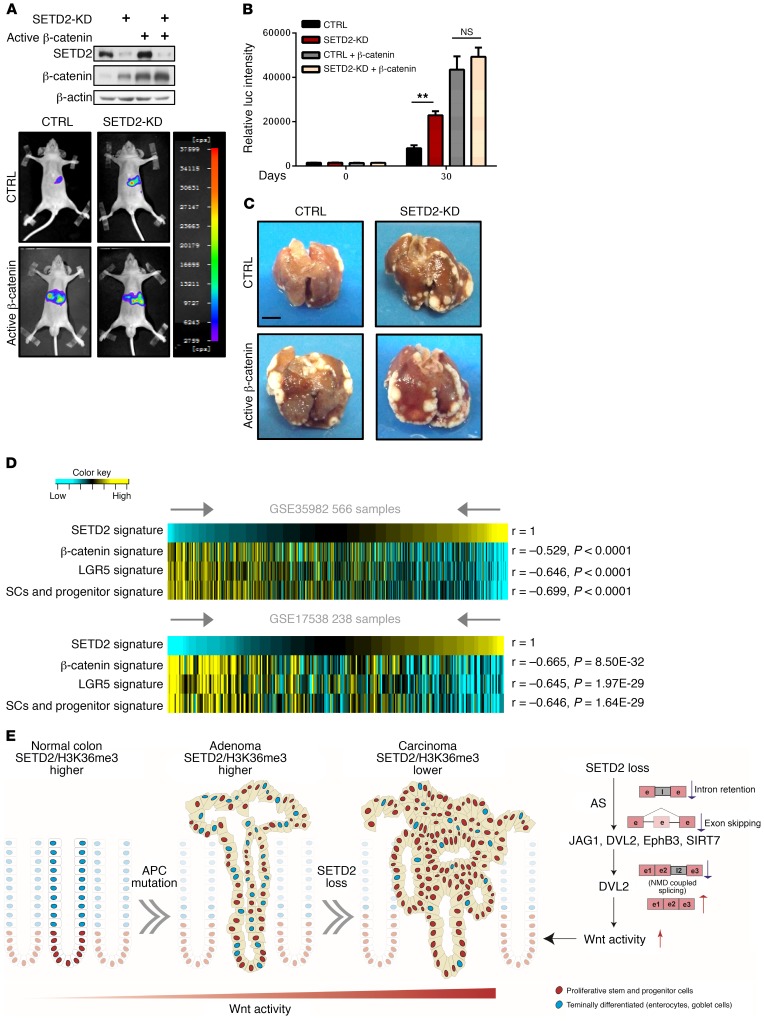
The histone H3K36 methyltransferase SETD2 is frequently mutated or deleted in a variety of human tumors. Nevertheless, the role of SETD2 loss in oncogenesis remains largely undefined. Here, we found that SETD2 counteracts Wnt signaling and its inactivation promotes intestinal tumorigenesis in mouse models of colorectal cancer (CRC). SETD2 was not required for intestinal homeostasis under steady state; however, upon irradiation, genetic inactivation of Setd2 in mouse intestinal epithelium facilitated the self-renewal of intestinal stem/progenitor cells as well as tissue regeneration. Furthermore, depletion of SETD2 enhanced the susceptibility to tumorigenesis in the context of dysregulated Wnt signaling. Mechanistic characterizations indicated that SETD2 downregulation affects the alternative splicing of a subset of genes implicated in tumorigenesis. Importantly, we uncovered that SETD2 ablation reduces intron retention of dishevelled segment polarity protein 2 (DVL2) pre-mRNA, which would otherwise be degraded by nonsense-mediated decay, thereby augmenting Wnt signaling. The signaling cascades mediated by SETD2 were further substantiated by a CRC patient cohort analysis. Together, our studies highlight SETD2 as an integral regulator of Wnt signaling through epigenetic regulation of RNA processing during tissue regeneration and tumorigenesis.


Conflict of interest statement

Conflict of interest: The authors have declared that no conflict of interest exists

Figures

Figure 1
Figure 1. Clinical relevance of SETD2 expression in human CRC.
(A) SETD2 mRNA levels in 30 matched tumor and paracarcinoma tissues (paired t test, P = 0.0035). (B) SETD2 and H3K36me3 protein levels in 6 pairs of random CRC samples. Blot images are derived from replicate samples run on parallel gels. N, adjacent normal specimens; T, matched tumor tissues. (C) Expression of SETD2 was assessed in tissue microarray. SETD2 staining indexes using a 10-point quantification scale in normal colon counterparts (n = 35) and tumors (n = 149) are shown (χ2 test, P = 0.0015). (D) Boxed plot of SETD2 expression assessed by blinded IHC analyses of TMA at different clinical stages (Kruskal-Wallis test). (E) Kaplan-Meier plot of overall survival and metastasis-free survival of patients based on SETD2 expression levels. A log-rank test was used for statistical analysis. (F) Kaplan-Meier survival curves for disease relapse–free stratified by SETD2 expression levels using GEO data sets GSE35982 and GSE17538 (P values by log-rank test). Scale bars: 50 μm.
Figure 2
Figure 2. SETD2 inhibits tumorigenesis in CRC cells.
(A) Western blotting analysis of the indicated proteins in control and SETD2 knockdown (SETD2-KD) cells. Blot images are derived from replicate samples run on parallel gels. (B and C) In vitro growth (B) and migration (C) of control (CTRL) and SETD2-depleted RKO and DLD1 cells. (D and E) Soft agar assays (D) and oncosphere formations (E) in parental and SETD2-KD cells. The quantitation results are shown in the right panels. (F) The levels of WT SETD2 or SETD2-ΔSet overexpression (left panel) and quantitation results of anchorage-independent growth and oncosphere formation (right panel) in HCT116 cells. Statistical comparisons in B–D, and F were made using a 2-tailed Student’s t test*P < 0.05; **P < 0.01. Scale bars: 400 mm (C); 5 mm (D); 1 mm (E).
Figure 3
Figure 3. Setd2 inactivation potentiates tumor malignance in an Apcmin/+ mice model.
(A and B) Western blot (A) and immunohistochemical staining (B) of the indicated proteins in small intestines of WT and Setd2ΔIEC mice. (C) H&E staining of representative Swiss roll of small intestines of 10-month-old mice. (D) Kaplan-Meier survival plots of Apcmin/+ and Apcmin/+; Setd2ΔIEC mice as indicated (n = 12) (log-rank test). (E) Macroscopic image, tumor number, and tumor load from the small intestines of 14-week-old mice as indicated (n = 12); 2-tailed Student’s t test. (F) Histogram showing the size distribution of tumors from 14-week-old mice as indicated (n = 11; χ2 test). (G and H) H&E images (G) and phospho-H3, cleaved caspase 3 staining (H) of the representative small intestines from 14-week-old Apcmin/+ and Apcmin/+; Setd2ΔIEC mice. Arrowhead denotes the discontinuous muscle layer due to the invasion of tumor cells. (I) Western blot of the indicated protein from small intestine lysates. Blot images are derived from replicate samples run on parallel gels. Scale bars: 50 μm (B, G, H, lower panel); 1 mm (C, G, upper panels); 1 cm (E).
Figure 4
Figure 4. SETD2 loss stimulates Wnt-induced transformation and stemness programs.
(A) GSEA enrichment plots of differentially expressed genes belonging to stem/progenitor, differentiation, and Wnt signaling associated with SETD2 downregulation. (B) PAS, ALP, and CD44 staining in intestinal tumors from 14-week-old Apcmin/+ and Apcmin/+; Setd2ΔIEC mice. (C) Heat map summarizing the RT-qPCR results comparing the expression of Wnt target genes in the intestine from 14-week-old mice as indicated. (D) RT-qPCR analysis of Wnt target genes in control and SETD2-knockdown HCT116 cells treated with Wnt3a. Statistical comparisons were made using a 2-tailed Student’s t test. (E and F) In situ hybridization of stem cells with Olfm4+ (E) and immunostaining of the progenitor cells (CD44 and SOX9 positive) (F) from intestine sections as indicated. (G and H) Staining of lysosome and β-catenin in the adjacent normal and tumor parts of intestine sections as indicated. Scale bars: 50 μm. *P < 0.05; **P < 0.01.
Figure 5
Figure 5. SETD2 depletion promotes intestinal regeneration and self-renewal.
(A) H&E staining of small intestinal sections 3 and 5 days after WBI (10 Gy). (B) The lengths of villus were quantitated in at least 6 fields of small intestinal sections from WT and Setd2ΔIEC mice (n = 9). (C) Gene expression analysis of small intestine during regeneration (days 0 and 3), as indicated. (D) Organoid morphology (left) and quantification of size or differentiation after 6 days of culture (right). Size differences were calculated by Student’s t test, and differentiation was measured by sprouting per organoid (Fisher’s exact test, P < 0.001). (E and F) Phospho-H3, β-catenin, and lysozyme whole-mount staining (E) and gene expression analysis (F) of organoid derived from Apcmin/+ and Apcmin/+; Setd2ΔIEC mice (n > 4). Statistical comparisons in B, C, and F were made using a 2-tailed Student’s t test. *P < 0.05; **P < 0.01. Scale bars: 50 μm (A); 400 μm (D and E).
Figure 6
Figure 6. SETD2 regulates cancer-associated AS in Apcmin/+ mice.
(A) Pie graph summary of AS in SETD2 KO mice versus control mice. (B) Venn diagram indicates that altered AS genes (gray) preferably exhibited the decrease of H3K36me3 codes within gene bodies in comparison with the promoter and intergenic regions (P < 0.001; χ2 test). (C) Snapshot of H3K36me3 ChIP-Seq signal at the represented gene locus in control and Setd2-knockout mice. (D and E) Knockout of Setd2 in intestinal epithelium causes a decrease of IR (D) and an increase of mRNA levels of the indicated genes (E). Primers for examinations of IR are indicated by the arrows. (F) H3K36me3 codes in the areas of IR-related genes in the IECs of Apcmin/+ and Apcmin/+; Setd2ΔIEC mice. (G) ChIP-qPCR analysis of total Pol II and Ser2-phosphorylated Pol II enrichments in the IR gene locus, as indicated by number in control and SETD2-deficient Apc-mutated IECs. Statistical comparisons in EG were made using a 2-tailed Student’s t test. *P < 0.05; **P < 0.01.
Figure 7
Figure 7. SETD2 counteracts Wnt/β-catenin pathway through regulation of NMD-coupled splicing of DVL2 pre-mRNA.
(A) Western blotting analysis (left) and RT-qPCR analysis (right) of the indicated genes in control and SETD2-knockdown HCT116 cells. Cytomembrane-free lysate was used to examine active β-catenin. (B) Western blotting analysis of the indicated protein and immunoprecipitates derived from HCT116 cells. Blot images are derived from replicate samples run on parallel gels. (C) RT-PCR analysis of Dvl2 splicing patterns in IECs as indicated. Upper band: intron-retained transcripts. The average percentages of IR are shown. (D) ChIP-qPCR analysis of Pol II and Ser2-phosphorylated Pol II enrichments in the Dvl2 gene locus, as indicated by number in control and SETD2-deficient Apc-mutated IECs. (E) RT-PCR analysis of DVL2 splicing patterns in control and SETD2-knockdown HCT116 cells with or without UPF1 knockdown. (F and G) Control and SETD2-knockdown HCT116 cells transfected with control or SSO. SSO oligonucleotide target against 3′ splicing site of intron 2 of DVL2. (F) RT–PCR analysis of DVL2 mRNA and the average percentages of IR are shown. (G) Oncosphere formation of the cells as indicated. Quantitation results are shown in the right panel. *P < 0.05; **P < 0.01. (H) Western blot analysis of the small intestine lysates from Apcmin/+ and Apcmin/+; Setd2ΔIEC mice. (I) Examination of the indicated protein in cytoplasm and nucleus lysates from Apcmin/+ and Apcmin/+; Setd2ΔIEC mice. Primers used for examination of IR are indicated by arrows. Scale bars: 1 mm. Statistical comparisons in D and G were made using a 2-tailed Student’s t test
Figure 8
Figure 8. SETD2 loss aggravates Wnt/β-catenin–dependent CRC progression.
(A) Western blot analysis of the indicated protein (left) and the representative bioluminescence images for tumor metastasis to the liver in control and SETD2-KD HCT116 cells with or without active β-catenin overexpression (right panel). Blot images are derived from replicate samples run on parallel gels. (B) BLI quantitation of liver metastasis calculated by means ± SEM of bioluminescent signals is shown (n = 6); 2-tailed Student’s t test. **P < 0.01. (C) Macroscopic images of HCT116 metastasis to liver. (D) Correlations (by Pearson’s) between SETD2 signature, β-catenin signature, LGR5 signature, SCs, and progenitor signature within CRC specimens (GEO GSE35982 and GSE17538) are shown. Yellow, high-signature scoring; blue, low-signature scoring. (E) Model of SETD2 in colorectal tumorigenesis. SETD2 fine-tunes Wnt/β-catenin signaling to safeguard intestinal self-review and differentiation largely through modulation of IR and NMD of DVL2 pre-mRNA. Scale bars: 1 cm.

Comment in

References

    1. Baylin SB, Jones PA. A decade of exploring the cancer epigenome - biological and translational implications. Nat Rev Cancer. 2011;11(10):726–734. doi: 10.1038/nrc3130. - DOI - PMC - PubMed
    1. Mikkelsen TS, et al. Genome-wide maps of chromatin state in pluripotent and lineage-committed cells. Nature. 2007;448(7153):553–560. doi: 10.1038/nature06008. - DOI - PMC - PubMed
    1. Edmunds JW, Mahadevan LC, Clayton AL. Dynamic histone H3 methylation during gene induction: HYPB/Setd2 mediates all H3K36 trimethylation. EMBO J. 2008;27(2):406–420. doi: 10.1038/sj.emboj.7601967. - DOI - PMC - PubMed
    1. Hu M, et al. Histone H3 lysine 36 methyltransferase Hypb/Setd2 is required for embryonic vascular remodeling. Proc Natl Acad Sci U S A. 2010;107(7):2956–2961. doi: 10.1073/pnas.0915033107. - DOI - PMC - PubMed
    1. Wagner EJ, Carpenter PB. Understanding the language of Lys36 methylation at histone H3. Nat Rev Mol Cell Biol. 2012;13(2):115–126. doi: 10.1038/nrm3274. - DOI - PMC - PubMed

MeSH terms