. 2017 Sep 1;127(9):3287-3299.
doi: 10.1172/JCI92955. Epub 2017 Aug 21.

Prolonged human neural stem cell maturation supports recovery in injured rodent CNS

Affiliations

Prolonged human neural stem cell maturation supports recovery in injured rodent CNS

Paul Lu et al. J Clin Invest. .

Abstract

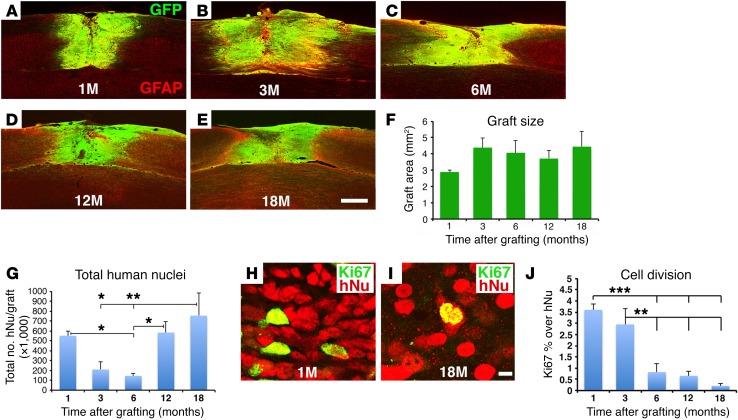
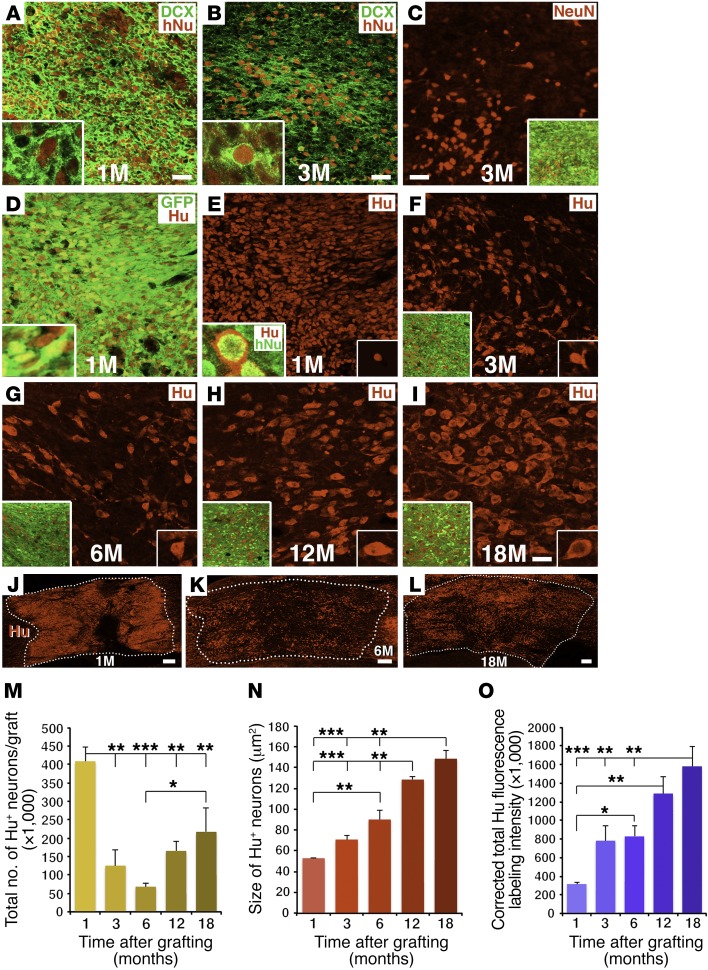
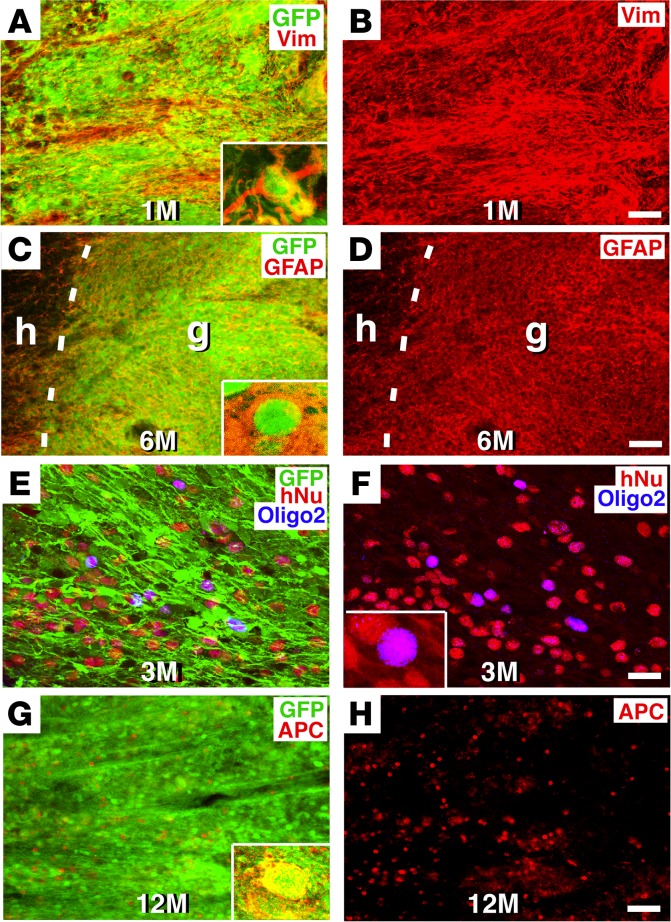
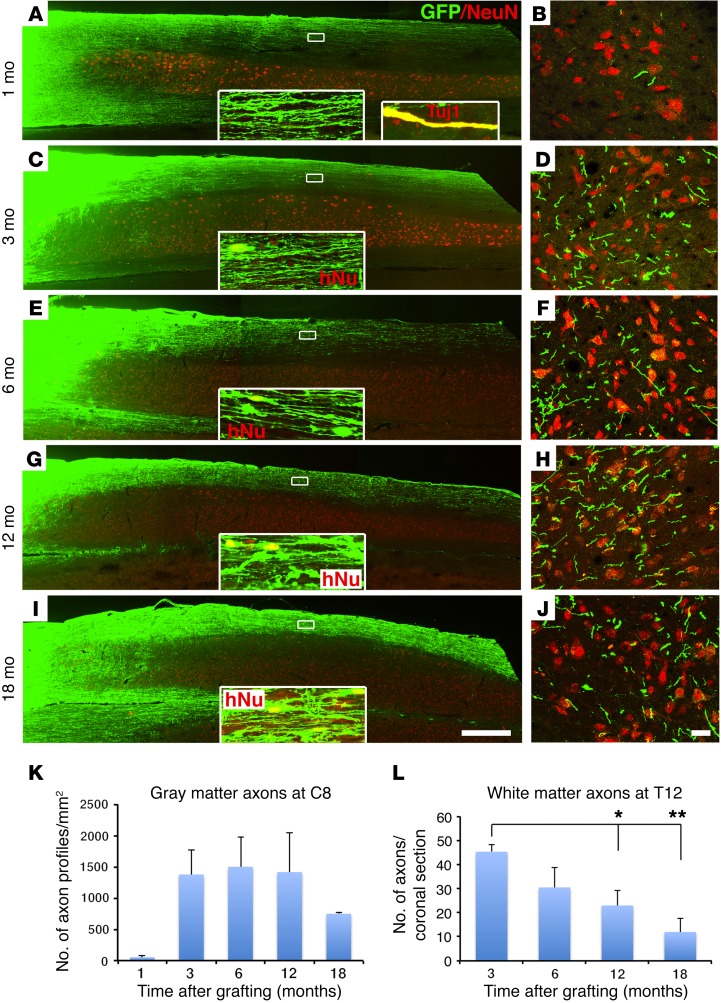
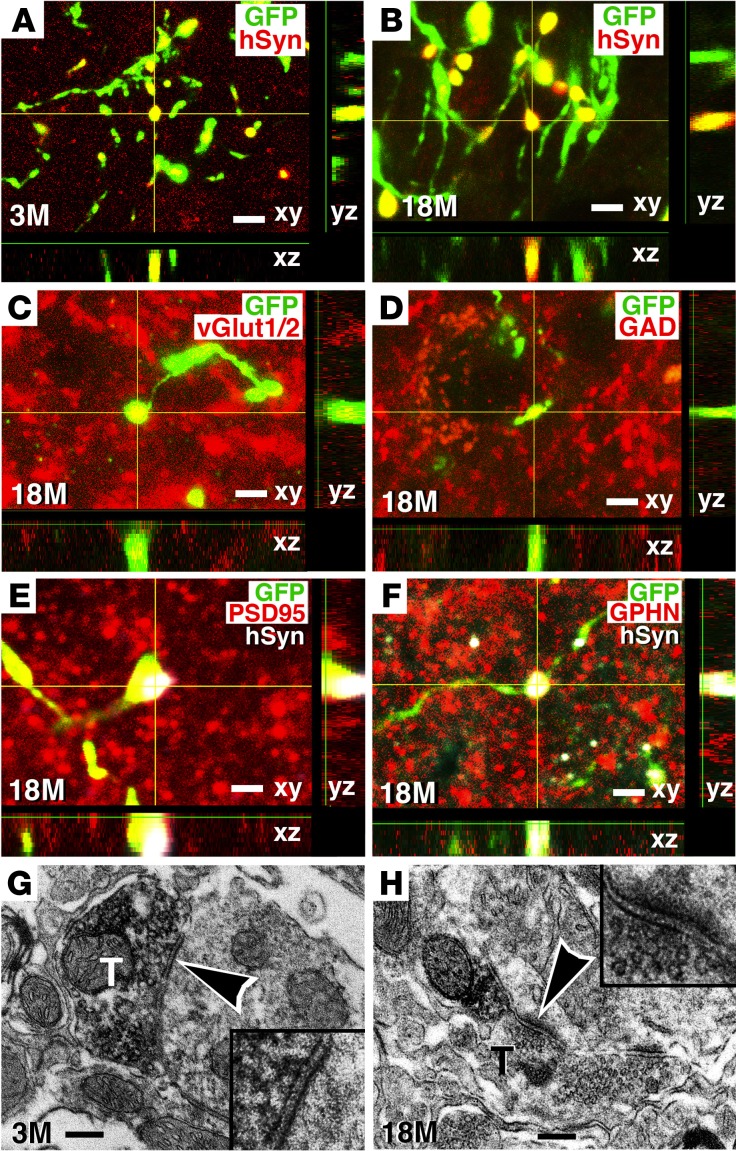
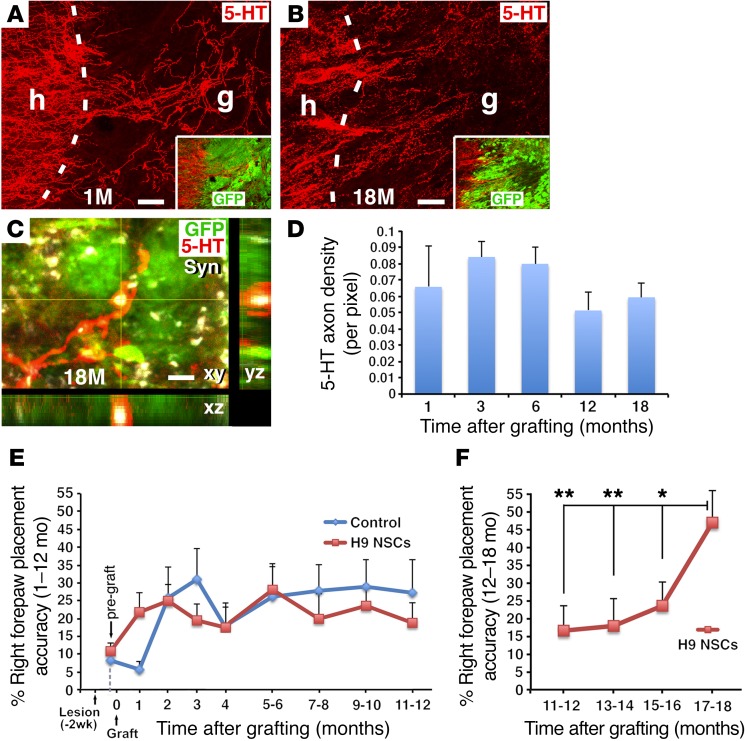
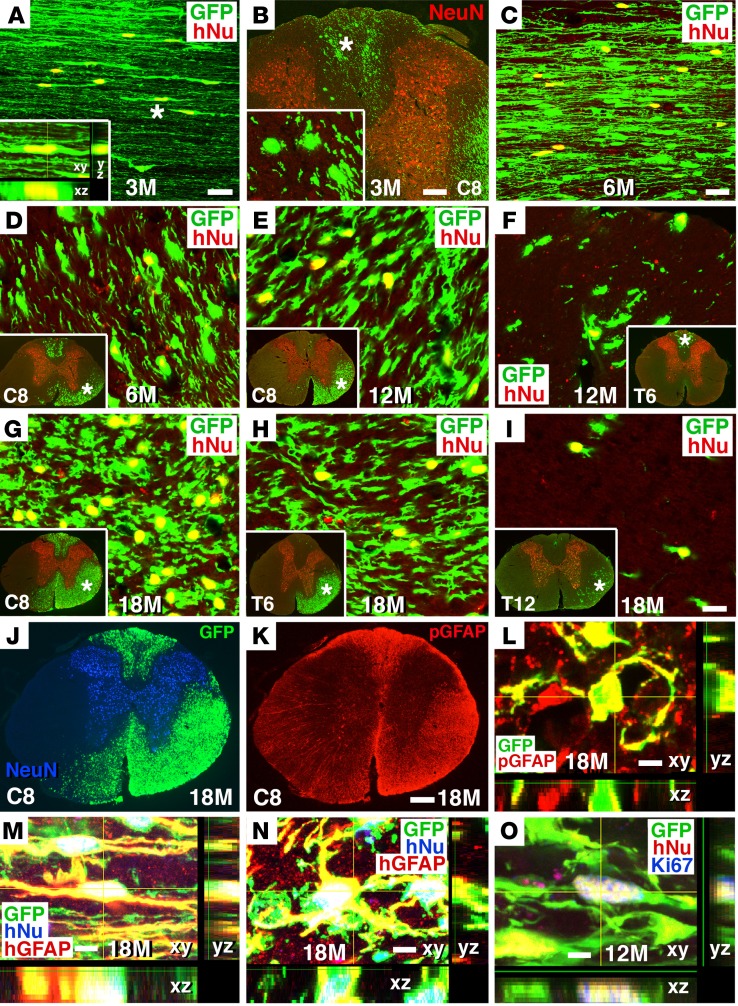
Neural stem cells (NSCs) differentiate into both neurons and glia, and strategies using human NSCs have the potential to restore function following spinal cord injury (SCI). However, the time period of maturation for human NSCs in adult injured CNS is not well defined, posing fundamental questions about the design and implementation of NSC-based therapies. This work assessed human H9 NSCs that were implanted into sites of SCI in immunodeficient rats over a period of 1.5 years. Notably, grafts showed evidence of continued maturation over the entire assessment period. Markers of neuronal maturity were first expressed 3 months after grafting. However, neurogenesis, neuronal pruning, and neuronal enlargement continued over the next year, while total graft size remained stable over time. Axons emerged early from grafts in very high numbers, and half of these projections persisted by 1.5 years. Mature astrocyte markers first appeared after 6 months, while more mature oligodendrocyte markers were not present until 1 year after grafting. Astrocytes slowly migrated from grafts. Notably, functional recovery began more than 1 year after grafting. Thus, human NSCs retain an intrinsic human rate of maturation, despite implantation into the injured rodent spinal cord, yet they support delayed functional recovery, a finding of great importance in planning human clinical trials.


Conflict of interest statement

Conflict of interest: The authors have declared that no conflict of interest exists.

Figures

Figure 1
Figure 1. H9-NSC graft morphology and Ki67 immunolabeling.
(AE) Graft size was stable over time in the C5 hemisection lesion site, and grafts were well integrated with the host. GFP and GFAP double-labeling (horizontal sections). (F) Grafts nonsignificantly expanded from 1 to 3 months after grafting (P = 0.6, by ANOVA) and were stable in size thereafter. Data represent the mean ± SEM. (G) The total number of grafted human cells (detected by hNu, a human-specific cell marker) was significantly reduced at 3 and 6 months, but recovered by 12 and 18 months. P < 0.05, by ANOVA and **P < 0.001 and *P < 0.05, by Fisher’s exact post-hoc test. Data represent the mean ± SEM. (HJ) Cell proliferation was significantly reduced after 3 months. hNu indicates the human-specific nucleus marker; Ki67 labels proliferating cells. P < 0.0001, by ANOVA and ***P < 0.001 and **P < 0.01, by Fisher’s exact post-hoc test comparing results at 1 and 3 months with results at 6, 12, and 18 months, respectively. Data represent the mean ± SEM. For F, G, and J: 1 month, n = 3; 3 months, n = 3; 6 months, n = 5; 12 months, n = 3; and 18 months, n = 4. Scale bars: 550 μm (AE); 7 μm (H and I).
Figure 2
Figure 2. Neuronal maturation over time.
(A) One month after grafting, human H9-NSCs expressed the human nuclear marker hNu; many cells also expressed the immature neuronal marker DCX in the cytoplasm. Inset shows image at higher magnification and colocalization of hNu and DCX. (B) Expression of DCX was substantially reduced by 3 months after grafting, and (C) at this time point, cells first express NeuN. Inset images show higher magnification. (DI) Expression of the pan-neuronal marker Hu from 1 to 18 months after grafting. Insets show higher magnification. Many NSCs, labeled for GFP, also expressed Hu at 1 month. At 3 and 6 months, Hu+ cell numbers were substantially reduced and partially recovered by 12 and 18 months (quantified in M). (JL) Hu cell distribution in the graft at 1, 6, and 18 months. Hu cell size increased over time (quantified in N) and adopted a more mature neuronal morphology. (O) Quantification of Hu fluorescence labeling intensity over time. All data represent the mean ± SEM. P < 0.001, ANOVA (MO) and ***P < 0.001, **P < 0.01, and *P < 0.05, by Fisher’s exact post-hoc comparison test for 1 (n = 3), 3 (n = 3), 6 (n = 5), 12 (n = 3), and 18 months (n = 4). Scale bars: 32 μm (AI); 250 μm (JL). Original magnification of Images in insets: A, B, D, and E: ×1200; C, FI: ×400.
Figure 3
Figure 3. Glial maturation over time.
(A and B) GFP and vimentin (Vim) immunolabeling revealed colocalization of grafted human cells expressing GFP with the glial progenitor marker vimentin 1 month after grafting. Inset in A is a higher-magnification image. (C and D) The mature astrocyte marker GFAP was not detectable in human NSC grafts until 6 months after implantation. Dashed lines indicate the host/graft (h/g) interface. Inset in C is a higher magnification image showing colocalization of GFP and GFAP. (E and F) The oligodendroglial marker Oligo2 was first detectable 3 months after grafting and colocalized with GFP and hNu markers. (G and H) However, the more mature oligodendrocyte marker APC was first detected only 12 months after NSC grafting and colocalized with GFP (inset in G). Scale bars: 60 μm (AD, G, and H); 24 μm (E and F). Original magnification of images in insets (A, C, F, G): ×600.
Figure 4
Figure 4. Axonal extension from H9-NSC grafts.
(A and B) Very large numbers of GFP-labeled human axons extended from the lesion site (far left side of the image) caudally after 1 month. (A) Horizontal section and (B) C8 coronal section. NeuN labels gray matter. Inset images show higher magnification of axons extending caudally in white matter, 3 mm caudal to the graft. The second inset in A shows colocalization of GFP with the axonal marker Tuj1, indicating the identity of many GFP processes as axons at 1 month. (C) Axons persisted 3 months after grafting, although glial migration was also evident at this point, as identified by the human nucleus marker hNu (inset; see also Figure 5). Because NSCs did not migrate into host gray matter, axon numbers over time could be quantified in gray matter. (D) A larger number of NSC-derived axons were evident in C8 gray matter at 3 months compared with those seen at 1 month, as quantified in K. (E and F) Six months after grafting, axons remained detectable in white and gray matter caudal to the lesion site. (G and H) By 12 months, a reduction in axon numbers caudal to the lesion site was observed, as quantified in C8 gray matter in K. (I and J) Further attenuation of axon numbers was evident at 18 months. (K) Quantification of human NSC-derived axons in C8 gray matter. Data represent the mean ± SEM. P = 0.14, by ANOVA for 1 (n = 3), 3 (n = 3), 6 (n = 5), 12 (n = 3), and 18 months (n = 4). (L) Glial migration did not reach T12, thus GFP-labeled axon numbers could be reliably quantified over time at T12. A gradual reduction in axon numbers was evident. P < 0.05, by ANOVA; *P < 0.05 and **P < 0.01, by Fisher’s exact post-hoc test for 1 (n = 3), 3 (n = 3), 6 (n = 5), 12 (n = 3), and 18 months (n = 3). Scale bars: 800 μm (A, C, E, G, and I); 25 μm (B, D, F, H, and J). Original magnification: ×1200 for GFP-TUJ1 and ×600 for other inset images.
Figure 5
Figure 5. Connectivity of human axons with host neurons.
(A and B) GFP-immunoreactive human axons in host gray matter at C8 expressed hSyn at both 3 and 18 months after grafting, suggesting the formation of presynaptic elements. (C and D) Some GFP-immunoreactive human axonal terminals expressed (C) vGlut1/2, suggesting the presence of excitatory synapses, or (D) GAD65/67, suggesting inhibitory synaptic terminals. (E and F) GFP and hSyn labeled presynaptic elements at human axonal terminals and were closely associated with individual excitatory and inhibitory postsynaptic proteins labeled with (E) PSD95 and (F) GPHN (all at C8 gray matter from subjects that survived 18 months). (G and H) Electron microscopy confirmed that DAB-labeled, GFP-expressing human axon terminals (T) formed synapses (arrowheads) with host dendrites (see insets) 3 months and 18 months after grafting. Synapses were asymmetric and contained rounded vesicles, suggesting excitatory synapses in these views. Scale bars: 3 μm (A, B, and D); 3.5 μm (C); 3 μm (E); 2.5 μm (F); 550 nm (G and H). Original magnification in G and H insets: ×15,000.
Figure 6
Figure 6. Host axonal regeneration and behavioral outcomes.
(A and B) Host 5-HT–labeled serotonergic axons regenerated into GFP-expressing human NSC grafts in a C5 hemisection lesion site 1 and 18 months after grafting. Dashed lines indicate the host/graft (h/g) interface. (C) Higher-magnification image shows 5-HT–labeled host axons regenerating into a GFP-expressing human NSC graft. The 5-HT–labeled structures colocalized with Syn in a Z-stack image, 18 months after grafting. (D) 5-HT quantification reveals that host serotonergic penetration of grafts was stable over time (P = 0.7, by ANOVA), for 1 (n = 3), 3 (n = 3), 6 (n = 5), 12 (n = 3), and 18 months (n = 4). (E) Forepaw placement accuracy on a behavioral grid-walking task was measured monthly for the first 4 months and bimonthly thereafter. Following an initial period of modest recovery from 0 to 2 months after lesioning, functional performance thereafter was stable in both grafted (n = 7) and control lesion (n = 5) groups and did not improve from 1 to 12 months (P = 0.62, by 2-way repeated-measures ANOVA comparing graft and lesion-only groups from 1 to 12 months). The control group was perfused at a preplanned anatomical endpoint of 12 months. (F) Functional testing in NSC-grafted animals continuing beyond 12 months (n = 4) revealed a significant, 2.7-fold late recovery of function compared with their own stable functional baseline at 12 months. **P < 0.02 and *P < 0.05, by post-hoc Fisher’s exact test comparing performance at 18 months at the indicated time points. Scale bars: 58 μm (A and B); 8 μm (C).
Figure 7
Figure 7. Human glial migration from graft site into host white matter.
(A and B) Human NSCs migrated out of the graft into host white matter, beginning 3 months after grafting, as indicated by colocalization of GFP with the human-specific nuclear marker hNu. (A) Horizontal section 3 mm caudal to the graft (inset is a Z-stack image); (B) coronal section at C8 (inset is a higher-magnification image from the dorsal column region, indicated by an asterisk). (C and D) More extensive human NSC migration was evident 6 months after grafting at the same level as in A, 3 mm caudal to the graft. (E and F) Human cell migration at C8 and T6 after 12 months; insets show regions of sampling, colabeled for NeuN. (GI) Human cell migration at C8, T6, and T12 at 18 months. (J and K) Migrated human cells (GFP+) colocalized with pan-GFAP (pGFAP); C8 coronal section 18 months after grafting. (L) Confocal Z-stack image showing colocalization of GFP and pGFAP at C8. (M and N) Z-stack images showing colocalization of GFP+ and hNu+ human cells with the human-specific astroglial marker hGFAP, 18 months after grafting. (M) Horizontal section 3 mm caudal to the graft; (N) coronal section at C8. (O) Z-stack image showing GFP and hNu coexpressing the cell proliferation marker Ki67, 12 months after grafting in a C7 horizontal section. Scale bars: 28 μm (A and C); 100 μm (B); 18 μm (DI); 260 μm (J and K); 3 μm (L); 7 μm (M); 5 μm (N and O). Original magnification of insets: ×1200 (A); ×400 (B); ×40 (DI).

Comment in

  • Patience pays in spinal repair.
    Goldman SA. Goldman SA. J Clin Invest. 2017 Sep 1;127(9):3284-3286. doi: 10.1172/JCI96650. Epub 2017 Aug 21. J Clin Invest. 2017. PMID: 28825601 Free PMC article.

References

    1. Wictorin K, Brundin P, Gustavii B, Lindvall O, Björklund A. Reformation of long axon pathways in adult rat central nervous system by human forebrain neuroblasts. Nature. 1990;347(6293):556–558. doi: 10.1038/347556a0. - DOI - PubMed
    1. Lepore AC, Fischer I. Lineage-restricted neural precursors survive, migrate, and differentiate following transplantation into the injured adult spinal cord. Exp Neurol. 2005;194(1):230–242. doi: 10.1016/j.expneurol.2005.02.020. - DOI - PubMed
    1. Tsuji O, et al. Therapeutic potential of appropriately evaluated safe-induced pluripotent stem cells for spinal cord injury. Proc Natl Acad Sci U S A. 2010;107(28):12704–12709. doi: 10.1073/pnas.0910106107. - DOI - PMC - PubMed
    1. Lu P, et al. Long-distance growth and connectivity of neural stem cells after severe spinal cord injury. Cell. 2012;150(6):1264–1273. doi: 10.1016/j.cell.2012.08.020. - DOI - PMC - PubMed
    1. Lu P, et al. Long-distance axonal growth from human induced pluripotent stem cells after spinal cord injury. Neuron. 2014;83(4):789–796. doi: 10.1016/j.neuron.2014.07.014. - DOI - PMC - PubMed

MeSH terms