

Tissue-Specific Accumulation of Sulfur Compounds and Saponins in Different Parts of Garlic Cloves from Purple and White Ecotypes
- PMID: 28825644
- PMCID: PMC6152257
- DOI: 10.3390/molecules22081359
Tissue-Specific Accumulation of Sulfur Compounds and Saponins in Different Parts of Garlic Cloves from Purple and White Ecotypes
Abstract
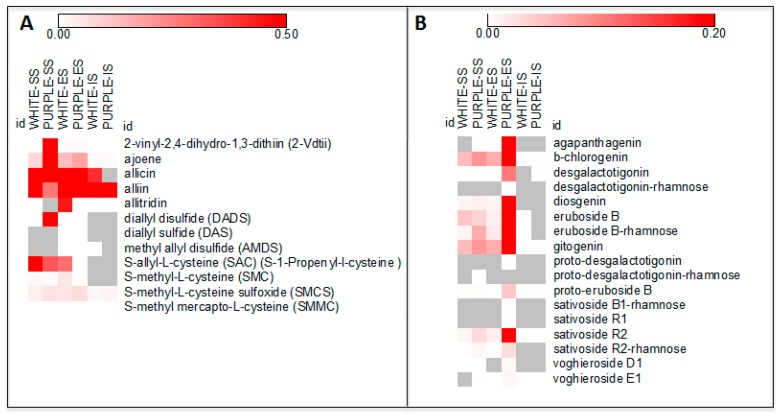
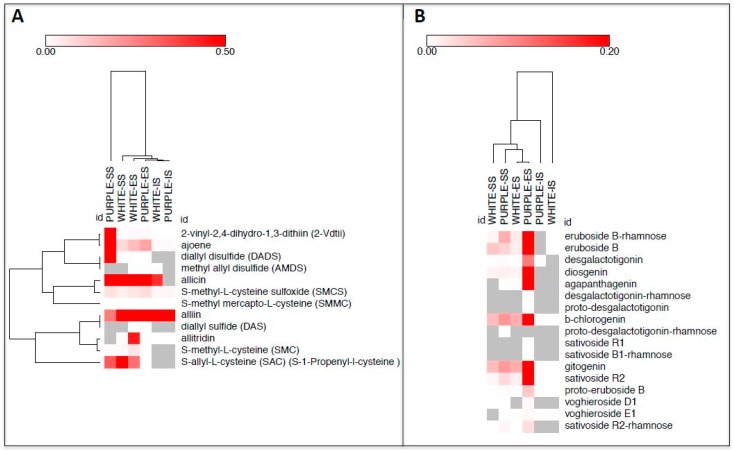
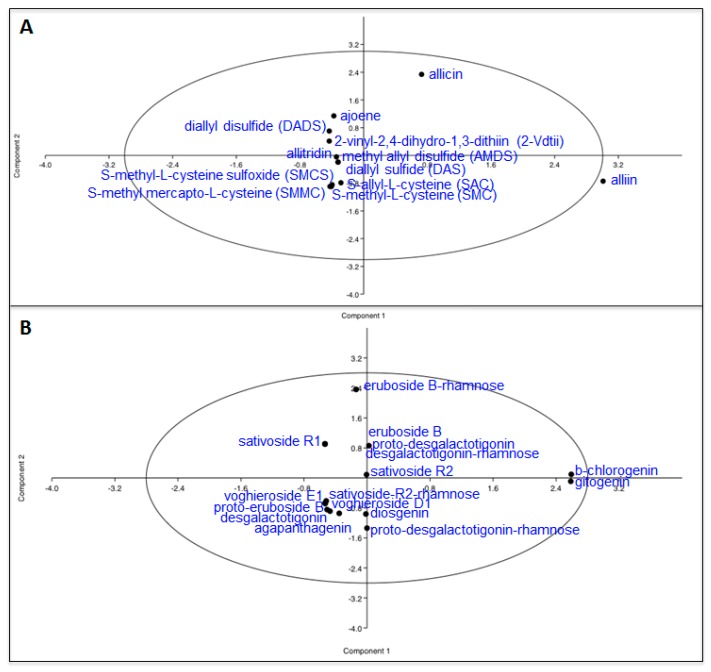
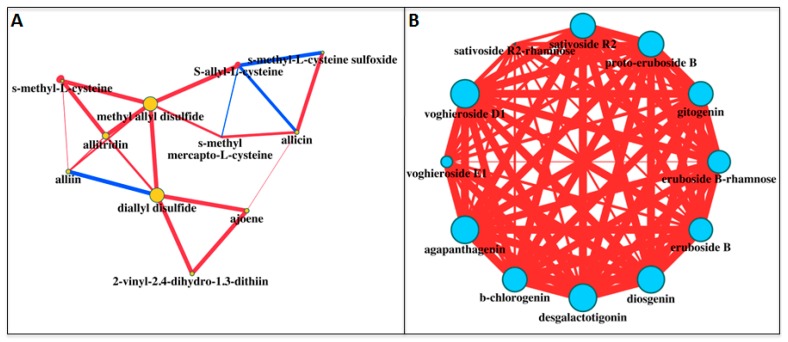
This study set out to determine the distribution of sulfur compounds and saponin metabolites in different parts of garlic cloves. Three fractions from purple and white garlic ecotypes were obtained: the tunic (SS), internal (IS) and external (ES) parts of the clove. Liquid Chromatography coupled to High Resolution Mass spectrometry (LC-HRMS), together with bioinformatics including Principal Component Analysis (PCA), Hierarchical Clustering (HCL) and correlation network analyses were carried out. Results showed that the distribution of these metabolites in the different parts of garlic bulbs was different for the purple and the white ecotypes, with the main difference being a slightly higher number of sulfur compounds in purple garlic. The SS fraction in purple garlic had a higher content of sulfur metabolites, while the ES in white garlic was more enriched by these compounds. The correlation network indicated that diallyl disulfide was the most relevant metabolite with regards to sulfur compound metabolism in garlic. The total number of saponins was almost 40-fold higher in purple garlic than in the white variety, with ES having the highest content. Interestingly, five saponins including desgalactotigonin-rhamnose, proto-desgalactotigonin, proto-desgalactotigonin-rhamnose, voghieroside D1, sativoside B1-rhamnose and sativoside R1 were exclusive to the purple variety. Data obtained from saponin analyses revealed a very different network between white and purple garlic, thus suggesting a very robust and tight coregulation of saponin metabolism in garlic. Findings in this study point to the possibility of using tunics from purple garlic in the food and medical industries, since it contains many functional compounds which can be exploited as ingredients.
Keywords: LC-HRMS; correlation networks; purple and white garlic; saponins; sulfur compounds.
Conflict of interest statement
The authors declare no conflicts of interest.
Figures
References
-
- Lewinsohn E., Gijzen M. Phytochemical diversity: The sounds of silent metabolism. Plant Sci. 2009;176:161–169. doi: 10.1016/j.plantsci.2008.09.018. - DOI
-
- Rivlin R.S. Historical perspective on the use of garlic. J. Nutr. 2001;131:951S–954S. - PubMed
-
- Yan J.Y., Tian F.M., Hu W.N., Zhang J.H., Cai H.F., Li N. Apoptosis of human gastric cancer cells line SGC 7901 induced by garlic-derived compound S-allylmercaptocysteine (SAMC) Eur. Rev. Med. Pharmacol. Sci. 2013;17:745–751. - PubMed
MeSH terms
Substances
LinkOut - more resources
Full Text Sources
Other Literature Sources
