. 2017 Sep;19(9):1093-1104.
doi: 10.1038/ncb3597. Epub 2017 Aug 21.

Early loss of Crebbp confers malignant stem cell properties on lymphoid progenitors

Affiliations

Early loss of Crebbp confers malignant stem cell properties on lymphoid progenitors

Sarah J Horton et al. Nat Cell Biol. 2017 Sep.

Abstract

Loss-of-function mutations of cyclic-AMP response element binding protein, binding protein (CREBBP) are prevalent in lymphoid malignancies. However, the tumour suppressor functions of CREBBP remain unclear. We demonstrate that loss of Crebbp in murine haematopoietic stem and progenitor cells (HSPCs) leads to increased development of B-cell lymphomas. This is preceded by accumulation of hyperproliferative lymphoid progenitors with a defective DNA damage response (DDR) due to a failure to acetylate p53. We identify a premalignant lymphoma stem cell population with decreased H3K27ac, which undergoes transcriptional and genetic evolution due to the altered DDR, resulting in lymphomagenesis. Importantly, when Crebbp is lost later in lymphopoiesis, cellular abnormalities are lost and tumour generation is attenuated. We also document that CREBBP mutations may occur in HSPCs from patients with CREBBP-mutated lymphoma. These data suggest that earlier loss of Crebbp is advantageous for lymphoid transformation and inform the cellular origins and subsequent evolution of lymphoid malignancies.


Conflict of interest statement

Competing financial interests

The authors declare no competing financial interests.

Figures
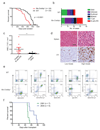
Figure 1
Figure 1. Loss of Crebbp generates an aggressive mature LPD/Lymphoma.
a. Kaplan-Meier (KM) graph demonstrating significantly reduced survival for Mx-Crebbp-/- mice (n = 34 animals) over WT littermates, (n = 23 animals, p < 0.0001) Log-rank (Mantel-Cox) test. b. Increased incidence of haematological malignancies of Mx-Crebbp-/- mice in comparison to WT mice (18 vs 7 cases), that is particularly marked for B-cell LPD (10 vs 3 cases). c. Mice with B-cell LPD (n = 9 animals) demonstrate a significantly raised WCC count in comparison to other Mx-Crebbp-/- mice (n = 14 animals) (** p=0.0034, Mann Whitney test). The mean ± standard error of the mean (SEM) is shown. d. Spleen (upper panels H + E) and Lymph node (lower, Ki-67 staining) histology from Mx-Crebbp-/- mice with B-cell LPD/Lymphoma. Scale bar: 25µm. e. Immunophenotypic analysis confirming a mature B-cell phenotype (CD19+, B220+, sIgM+) with additional aberrant markers (Mac1Int, CD5+). f. The disease is transplantable to secondary recipients. Two representative tumours 2391 and 2634 (7 and 5 recipient animals respectively) are shown.
Figure 2
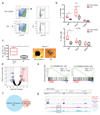
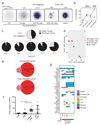
Figure 2. Crebbp loss alters stem and progenitor function.
a Representative FACS plots of bone marrow reveal b. a general increase in lin- cells in BM (p = 0.0012 by 2-sided t-test with Welch’s correction), and PB (p = 0.01 by 2-sided t-test) and in IL-7Ra+ progenitors in BM (p = 0.0065 by 2-sided t-test with Welch’s correction) of Mx-Crebbp-/- animals (n = 6 animals per genotype; 3 individual animals per genotype, quantified in 2 independent experiments). c. IL-7Ra+ progenitor population from Mx-Crebbp-/- mice demonstrates an increased clonogenic (left panel) and proliferative (right photomicrographs, scale bar 50μM) potential in CFC assays (left, n = 6 animals per genotype; 2 individual animals per genotype, quantified in 3 independent experiments, ** p = 0.0024 by 2-sided t-test). All graphs show the median with boxes representing the interquartile range and whiskers representing the minimum and maximum values. d. Volcano plot of differential gene expression between Mx-Crebbp-/- and WT mice (n = 6 animals per genotype). P value generated using a negative binomial generalized linear model (DEseq2) e. GSEA analysis demonstrates enrichment for a published CREBBP mutant lymphoma signature. f. Integration of downregulated differentially bound H3K27Ac peaks and downregulated genes demonstrates only minimal overlap. g. Integrated plot showing RNA-Seq and H3K27Ac ChIP-Seq at the Dtx1 locus demonstrates that downregulated gene expression is accompanied by a statistically significant loss of H3K27ac at an intragenic enhancer (boxed) in Crebbp-/- progenitors. All mice were treated with pIpC between 6-10 weeks after birth (7.7 weeks in Fig a-b, 6.3 weeks in Fig c and 6.9 weeks in Fig d) and IL7Ra+ cells isolated from the BM 8-10 weeks (9.6 weeks in Fig a-b, 8.1 weeks in Fig c and 9 weeks in Fig d) after pIpC administration.
Figure 3
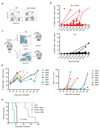
Figure 3. Development of a pre-malignant stem cell population upon Crebbp loss.
a. An aberrant cell population with similar B220+/Mac1Int surface phenotype to the tumours can be found in the PB b. Increase in this aberrant cell population over time following pIpC administration (Mx-Crebbp-/-; 67 mice, WT; 64 mice). c. Transplant of this pre-malignant stem-cell population into 7 congenic CD45.1 recipient mice generates d. high-level engraftment (>25% of peripheral blood cells at 4 weeks, left panel) with sequential in vivo amplification of this population seen over time (left panel) ultimately giving rise to elevated WBC counts and LPD (right panel). Each separately coloured number (4658, 4659, 4660, 4661, 4662, 4663 and 4664) in both panels represents the same individual transplant recipient. e. KM graph of survival of the recipient animals in (d) receiving pre-malignant B220+/Mac1Int (median survival 132 days) in contrast to LSK cells (n = 7 mice per cell population) and secondary recipients of tumour cells from 4661 (n = 5 recipient mice) and 4663 (n = 3 recipient mice) (median survival 48 days, p = 0.0002, Log-rank (Mantel-Cox) test).
Figure 4
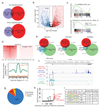
Figure 4. Transcriptional and epigenetic alterations in Crebbp-/- deficient lymphomas.
a. Venn diagrams show overlaps in differentially expressed genes between WT and Mx-Crebbp-/- lymphomas when compared to WT B220+ cells. Numbers in outer circles are inclusive of overlaps, overlapping gene numbers are shown. b. Volcano plot of differential gene expression between Mx-Crebbp-/- lymphomas (from n = 2 animals) and WT B220 cells (from n = 6 animals; B220+ cells from 3 WT animals pooled per sequencing reaction). P value generated using a negative binomial generalized linear model (DEseq2). c. GSEA analysis of genes differentially expressed between Mx-Crebbp-/- and WT lymphomas demonstrates enrichment of a CREBBP mutant human signature and a previously published dataset of murine lymphomas. d. H3K27Ac modification measured by specific density plots (upper panel) and averaged read counts (lower panel) for genes downregulated in Mx-Crebbp-/- lymphomas. e. Significant overlap is seen for Crebbp binding, downregulated H3K27Ac peaks (left panel), H3K18Ac peaks (middle panel), H3K56Ac peaks (right panel) and genes downregulated in Mx-Crebbp-/- lymphomas compared to WT B220+ cells (p values for hypergeometric comparisons are shown). f. Integrated RNA-Seq and ChIP-Seq analysis of the Pten locus, a known lymphoma tumour suppressor, in normal B220+ B-cells and the B-cell LPD/lymphoma demonstrates decreased H3K27Ac at the boxed Crebbp bound peak. g. Downregulated H3K27Ac peaks occur most frequently at enhancer regions and h appear to alter the function of genes regulated in WT B220+ cells by superenhancers (red) and normal enhancers (black). i. Table demonstrating selected motifs enriched in the downregulated H3K27Ac peaks in Mx-Crebbp-/- LPD (ΔH3K27Ac) and Crebbp bound peaks in WT B220 cells (Crebbp), as determined by de novo motif analysis.
Figure 5
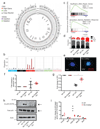
Figure 5. Genetic evolution in Crebbp deficient mice is linked to a defective DNA damage response.
a. Circos plot showing SNV and copy number analysis for a representative Crebbp-/- lymphoma. b. Mutational signature analysis of exome sequencing results for Mx-Crebbp-/- tumours (after Alexandrov34), demonstrates an ageing signature. c. GSEA analysis in IL-7Ra+ progenitors demonstrates enrichment for DNA repair genes and genes associated with DNA damage. d. Bar chart showing the number of double stranded DNA breaks as evidenced by H2AXγ foci in IL-7Ra+ progenitors from WT and Mx-Crebbp-/- mice, demonstrating no basal difference, but a marked difference in cells with multiple foci in Mx-Crebbp-/- progenitors upon the induction of DNA damage with HU. The mean ± SEM is shown, n = 3 independent experiments (*p= 0.047 by 2-sided t-test). See Supplementary Table 26 for scatter plots of >10 foci. e. Representative image of H2AXγ foci in untreated and HU treated Mx-Crebbp-/- cells. Scale bar 10µm. f. Despite the increase in DNA damage in Mx-Crebbp-/- mice, no difference in the degree of progenitor apoptosis following HU treatment was seen between WT and Mx-Crebbp-/- mice (n = 3 biologically independent experiments, 2-sided t-test). g. Preservation of clonogenic capacity in CFC assays for Mx-Crebbp-/- when compared to WT lymphoid progenitors following HU. The mean ± SEM is shown, n = 4 mice per genotype; 2 mice per genotype quantified in 2 independent experiments (**p=0.003 by 2-sided t-test). h. Western blot analysis demonstrates that following HU, Mx-Crebbp-/- lymphoid progenitors fail to properly acetylate p53 and induce an optimal DNA damage response (upper arrow, acetylated (K379) p53, lower arrow, total p53). Unprocessed scans of blots are shown in Figure S8. i. Transcriptional activation of targets genes suggests a loss of p53 activity. The graph shows data from two independent experiments with a line representing the mean.
Figure 6
Figure 6. Crebbp deficient pre-malignant stem cells demonstrate clonal, transcriptional and genetic evolution during lymphomagenesis.
a. Left 2 panels, clonal analysis of IgH DNA rearrangements demonstrates a reduced IgH repertoire diversity (number of dots) and an increased maximum clone size (relative size of dots, maximum clone size given above each panel) for Mx-Crebbp-/- mice when compared to WT littermates. This repertoire narrows further as the pre-malignant (PM) B220+/Mac1Int stem cell population increases from 10% to 80% in the PB (2 middle panels) of the same animal during disease evolution. b. Similar information in bar chart form. RNA analysis from the last time point demonstrates that both clones are expressed suggesting a cellularly biclonal tumour. c. Pie charts to figuratively illustrate the growth of the dominant clone donated from the premalignant animal 3975 in the transplant recipients. Colour scheme and animal identifiers are as per Figure 3. d. Principle component analysis (PCA) demonstrates clear transcriptional differences along the continuum of lymphoma development from WT B cells through the PM stage to the Mx-Crebbp-/- lymphoma and between Mx-Crebbp-/- tumours and WT lymphomas. e. Venn diagrams document that genes differentially expressed in PM cells remain differentially expressed in the same direction in Mx-Crebbp-/- lymphomas. Numbers in outer circles are inclusive of overlaps, overlapping numbers are shown. f. Scatter plot showing that the total number of SNVs increases along lymphoma evolution. Mean ± SEM is shown, LSK n = 2 mice, PM n = 8 mice, Crebbp-/- LPD n = 14 mice, WT LPD n = 3 mice. P value calculated using 2-sided t-test. g. Mutations in the most recurrently altered genes. Results for the premalignant (PM) donor cells from animal 3975 are aligned beside the tumours that developed from these cells in animals 4659, 4661, 4662, 4663 and 4644, demonstrating obvious and divergent genetic evolution within the individual lymphomas.
Figure 7
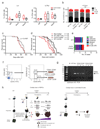
Figure 7. Loss of Crebbp in committed lymphoid cells attenuates disease generation and CREBBP mutations occur in HSPC from a lymphoma patient.
a. Analysis of the Lin- and IL7Ra+ compartments in Cd19-Crebbp-/- mice. Box plots show the median with interquartile range and whiskers represent the minimum and maximum values, n = 6 mice per genotype were quantified. Non-significance confirmed using 2-sided t-test. b. Comparison of H2AXγ foci in the IL7Ra+ progenitor populations from Cd19-Crebbp-/- mice. Data represent the mean ± SEM from n = 3 independent experiments, non-significance confirmed using 2-sided t-test. See Supplementary Table 26 for scatter plots of >10 foci. c. KM analysis showing that no significant alterations in survival were seen for Cd19-Crebbp-/- mice (n = 27 animals) vs WT mice (n = 25 animals). P value calculated using Log-rank (Mantel-Cox) test. d. in contrast to that seen in Mx-Crebbp-/- mice. e. B-cell disease was very rare in this cohort (Cd19-Crebbp-/- LPD 4 cases, WT LPD 1 case). f. Flow sorting strategy to functionally isolate specific HSPC populations from patients with CREBBP mutated lymphomas. g. Allele specific PCR demonstrates the presence of the same mutation (183 bp band) identified from the tumour (Mut lane) within the CD34+/CD38+ HSPC population. CFU-colony forming assay, Bl- blank, WT- wild type. h. Model of mechanisms and stage specific nature of Crebbp tumour suppression in lymphoid malignancies. Following early loss of Crebbp activity in the HSPC compartment, abnormal epigenetic regulation, post-translational modifications of substrate proteins and altered transcription lead to expansion of lymphoid progenitors, blocked differentiation, increased proliferation and clonogenicity within this expanded progenitor pool. In association with an alteration of the DNA damage response mediated through suboptimal Crebbp acetylation of p53, DNA double strand breaks accumulate and accompanied by a relative decrease in apoptosis, lead to the retention of mutations within B-cell progenitors. We illustrate the epigenetic priming of specific loci at earlier time points, where H3K27ac ChIP-Seq and RNA-Seq at the critical gene X locus read out in terms of downregulation of gene expression only at later timepoints during lymphoma evolution. We speculate that the molecular aberrations cumulatively acquired interact with this primed epigenetic state and lead to the restoration of self-renewal in this abnormal pre-malignant stem cell population and to the evolution of Lymphoma.

References

    1. Blobel GA. CREB-binding protein and p300: molecular integrators of hematopoietic transcription. Blood. 2000;95:745–755. - PubMed
    1. Roelfsema JH, Peters DJ. Rubinstein-Taybi syndrome: clinical and molecular overview. Expert reviews in molecular medicine. 2007;9:1–16. - PubMed
    1. Kung AL, et al. Gene dose-dependent control of hematopoiesis and hematologic tumor suppression by CBP. Genes & development. 2000;14:272–277. - PMC - PubMed
    1. Cancer Genome Atlas Research, N. Genomic and epigenomic landscapes of adult de novo acute myeloid leukemia. N Engl J Med. 2013;368:2059–2074. doi: 10.1056/NEJMoa1301689. - DOI - PMC - PubMed
    1. Papaemmanuil E, et al. Clinical and biological implications of driver mutations in myelodysplastic syndromes. Blood. 2013;122:3616–3627. doi: 10.1182/blood-2013-08-518886. quiz 3699. - DOI - PMC - PubMed

MeSH terms