. 2017 Sep;19(9):1105-1115.
doi: 10.1038/ncb3595. Epub 2017 Aug 21.

A regulated PNUTS mRNA to lncRNA splice switch mediates EMT and tumour progression

Affiliations

A regulated PNUTS mRNA to lncRNA splice switch mediates EMT and tumour progression

Simon Grelet et al. Nat Cell Biol. 2017 Sep.

Erratum in

Abstract

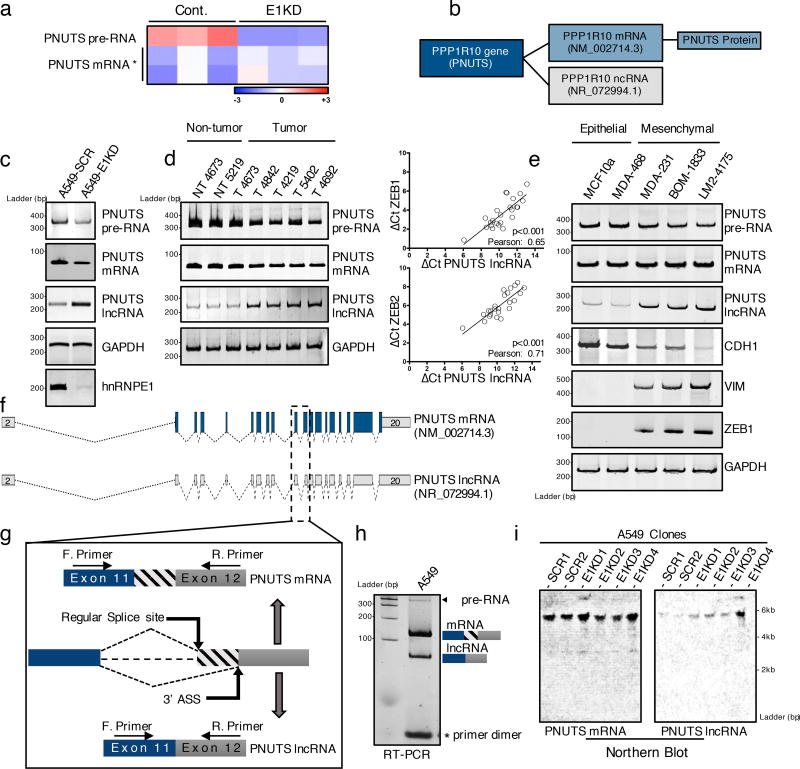
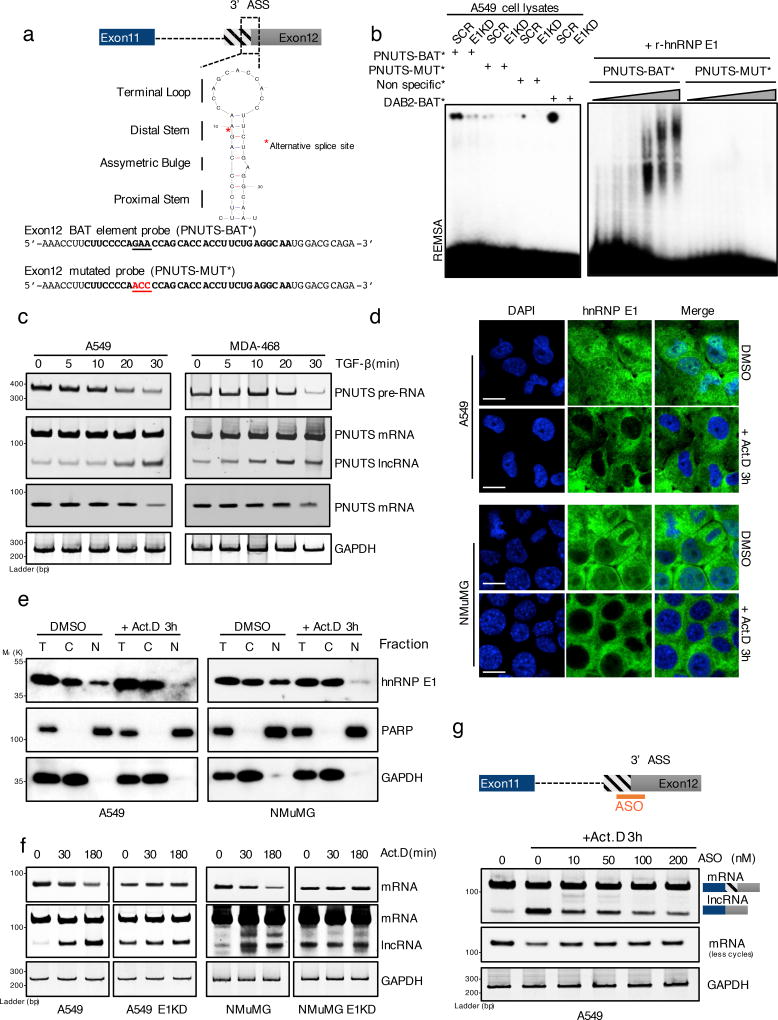
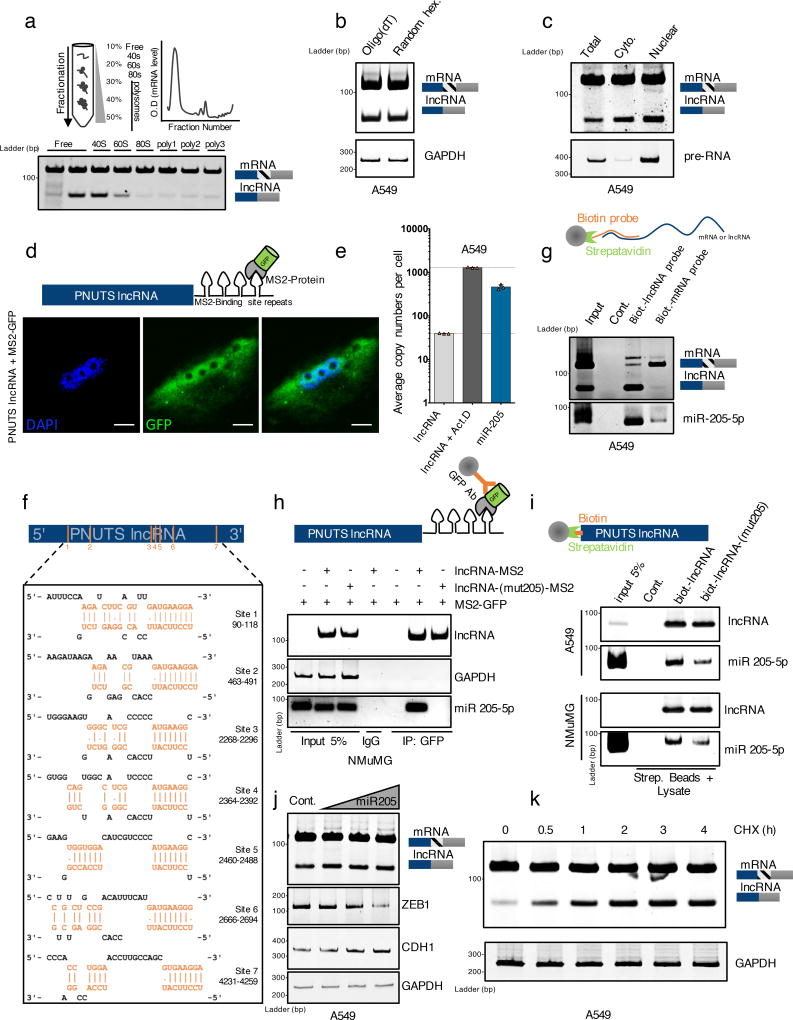
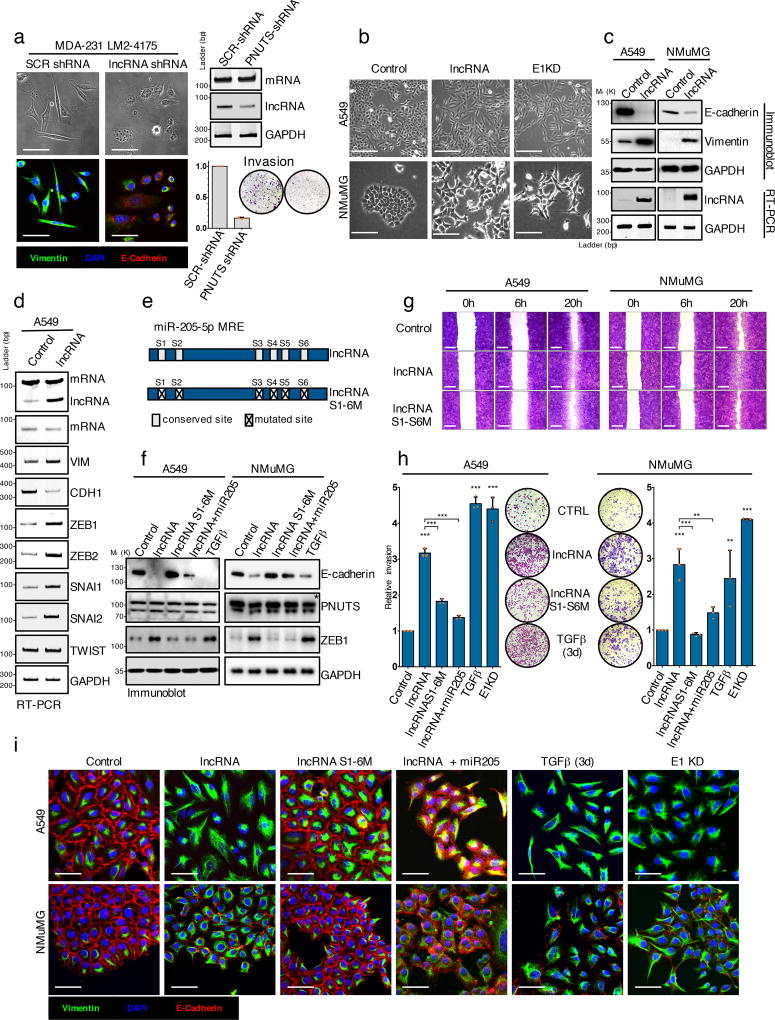
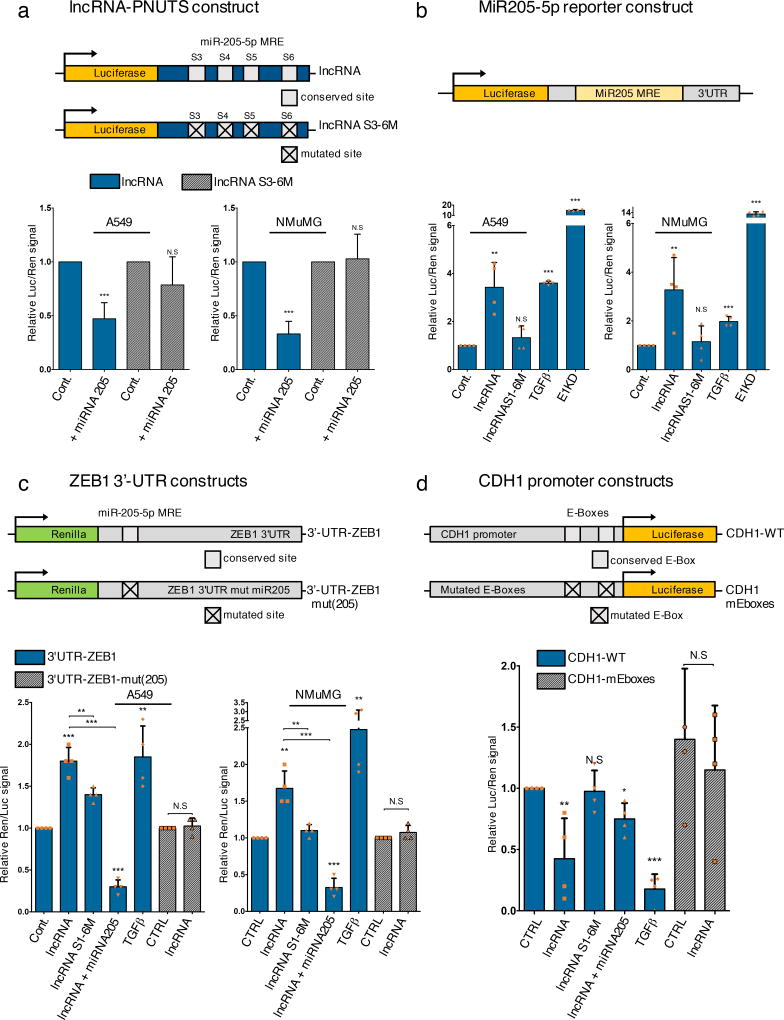
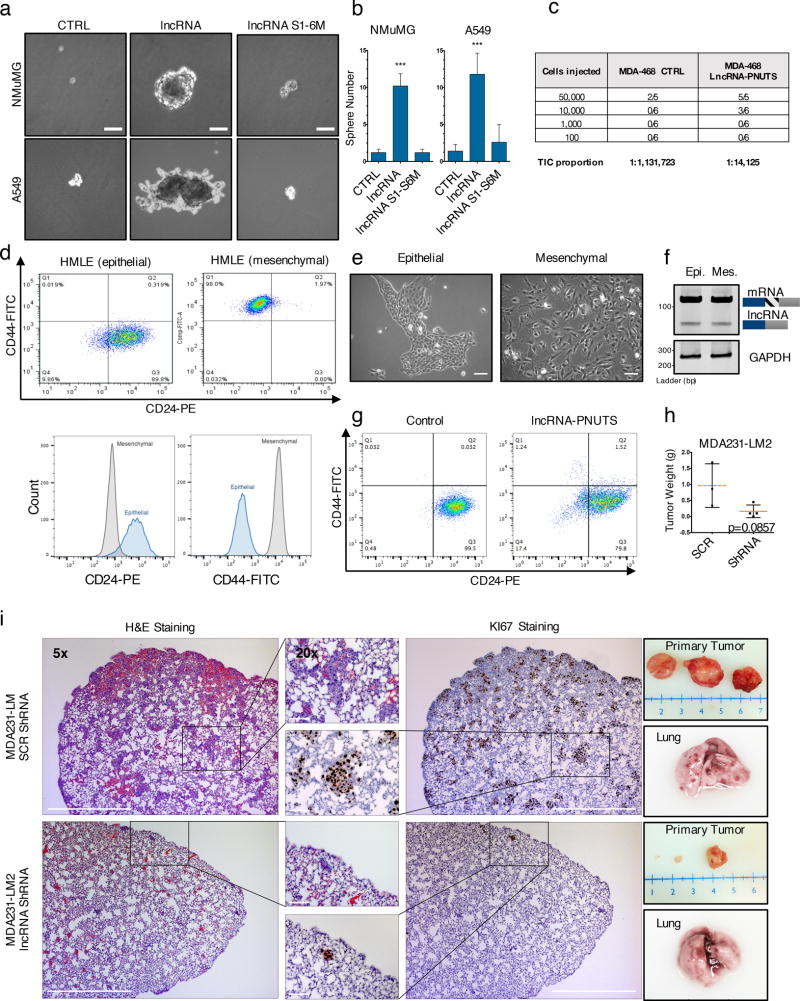
The contribution of lncRNAs to tumour progression and the regulatory mechanisms driving their expression are areas of intense investigation. Here, we characterize the binding of heterogeneous nuclear ribonucleoprotein E1 (hnRNP E1) to a nucleic acid structural element located in exon 12 of PNUTS (also known as PPP1R10) pre-RNA that regulates its alternative splicing. HnRNP E1 release from this structural element, following its silencing, nucleocytoplasmic translocation or in response to TGFβ, allows alternative splicing and generates a non-coding isoform of PNUTS. Functionally the lncRNA-PNUTS serves as a competitive sponge for miR-205 during epithelial-mesenchymal transition (EMT). In mesenchymal breast tumour cells and in breast tumour samples, the expression of lncRNA-PNUTS is elevated and correlates with levels of ZEB mRNAs. Thus, PNUTS is a bifunctional RNA encoding both PNUTS mRNA and lncRNA-PNUTS, each eliciting distinct biological functions. While PNUTS mRNA is ubiquitously expressed, lncRNA-PNUTS appears to be tightly regulated dependent on the status of hnRNP E1 and tumour context.


Conflict of interest statement

Competing Financial Interests

The authors declare no competing financial interests.

Figures

Figure 1
Figure 1. PNUTS alternative splicing occurs upon hnRNP E1 loss and is increased in mesenchymal tumor cells
(a) Heat map of Affymetrix array data showing expression levels (log2 fold) of either PNUTS pre-RNA or PNUTS mRNA in control (CTRL) or hnRNP E1 knockdown (E1KD) NMuMG cells. The data were generated from triplicates samples. * Two distinct probes were used to target the spliced PNUTS RNA. (b) NCBI database accession numbers of PNUTS mRNA and PNUTS predicted lncRNA isoform in human. (c) Validation by RT-PCR analysis with primers specific to PNUTS isoforms of alternative PNUTS gene processing upon hnRNP E1 knockdown in human A549 cell line. (d) (Left) PNUTS isoform expression levels analyzed by RT-PCR in human breast tumor samples (T) or non-tumor counterparts (NT). (Right) Quantitative RT-PCR analysis of lncRNA-PNUTS, ZEB-1 and ZEB-2 expression in 24 human breast tumor samples. Relative expression levels of transcripts were calculated using the ΔCt method normalizing to GAPDH. Correlations between transcript expression levels were evaluated using Pearson correlation coefficient test. (Linear regression, df=24-2, a Pearson score > 0.515 and p<0.05 was considered as significant). Source data are available in Supplementary table 2. (e) PNUTS isoform expression screening by RT-PCR analysis in MCF10a mammary gland epithelial cells and MDA-MB-468 breast cancer epithelial cells, or in the metastasis progression model of MDA-MB-231 mesenchymal cell line (MDA-231, BOM-1833, LM2-4175). E-Cadherin (CDH1) was used as epithelial marker while vimentin (VIM) and ZEB1 were used as mesenchymal cell specific markers. (f) Map of PNUTS isoforms acquired by sequence alignment and drawn by using fancyGene online software. (g) Schematic representation of the alternative splicing region of the PNUTS variants (ASS: Alternative Splicing Site). (h) RT-PCR amplification of exon11–exon12 junction encompassing the predicted alternative splicing site using intron-flanking PCR primers as indicated in (g). (i) Northern-blot analysis of both PNUTS mRNA and lncRNA isoforms expression in control (SCR) or hnRNP E1 knockdown (E1KD) A549 cell clones.
Figure 2
Figure 2. hnRNP E1 protein prevents PNUTS alternative splicing by its specific binding to a BAT structural element
(a) Secondary structure of the human PNUTS alternative splicing site as predicted by the Mfold algorithm (ΔG= −3.90 kcal.mol−1). The underlined nucleotides colored in red represent the mutant probe used for the REMSA experiment in (b) and (c). The red asterisk represents the exact alternative splicing site leading to the lncRNA-PNUTS isoform generation. (ASS: Alternative Splicing Site) (b) (Left) RNA electromobility shift assay (REMSA) experiment using either wild-type [PNUTS-BAT] or mutated [PNUTS-MUT] α-32P-labelled PNUTS alternative splicing site probes combined with control (SCR) or hnRNP E1 knockdown (E1KD) A549 cell lysates. The [PNUTS-MUT] probe was mutated by a nucleotide substitution to destroy its secondary structure. [Non specific] and [DAB2-BAT] α-32P-labelled probes were used as negative and positive controls respectively. [DAB2-BAT] corresponds to the BAT-sequence located on the Dab2–3'UTR already described to bind to hnRNP E1. (Right) REMSA using a combination of [PNUTS-BAT] or mutated [PNUTS-MUT] α-32P-labelled probes with increasing concentration of recombinant hnRNP E1 protein purified from e. coli bacteria. (c) Time course experiment using RT-PCR analysis of PNUTS gene processing after addition of 5ng.mL−1 of TGFβ. (d) Confocal microscopy imaging of the hnRNP E1 nucleocytoplasmic shuttling by addition of 5µg.mL−1 of Actinomycin D for 3h in A549 and NMuMG cells cultures. Scale bar: 10µM (e) Characterization of the nucleocytoplasmic transportation of hnRNP E1 following Act.D treatment by using cell fractionation and subsequent western-blot analysis of hnRNP E1 expression. To check the fractions purity, GAPDH and PARP were used as cytoplasmic and nuclear compartment markers respectively. (f) Time course experiment using RT-PCR analysis of PNUTS predicted-lncRNA alternative splicing activation upon addition of 5µg.mL−1 of Act.D in control (CTRL) or hnRNP E1 silenced (E1KD) A549 and NMuMG cells. (g) Inhibition of alternative splicing induced by Act.D in A549 cells using and antisense oligonucleotide (ASO) targeting the alternative splicing site of PNUTS. GAPDH was used as a loading control. Unprocessed original scans of blots are shown in Supplementary Fig. 7
Figure 3
Figure 3. PNUTS alternative splicing product is non-coding and interacts with miR-205
(a) Polysome fractionation experiment of A549 cells followed by RT-PCR analysis of PNUTS mRNA and lncRNA-PNUTS expression in each fraction. (b) RT-PCR analysis of PNUTS mRNA and lncRNA-PNUTS expression after the use of oligo-(dT) or random hexanucleotides as primers for initial reverse transcription reaction. (c) RT-PCR analysis of lncRNA-PNUTS expression in A549 cells. The total, cytoplasmic (Cyto.) and nuclear fractions are shown. PNUTS pre-RNA and PNUTS mRNA were used as endogenous controls to monitor the fractions purity. (d) Confocal microscopy imaging of subcellular localization of lncRNA-PNUTS using co-transfection of a MS2-tagged-RNA construct of lncRNA-PNUTS and a fused MS2-GFP protein construct. Scale bar: 5µM. (e) The exact copy numbers of lncRNA-PNUTS (basal levels or levels following activation by Actinomycin D treatment for 3h) and miR-205 were quantified with limiting-dilution qRT-PCR. Data are shown as mean ± s.d., n= 3 independent experiments per condition. Source data are available in Supplementary table 2. (f) In silico prediction of MiR-205 binding sites located on lncRNA-PNUTS, obtained using the DIANA-microT web server. (g) Selective pull-down of either endogenous lncRNA-PNUTS or PNUTS-mRNA isoforms by using antisense biotinylated probes followed by miRNA-specific RT-PCR analysis to detect endogenously associated miR-205 with lncRNA-PNUTS in A549 cells. (h) MS2-RIP followed by miRNA-specific RT-PCR analysis to detect the association of miR-205 with lncRNA-PNUTS in NMuMG cells. LncRNA-PNUTS and GAPDH expression were used as internal controls. (i) A549 and NMUMG cell lysates incubated with in vitro transcribed biotin-labeled lncRNA-PNUTS were subjected to pull-down followed by miRNA extraction and analysis by RT-PCR. (j) A549 cells overexpressing lncRNA-PNUTS were transfected with an increasing concentration of a synthetic miR-205 mimic and the lncRNA expression was assessed by RT-PCR. ZEB-1 and CDH1 were used to monitor the efficiency of miR-205 overexpression on mesenchymal-epithelial transition (MET) process. (k) Time course experiment by using RT-PCR analysis of lncRNA-PNUTS levels upon addition of 10µg.mL−1 cycloheximide in A549 cells. GAPDH was used as a loading control.
Figure 4
Figure 4. LncRNA-PNUTS regulates EMT and cell migration/invasion in vitro
(a) MDA-231-LM2-4175 cells stably silenced for lncRNA-PNUTS were analyzed by immunofluorescence (left) using antibodies against vimentin (green), E-cadherin (red) and merged with DAPI (blue). Scale bar: 50µM. lncRNA-PNUTS silencing was monitored by RT-PCR (right, top). Invasive capacities of control (SCR-shRNA) or lncRNA-PNUTS silenced (PNUTS shRNA) cells were monitored in modified Boyden chamber assay (right, bottom). (Mean ± s.d., n= 3 independent experiments per condition). Source data are available in Supplementary table 2. (b) A549 and NMuMG cells stably overexpressing lncRNA-PNUTS were analyzed using bright-field microscopy. hnRNP E1 knockdown (E1KD) cells were used as controls. Scale bar: 100µM. (c) Western-blot (top) and RT-PCR (bottom) analysis of E-cadherin, vimentin and lncRNA-PNUTS in A549 and NMuMG cells overexpressing lncRNA-PNUTS. (d) RT-PCR analysis of several EMT-related transcription factors in A549 cells stably overexpressing lncRNA-PNUTS. (e) Schematic outlining the constructs used in this study for wild-type (lncRNA) or mutated (lncRNAS1-6M) lncRNA. (f) Western-blot analysis of E-cadherin, PNUTS and ZEB1 protein expression in A549 and NMuMG cells overexpressing wild-type (lncRNA) or mutated (lncRNAS1-6M) constructs of lncRNA-PNUTS and treated or not with synthetic miR-205 mimic or TGFβ for 3 days. TGFβ was used as a positive control. * PNUTS protein band. (g) Wound-healing migration assay of control (CTRL), lncRNA-PNUTS (lncRNA) or mutated lncRNA-PNUTS (lncRNAS1-6M) A549 and NMuMG cell models. Scale bar: 400µM (h) Modified Boyden chamber invasion assay of wild-type (lncRNA) or mutated (lncRNAS1-6M) lncRNA-PNUTS overexpressing A549 and NMuMG cells pre-treated +/− synthetic miR-205 mimic or TGFβ for 3 days. hnRNP E1 knockdown (E1KD) and TGFβ treated cells were used as a positive control. (Mean ± s.d., n= 3 independent experiments per condition, ANOVA followed by post-hoc Tukey's multiple comparisons test, *p<0.05; **p<0.01; ***p<0.001, NS, not significant). Source data are available in Supplementary table 2. (i) Confocal microscopy imaging of co-immunostaining of vimentin (green), E-cadherin (red) and merged with DAPI (blue) in A549 and NMuMG cells overexpressing wild-type (lncRNA) or mutated (lncRNAS1-6M) constructs of lncRNA-PNUTS and treated +/− synthetic miR-205 mimic or TGFβ for 3 days. Scale bar: 50µM. For all western-blots and RT-PCRs GAPDH was used as a loading control. Unprocessed original scans of blots are shown in Supplementary Fig7
Figure 5
Figure 5. LncRNA-PNUTS controls the miR-205/ZEB/E-Cadherin axis
(a) Dual luciferase reporter assays to test the interaction between miR-205 and lncRNA-PNUTS (S3 to S6 region) by using a synthetic miR-205 mimic (+ miRNA 205) co-transfected with wild-type (LUC-lncRNA) or mutated (LUC-lncRNA-S3-S6M) constructs of lncRNA-PNUTS cloned into the 3'-UTR of the luciferase reporter gene. For each condition, assays were normalized to Renilla reporter gene expression. (mean ± s.d., n= 7 independent experiments per condition, two-tailed Student t test, ***p<0.001, NS, not significant). (b) Dual-Luciferase reporter assay of miR-205 bioavailability in A549 and NMuMG cells overexpressing wild-type (lncRNA) or mutated (lncRNAS1-6M) constructs of lncRNA-PNUTS. TGFβ treatment and hnRNP E1 knockdown (E1KD) were used as internal controls. For each condition, assays were normalized to Renilla reporter gene expression. (mean ± s.d., n= 4 independent experiments per condition, two-tailed Student t test, **p<0.01; ***p<0.001, NS, not significant). (c) The wild-type (REN-3'-UTR-ZEB1) 3'-UTR of ZEB1 cloned into the 3'-UTR of the Renilla gene was transfected in A549 and NMuMG cells overexpressing wild-type (lncRNA) or mutated (lncRNAS1-6M) constructs of lncRNA-PNUTS and treated +/− synthetic miR-205 mimic or TGFβ for 3 days. Mutated construct (REN-3'-UTR-ZEB1-mut(205)) for the miR-205 binding site located in the 3'-UTR of ZEB1 was also used. TGFβ was used as a positive control. For each condition, assays were normalized to Luciferase reporter gene expression. (mean ± s.d., n= 4 independent experiments per condition, two-tailed Student t test, **p<0.01; ***p<0.001, NS, not significant). (d) The wild-type (prom-CDH1-WT) proximal promoter of E-Cadherin driving the luciferase reporter gene expression was transfected in A549 cells overexpressing wild-type (lncRNA) or mutated (lncRNAS1-6M) constructs of lncRNA-PNUTS and treated or not with synthetic miR-205 mimics or TGFβ for 3 days. Mutated construct for both E2 Boxes 1 and 3 (Prom-CDH1-mEboxes) located on the promoter was also used. TGFβ was used as a positive control. For each condition, assays were normalized to Renilla reporter gene expression. (mean ± s.d., n= 4 independent experiments per condition, two-tailed Student t test, *p<0.05; **p<0.01; ***p<0.001, NS, not significant).
Figure 6
Figure 6. LncRNA-PNUTS promotes tumor initiation/growth and metastasis in vivo
(a) Bright-field microscopy pictures of in vitro mammosphere/oncosphere formation assay in NMuMG and A549 cells overexpressing empty vector (CTRL), lncRNA-PNUTS (lncRNA) or mutated lncRNA-PNUTS (lncRNAS1-6M). Scale bar: 20µM (b) Absolute quantification of the sphere numbers obtained in (a). (mean ± s.d., n=5 independent experiments, two-tailed Student t test, ***p<0.001 NS, not significant). Source data are available in Supplementary table 2. (c) Number of tumor formed upon limiting dilution injection of control and lncRNA-PNUTS overexpressing MDA-468 cells. MDA-MB-468 cells were injected into the mammary fat pads of 6–8 week-old female mice in limiting dilution. TIC, tumor-initiating cells number was determined using ELDA software. Number of mice used for each condition is indicated. (d) Flow cytometry analysis of CD24/CD44 cell surface expression levels in the epithelial (CD44/CD24+ sorted cells) and mesenchymal (CD44+/CD24 sorted cells) HMLE subpopulations. (e) Cell morphology observed by phase-contrast microscopy. Scale bar: 50µM. (f) RT-PCR analysis of lncRNA-PNUTS expression level in mesenchymal and epithelial sorted HMLE cells. (g) Flow cytometry analysis of the CD24/CD44 cell surface expression levels in the epithelial (CD44/CD24+ sorted cells) HMLE subpopulation expressing empty vector (control) or overexpressing lncRNA-PNUTS. (h)Tumor weight of primary tumors obtained following mammary fat pad injection of MDA-231-LM2 expressing scrambled control (SCR) or lncRNA-PNUTS targeting shRNA (shRNA) in NOD/SCID mice. (mean ± s.d., n= 4 mice per condition, two-tailed Mann-Whitney test, p=0.08570). Source data are available in Supplementary table 2. (i) (Left) Histopathological analysis of paraffin-embedded lung serial sections of mice injected in the mammary fat pad with MDA-231-LM2 expressing scrambled or lncRNA-PNUTS targeting shRNA. Haematoxylin and Eosin (H&E) staining and immunostaining of Ki67 protein was performed in serial lung sections to identify macro- and micro-metastases. (Right) Photographs of primary tumors and of a representative lung collected for each condition. Scale bar: 500 µM

Comment in

References

    1. Jemal A, et al. Global cancer statistics. CA. Cancer J. Clin. 2011;61:69–90. - PubMed
    1. Chaffer CL, Weinberg RA. A perspective on cancer cell metastasis. Science. 2011;331:1559–1564. - PubMed
    1. Gupta GP, Massagué J. Cancer metastasis: building a framework. Cell. 2006;127:679–695. - PubMed
    1. Weigelt B, Peterse JL, van’t Veer LJ. Breast cancer metastasis: markers and models. Nat. Rev. Cancer. 2005;5:591–602. - PubMed
    1. Dhamija S, Diederichs S. From junk to master regulators of invasion: lncRNA functions in migration, EMT and metastasis. Int. J. Cancer. 2016;139:269–280. - PubMed

MeSH terms