. 2017 Sep;19(9):1071-1080.
doi: 10.1038/ncb3594. Epub 2017 Aug 21.

SMC complexes differentially compact mitotic chromosomes according to genomic context

Affiliations

SMC complexes differentially compact mitotic chromosomes according to genomic context

Stephanie Andrea Schalbetter et al. Nat Cell Biol. 2017 Sep.

Abstract

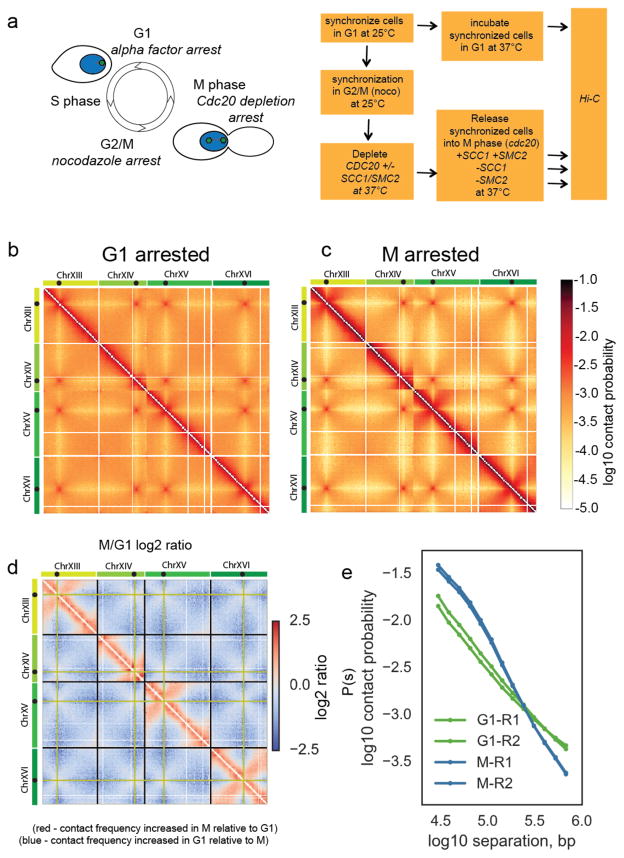
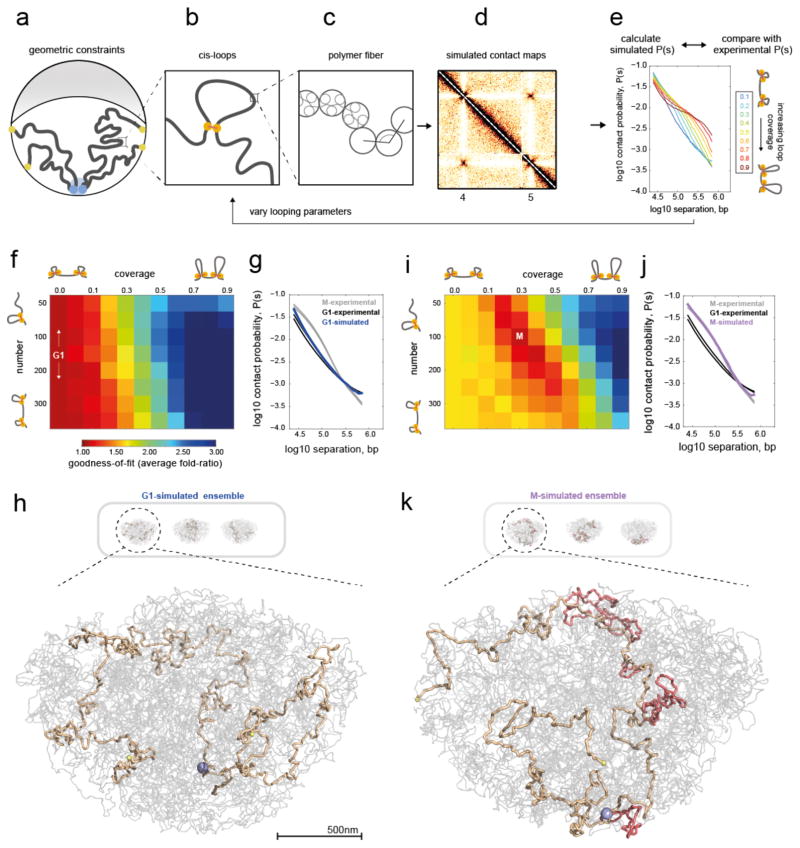
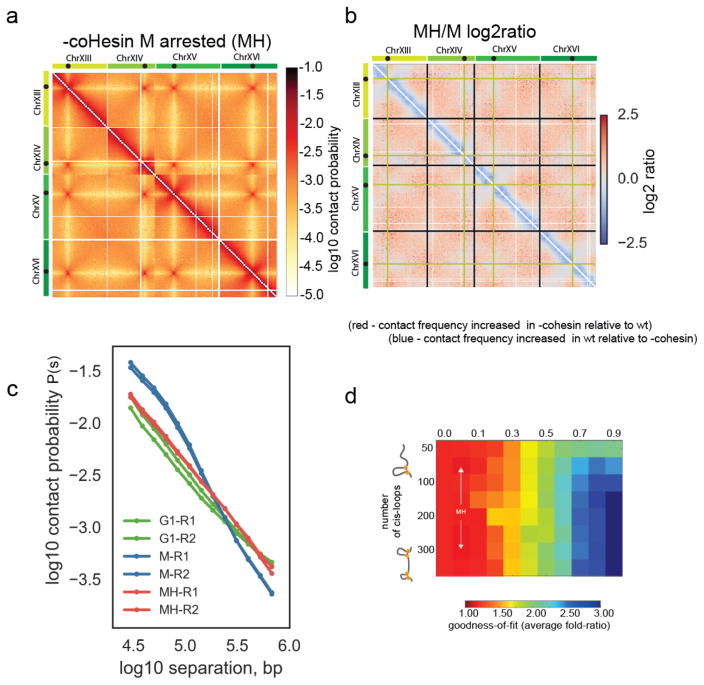
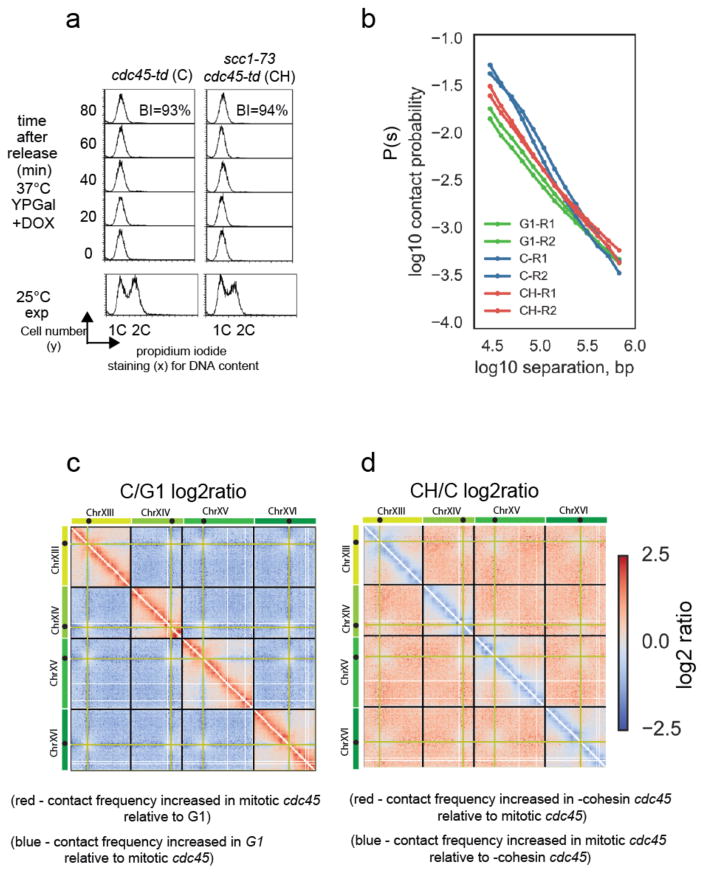
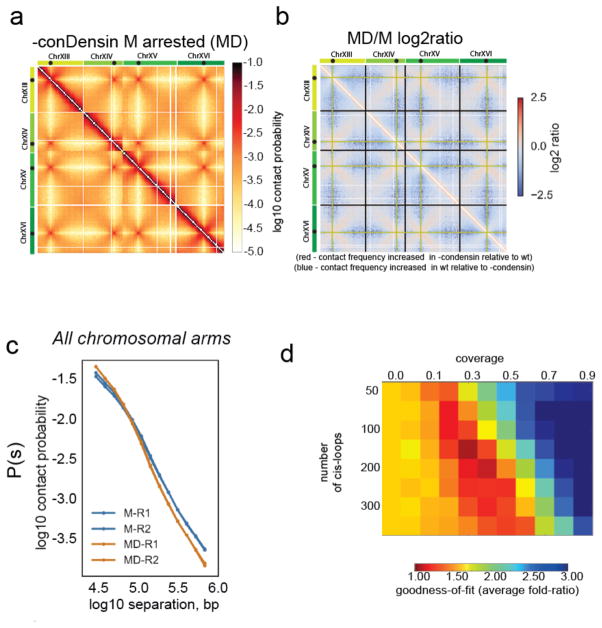
Structural maintenance of chromosomes (SMC) protein complexes are key determinants of chromosome conformation. Using Hi-C and polymer modelling, we study how cohesin and condensin, two deeply conserved SMC complexes, organize chromosomes in the budding yeast Saccharomyces cerevisiae. The canonical role of cohesin is to co-align sister chromatids, while condensin generally compacts mitotic chromosomes. We find strikingly different roles for the two complexes in budding yeast mitosis. First, cohesin is responsible for compacting mitotic chromosome arms, independently of sister chromatid cohesion. Polymer simulations demonstrate that this role can be fully accounted for through cis-looping of chromatin. Second, condensin is generally dispensable for compaction along chromosome arms. Instead, it plays a targeted role compacting the rDNA proximal regions and promoting resolution of peri-centromeric regions. Our results argue that the conserved mechanism of SMC complexes is to form chromatin loops and that distinct SMC-dependent looping activities are selectively deployed to appropriately compact chromosomes.


Conflict of interest statement

Competing Financial Interests

The authors declare no competing financial interests.

Figures

Figure 1
Figure 1. Budding yeast chromosomes are compacted in mitosis
a) Experimental procedure to synchronize cells in either G1 or M, with and without cohesin and condensin. Green spots in cartoon on the yeast nucleus (blue) represent spindle pole bodies. b) Hi-C contact heatmap from G1 cells synchronously arrested at 37°C with alpha factor. The Hi-C contact map for chromosomes XIII to XVI is shown as representative of the whole genome. Contact maps for each condition were assembled from two independent experiments. Side bars show relative size of chromosomes XIII, XIV, XV and XVI with black dots on chromosomes showing locations of centromeres on each chromosome. c) Hi-C contact heatmap from cells arrested in M phase by depletion of Cdc20 at 37°C. Both Hi-C maps have been normalized by iterative correction at 10kb resolution. Heatmap colour scale represents log10 number of normalized contacts. The Hi-C contact map for chromosomes XIII to XVI is shown as representative of the whole genome. d) Log2 (M/G1) ratio of the data displayed in b and c. Regions where contact frequency was higher in M than G1 are shown in red, regions where contact frequency was lower in M than G1 in blue. Black guidelines show ends of chromosomes. Pale green lines indicate the bin containing the centromere. e) Contact probability, P(s), as a function of genomic separation, s, for G1 and M phase cells averaged over all chromosomes. The P(s) from each of the two independent experiments for each condition are shown.
Figure 2
Figure 2. Polymer simulations of the yeast genome support compaction by intra-chromosomal loops in mitosis
a–e) Overview of simulations. a) Illustration of geometric constraints used in simulations: confinement to a spherical nucleus, clustering of centromeres (blue), localization of telomeres to the nuclear periphery (yellow), and exclusion of chromatin from the nucleolus (grey crescent). b) Intra-chromosomal (cis-) loops, generated with a specified coverage and number per yeast genome. c) Chromatin fiber, simulated as a flexible polymer. d) Simulated contact maps are generated in simulations with the above constraints. e) P(s) curves are then calculated from simulated contact maps. Simulations are run with systematically varied cis-loop parameters (coverage and number of loops), and the resulting P(s) curves are compared with experimental data. Shown here are P(s) curves for 150 loops, and a range of coverage. f) Goodness-of-fit for simulated versus experimental intra-arm P(s) in G1. Goodness-of-fit represents the average fold deviation between simulated and experimental P(s) curves, best-fitting values indicated with white text. The coverage=0.0 column represents the fit for simulations without intra-chromosomal loops. g) P(s) for best-fitting G1 simulations (coverage=0.0, i.e. no-loops) versus P(s) for each experimental replica of G1 and M. h) Three sample conformations from ensemble generated in the no-loops simulations; one chromosome highlighted in light brown (from left to right: XI, V, III), with its centromere in blue, telomeres in yellow, and the rest of the genome in grey. Selected conformations show at higher zoom. i) as F, but for experimental M Hi-C. j) Best-fitting simulated P(s) for M has N=100–150, coverage=0.3–0.4. k) Conformations for (N=100, coverage=0.3) with cis-loops additionally highlighted in light red.
Figure 3
Figure 3. Cohesin activity is required for mitotic compaction and cis-looping
a) Hi-C data collected from M phase cells following disruption of coHesin using the scc1-73 allele (MH). Chromosomes XIII to XVI are shown as representative of the whole genome. Contact maps were assembled from two independent experiments. b) Log2 ratio of –cohesin MH dataset over wt M dataset (MH/M), displayed in 3a and 1c, respectively. c) Contact probability (P(s)) for wt metaphase M and cohesin depleted metaphase cells MH phase cells and G1 cells averaged over all chromosomes. The P(s) from each of the two independent experiments for each condition are shown. d) Goodness-of-fit for models with variable cis-loop coverage (horizontal axis) and number (vertical axis). Best fitting parameter region indicated by arrows emanating from MH.
Figure 4
Figure 4. Mitotic cohesin-dependent conformational changes are independent of sister chromatid cohesion
a) FACS analysis of DNA content and budding analysis of cdc45-td (C) and cdc45-td scc1-73 (CH) cells following release from G1 arrest into a nocodazole enforced mitotic block. Budding index (BI) confirmed that mitotic cells had activated CDK while FACS of DNA stained cells confirmed no DNA replication has taken place. Representative images shown from one of two independent experiments comparing C to CH. b) Contact probability, P(s) versus genomic separation, s, for Hi-C of mitotic cdc45-td (C) mitotic cdc45-td scc1-73 (CH), and wt G1 cells (G1). The P(s) from each of the two independent experiments for each condition are shown. c) Log2 ratio of C (cdc45 depleted cells arrested in mitosis with nocodazole) contact dataset over G1 dataset (C/G1). Contact maps for ratio plot were assembled from two independent experiments for each condition. d) Log2 ratio of –cohesin C dataset over C dataset (CH/C).
Figure 5
Figure 5. Condensin action is not required for mitotic cis-looping along chromosome arms
a) Hi-C data collected from M phase cells following disruption of conDensin with smc2td GAL1-smc2K38I allele (MD). Chromosomes XIII to XVI are shown as representative of the whole genome. Contact maps were assembled from two independent experiments. b) Log2 ratio of –condensin M dataset over wt M dataset (MD/M) c) Contact probability (P(s)) for M and MD cells. The P(s) from each of the two independent experiments for each condition are shown. d) Goodness-of-fit for simulated versus experimental intra-arm P(s), as in Figure 2, for conDensin depleted cells.
Figure 6
Figure 6. Pre-anaphase condensin activity is focused on centromeres and proximal to the rDNA repeats
a, b) Pile-ups of the contact heat-maps of the 100kb peri-centromeric regions a) in cis or b) in trans on either side of budding yeast CEN sequences. Bottom, log2 ratio of the different pile-ups in the mitotically arrested state. c) Hi-C contact heat maps of ChrXII in M or MD. In the cartoon representation, ChrXII is separated into three regions, the pre-CEN region (grey), the region between CEN and the rDNA repeats (yellow) and post-rDNA (orange). d) Log2 ratio of MD over M dataset (MD/M) for ChrXII. e) Contact probability (P(s)) for M and MD cells for all chromosomes (taken from 5c) compared to contact probability (P(s)) of the pre-rDNA region and post-rDNA region of ChrXII for M and MD cells.

Comment in

References

    1. Bickmore WA, van Steensel B. Genome architecture: domain organization of interphase chromosomes. Cell. 2013;152:1270–1284. - PubMed
    1. Dekker J, Mirny L. The 3D Genome as Moderator of Chromosomal Communication. Cell. 2016;164:1110–1121. - PMC - PubMed
    1. Hadjur S, et al. Cohesins form chromosomal cis-interactions at the developmentally regulated IFNG locus. Nature. 2009;460:410–413. - PMC - PubMed
    1. Fudenberg G, et al. Formation of Chromosomal Domains by Loop Extrusion. CellReports. 2016;15:2038–2049. - PMC - PubMed
    1. Sanborn AL, et al. Chromatin extrusion explains key features of loop and domain formation in wild-type and engineered genomes. Proceedings of the National Academy of Sciences. 2015;112:E6456–65. - PMC - PubMed

MeSH terms