

doi: 10.1038/nmeth.4401.
Epub 2017 Aug 21.
chromVAR: inferring transcription-factor-associated accessibility from single-cell epigenomic data
Affiliations
- PMID: 28825706
- PMCID: PMC5623146
- DOI: 10.1038/nmeth.4401
Item in Clipboard
chromVAR: inferring transcription-factor-associated accessibility from single-cell epigenomic data
Nat Methods.
2017 Oct.
Abstract
Single-cell ATAC-seq (scATAC) yields sparse data that make conventional analysis challenging. We developed chromVAR (http://www.github.com/GreenleafLab/chromVAR), an R package for analyzing sparse chromatin-accessibility data by estimating gain or loss of accessibility within peaks sharing the same motif or annotation while controlling for technical biases. chromVAR enables accurate clustering of scATAC-seq profiles and characterization of known and de novo sequence motifs associated with variation in chromatin accessibility.
Conflict of interest statement
J.D.B. and W.J.G. are listed as inventors on a patent for the ATAC- seq method. W.J.G. is a scientific cofounder of Epinomics.
Figures
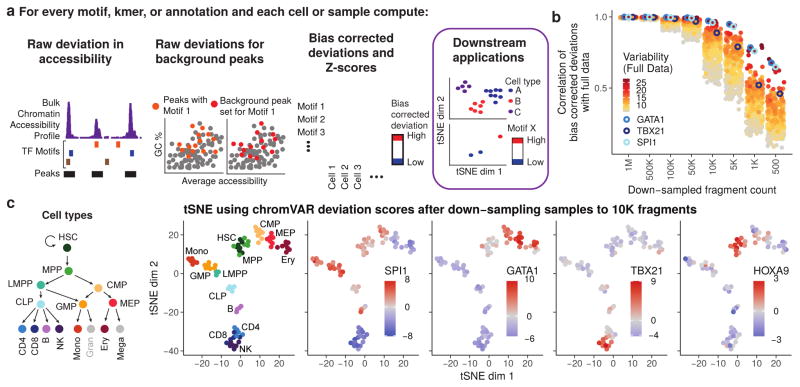
(a) Schematic illustrating how chromVAR uses aggregation of accessibility across peaks sharing a common feature (e.g. a motif) with bias correction to generate scores for each cell or sample that can be used for downstream analysis (b) Pearson correlation of bias corrected deviations for 77 samples from different hematopoietic populations before and after downs down-sampling total sequencing reads from full data. Each point shows the correlation for a different motif. The top 20% most variable motifs are shown. Three of the most variable motifs are highlighted. (c) tSNE visualization of different samples using normalized deviations calculated from data down-sampled to 10,000 fragments per sample. In the first panel, cells are colored by cell type, and in other panels cells are colored by the deviations score for different motifs.
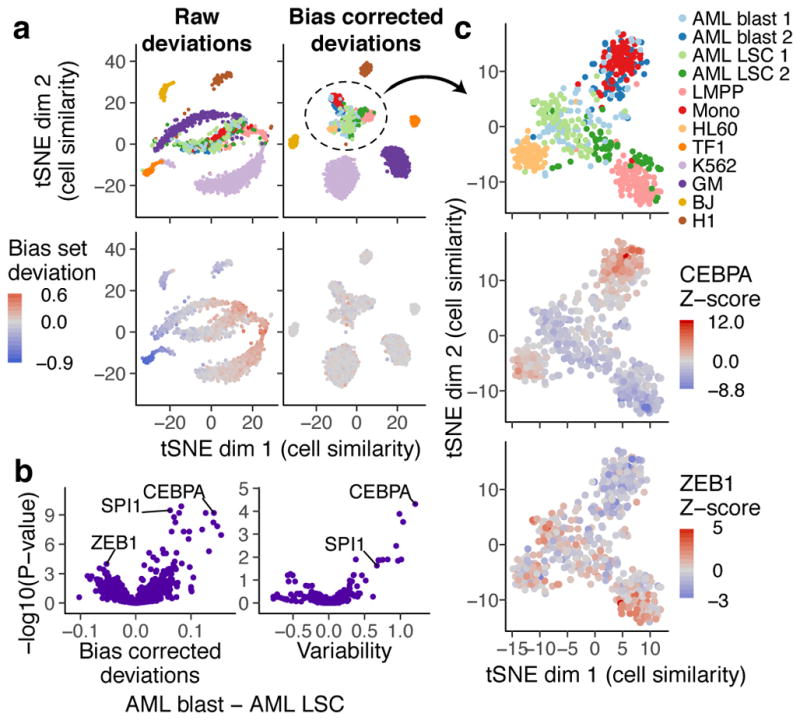
(a) tSNE visualization of similarity of 1561 single cells based on chromVAR raw (left) or bias corrected deviations (right) for motifs and 7mers (see methods). In top panels, points are colored by cell type and in bottom panels points are colored by raw (left) or bias corrected (right) calculated deviations for a set of random peaks with high GC content and high average accessibility (the bias set). (b) Volcano plot showing the mean difference in bias corrected accessibility deviations (left) and variability (right) for each motif between the AML blast (n = 122) and LSC cells (n = 144) versus the −log10(P-value) for that difference. (c) tSNE with bias corrected deviations for AML blast and LSC, monocyte, LMPP, and HL60 cells (n = 509). In top panel, points are colored by cell type, and in other panels points are colored by deviation Z-scores for CEBPA and ZEB1 respectively.
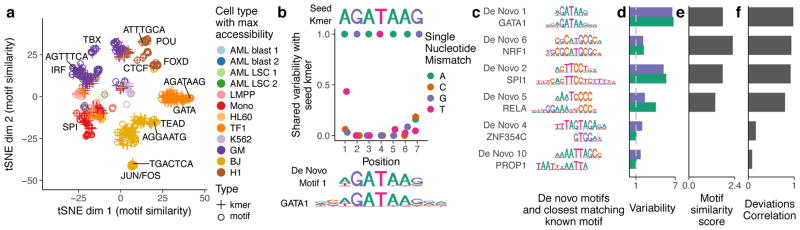
(a) tSNE visualization of similarity between motifs and kmers based on the vector of normalized deviations across different cells. Labels highlight predominant families of motifs within a cluster and example kmers (b) For the seed kmer “AGATAAG”, the shared variability of k-mers with one mismatch from the seed kmer. The shared variability is defined as the square of the covariance of the deviation z-scores for the two kmers divided by the variance of the seed kmer for covariances greater than zero, and zero otherwise. These shared variabilities were used to assemble a de novo motif, shown under the plot along with the GATA1 motif. (c) Example de novo motifs assembled by chromVAR using deviations scores for 7-mers, along with the closest matching known motif below it. (d) Variability for both the de novo motif and the known motif for each pair in panel (c). (e) Motif similarity score (see methods) between the de novo motif and the known motifs in (c) (f) The Pearson correlation between the normalized deviations of the de novo motif and the known motif for each pair in (c).
References
MeSH terms
Substances
Grants and funding
LinkOut - more resources
Full Text Sources
Other Literature Sources
Molecular Biology Databases
