. 2017 Sep;23(9):1102-1111.
doi: 10.1038/nm.4386. Epub 2017 Aug 21.

Sex-specific transcriptional signatures in human depression

Affiliations

Sex-specific transcriptional signatures in human depression

Benoit Labonté et al. Nat Med. 2017 Sep.

Erratum in

  • Corrigendum: Sex-specific transcriptional signatures in human depression.
    Labonté B, Engmann O, Purushothaman I, Menard C, Wang J, Tan C, Scarpa JR, Moy G, Loh YE, Cahill M, Lorsch ZS, Hamilton PJ, Calipari ES, Hodes GE, Issler O, Kronman H, Pfau M, Obradovic ALJ, Dong Y, Neve RL, Russo S, Kasarskis A, Tamminga C, Mechawar N, Turecki G, Zhang B, Shen L, Nestler EJ. Labonté B, et al. Nat Med. 2018 Apr 10;24(4):525. doi: 10.1038/nm0418-525d. Nat Med. 2018. PMID: 29634684

Abstract

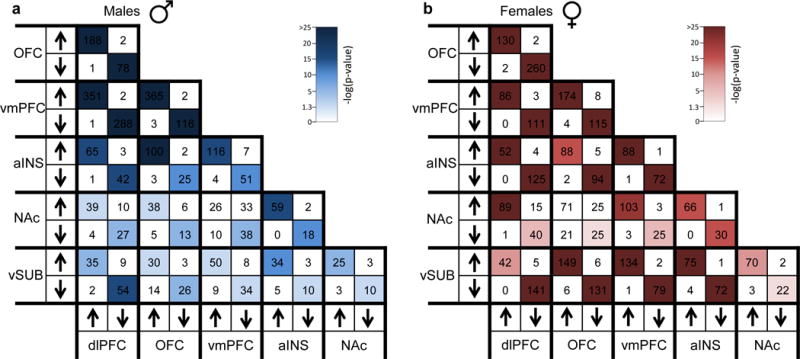
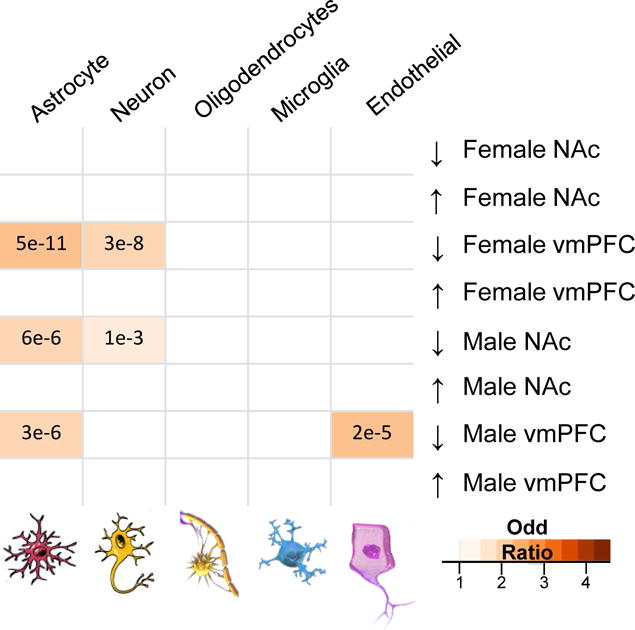
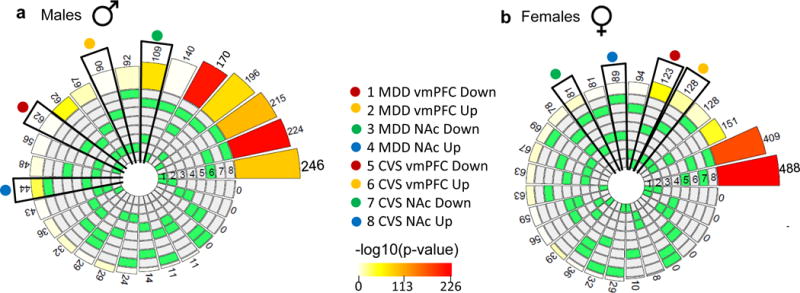
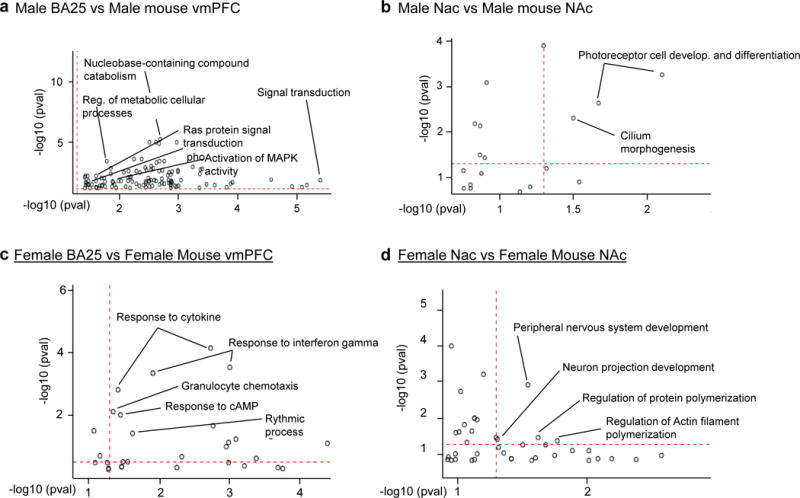
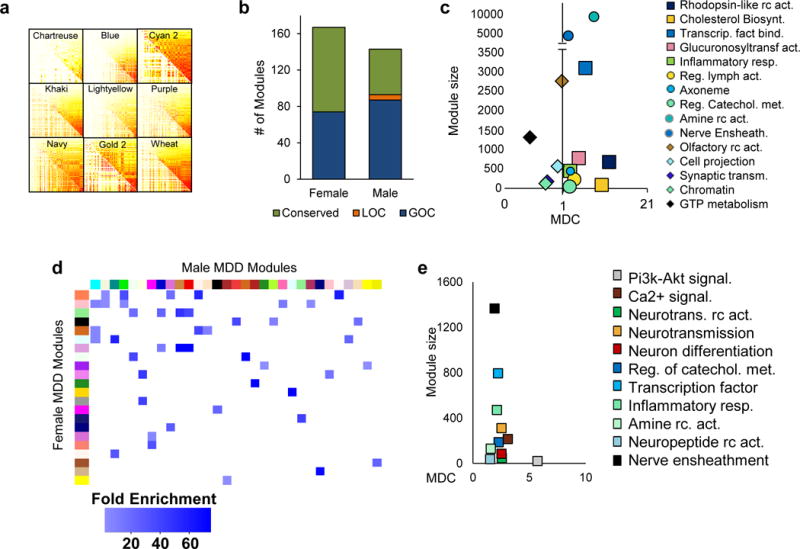
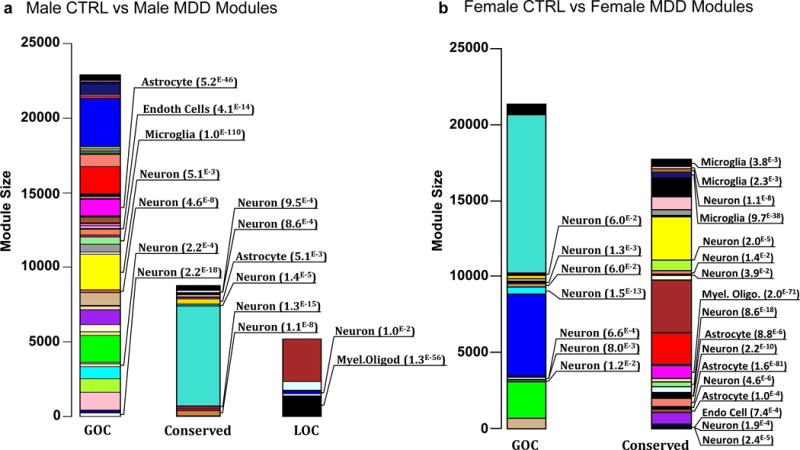
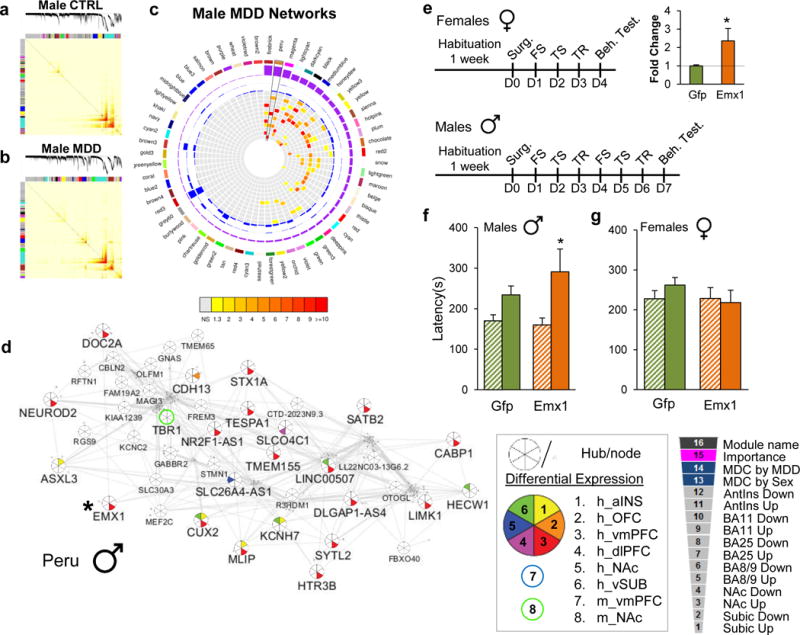
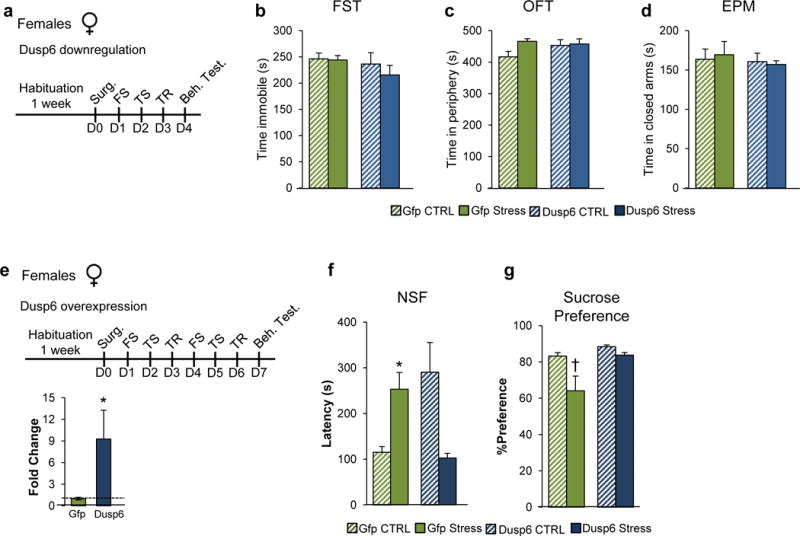
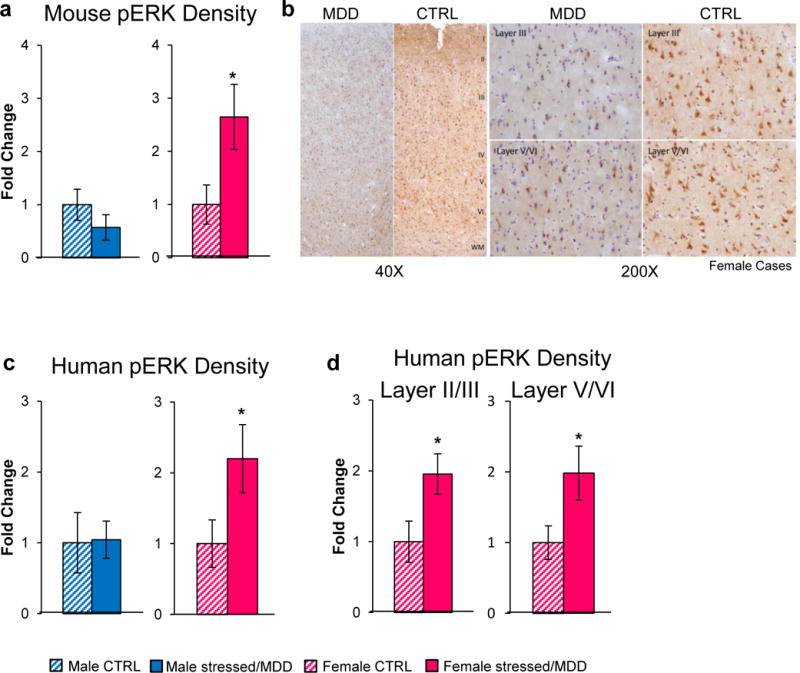
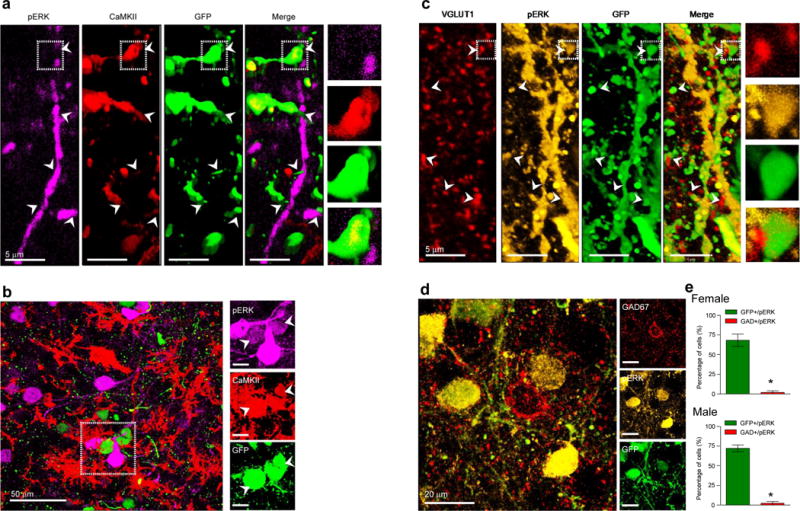
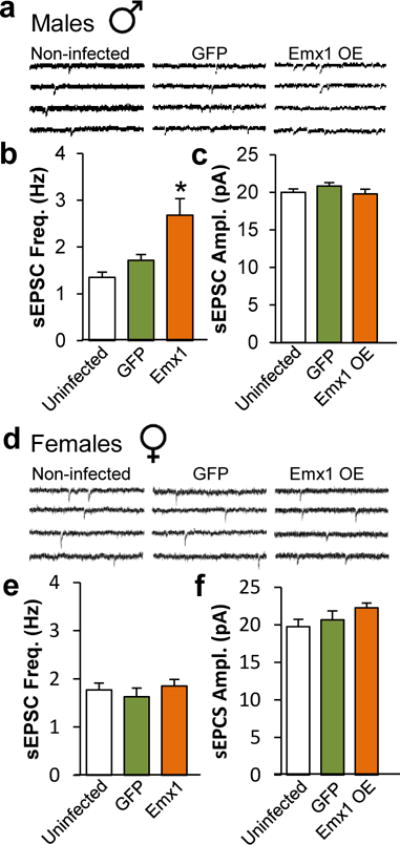
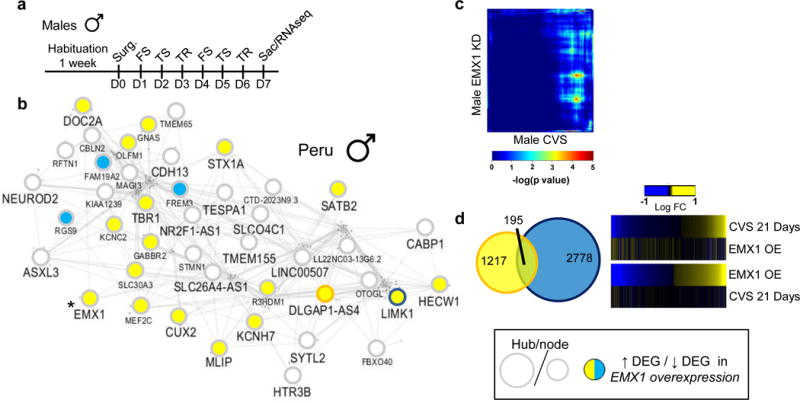
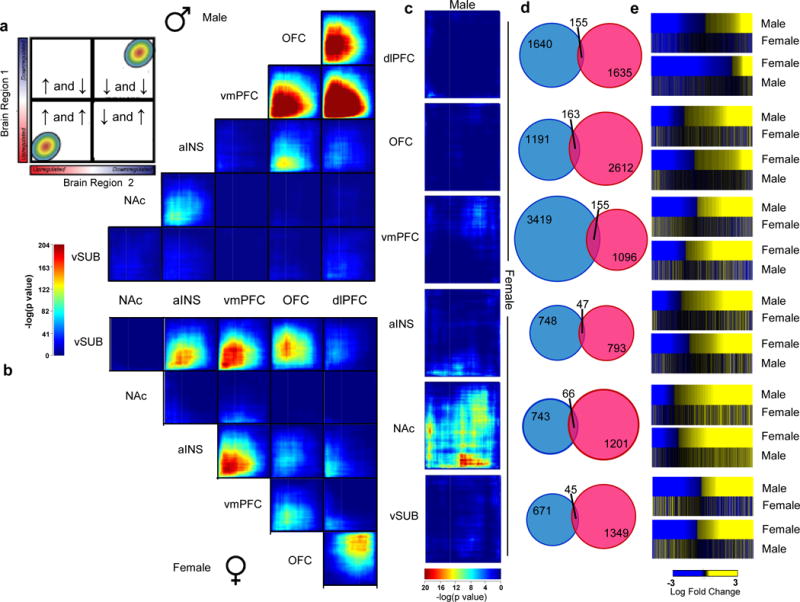
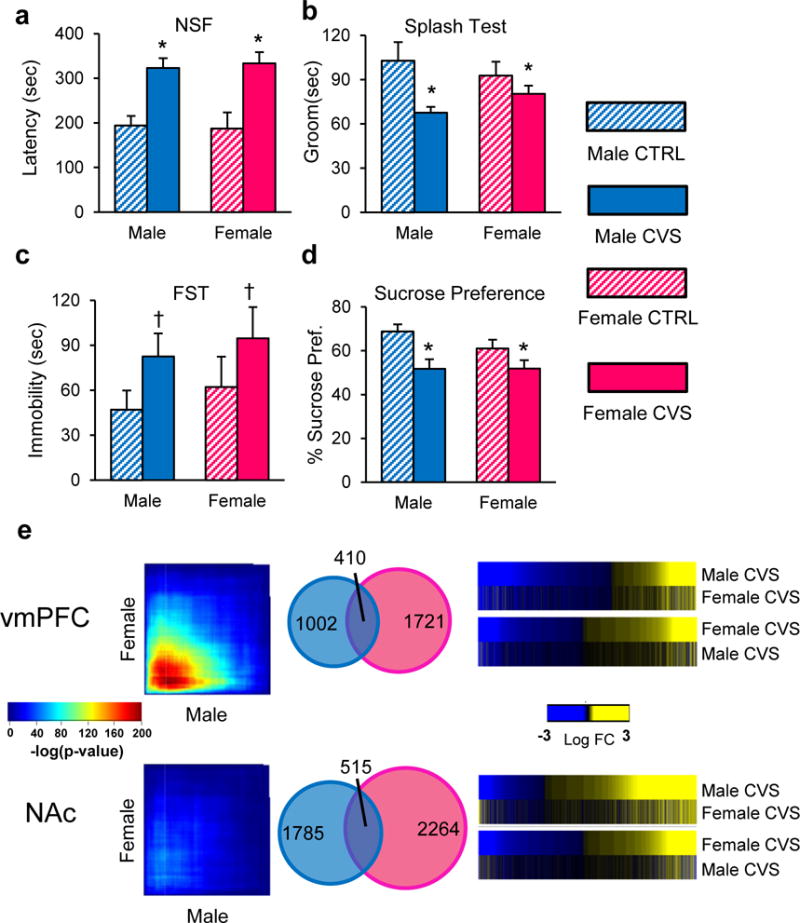
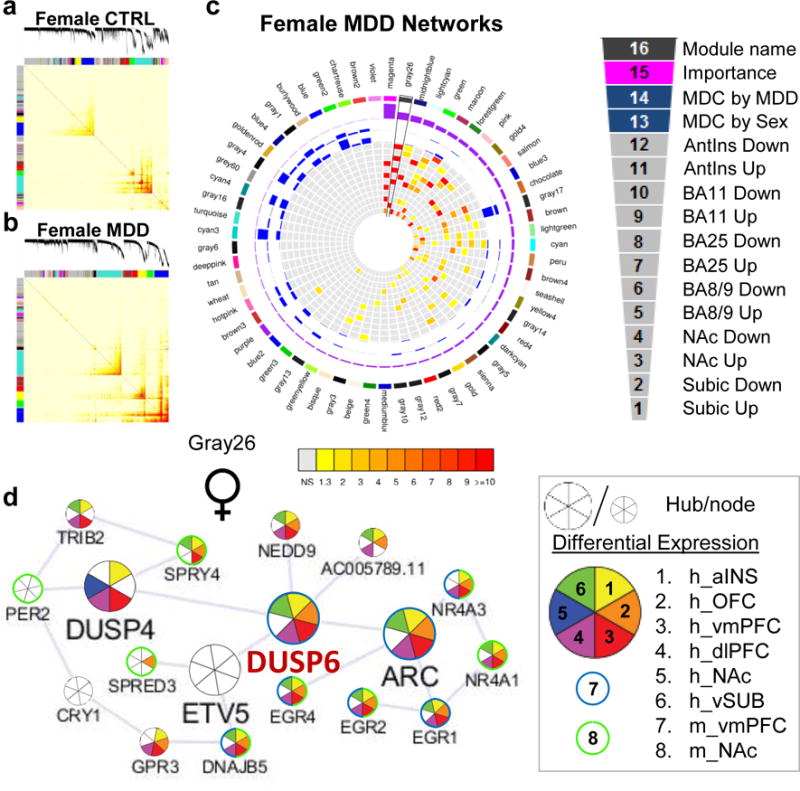
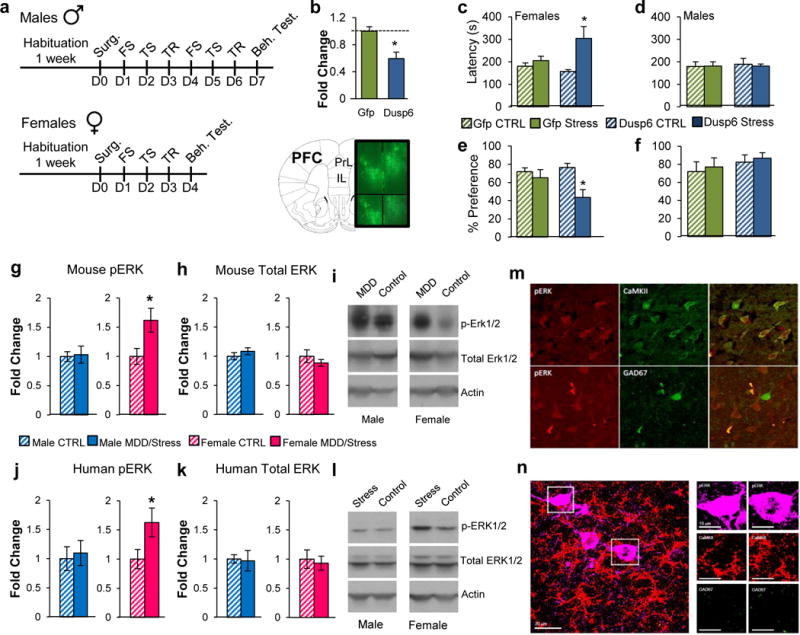
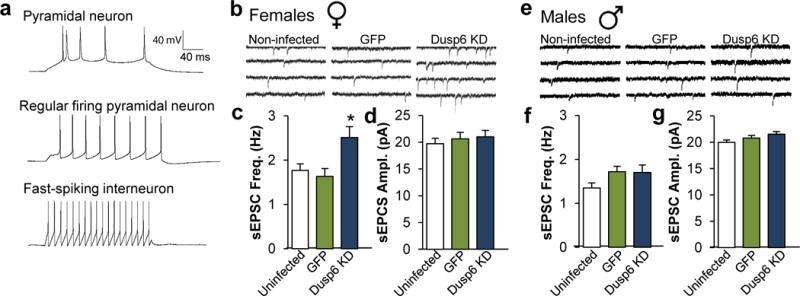
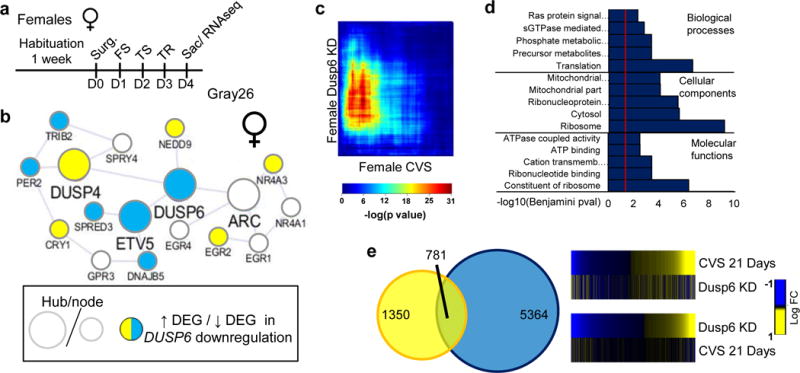
Major depressive disorder (MDD) is a leading cause of disease burden worldwide. While the incidence, symptoms and treatment of MDD all point toward major sex differences, the molecular mechanisms underlying this sexual dimorphism remain largely unknown. Here, combining differential expression and gene coexpression network analyses, we provide a comprehensive characterization of male and female transcriptional profiles associated with MDD across six brain regions. We overlap our human profiles with those from a mouse model, chronic variable stress, and capitalize on converging pathways to define molecular and physiological mechanisms underlying the expression of stress susceptibility in males and females. Our results show a major rearrangement of transcriptional patterns in MDD, with limited overlap between males and females, an effect seen in both depressed humans and stressed mice. We identify key regulators of sex-specific gene networks underlying MDD and confirm their sex-specific impact as mediators of stress susceptibility. For example, downregulation of the female-specific hub gene Dusp6 in mouse prefrontal cortex mimicked stress susceptibility in females, but not males, by increasing ERK signaling and pyramidal neuron excitability. Such Dusp6 downregulation also recapitulated the transcriptional remodeling that occurs in prefrontal cortex of depressed females. Together our findings reveal marked sexual dimorphism at the transcriptional level in MDD and highlight the importance of studying sex-specific treatments for this disorder.


Figures

Extended Figure 1
Extended Figure 1
Degree of overlap for genes significantly differentially expressed in a, males with MDD and b, females with MDD across brain regions. Arrows on x and y axis correspond to directionality of gene expression changes across brain regions and numbers within squares highlight the number of overlapping genes. Colors within squares represent the −log(corrected Fisher’s Exact test p value) of the enrichment across brain regions which is depicted in the color key.
Extended Figure 2
Extended Figure 2
Cell-type specific enrichment for genes differentially expressed in males and females after 21 days of CVS. Numbers in boxes represent the corrected Fisher’s Exact Test p-values of the enrichment. Colors of boxes represent the odds ratio of the cell type enrichment and is depicted in the color bar. Cell types considered in this analysis include astrocytes, neurons, myelinated oligodendrocytes, microglia and endothelial cells.
Extended Figure 3
Extended Figure 3
Degree of overlap in the vmPFC and NAc for genes differentially expressed in humans with MDD and mice subjected to 21 days of CVS in a, males and b, females. Green squares in the circos plots represent the two conditions that are compared which are listed below each plot. The size of the bars surrounding the circos plots corresponds to the number of overlapping genes which are also listed for every comparison, and the intensity of the color corresponds to the −log(corrected Fisher’s Exact Test p-value) of the enrichment across conditions as depicted in the color key between circos plots.
Extended Figure 4
Extended Figure 4
Degree of overlap for gene ontology (GO) terms significantly associated with MDD in humans and 21 days of CVS in mice in the vmPFC and NAc. a, GO terms significantly overlapping in the vmPFC of males with MDD and stressed male mice. b, GO terms significantly overlapping in the NAc of males with MDD and stressed male mice. c, GO terms significantly overlapping in the vmPFC of females with MDD and stressed female mice. d, GO terms significantly overlapping in the NAc of females with MDD and stressed female mice. For each graph, the y axis represents the level of significance (−log pvalue) of the enrichment for GO terms in humans and the x axis represents the level of significance (−log pvalue) of the enrichment for GO terms in mice. The dotted red line marks the threshold of significance (p<0.05).
Extended Figure 5
Extended Figure 5
Multi brain region gene co-expression network analysis in humans reveals distinct sex-specific transcriptional signatures in males and females with MDD. a, Individual topological overlap covariance matrices of the top 9 differentially connected modules (FDR<0.1) in males and females with MDD (upper right triangle of each module) vs. that in the control state (lower left triangle of each module). b, Proportion of modules differentially connected (FDR<0.1) (blue: gain of connectivity [GOC], green: conserved connectivity, and orange: loss of connectivity [LOC]) in males and females with MDD vs. controls. The x axis represents the number of modules in every category. c, Most significant enrichment of functional categories in modules showing GOC (square) or LOC (circle) in males with MDD, and GOC (diamond) in females with MDD. The y axis denotes the number of genes per module, whereas the x axis represents module differential connectivity (MDC) values. d, Modules in male MDD that share high levels (corrected Fisher’s Exact Test<0.05; fold enrichment>15) of conservation in females with MDD. Modules are defined by an arbitrary color in female MDD (y axis) and male MDD (x axis). Enrichment (fold enrichment) is defined by the darkness of the blue color with paler blue representing lower enrichment (minimum 15) and darker blue representing higher enrichment. e, Gene ontology (GO) terms associated with male MDD modules sharing high levels of homology with female MDD modules showing a GOC (square). The y axis denotes the number of genes per module, whereas the x axis represents MDC values.
Extended Figure 6
Extended Figure 6
Modules in males and females with MDD are enriched for cell-type specific genes. Stacked bar graphs showing modules enriched for genes expressed in particular cell types in a, male MDD and b, female MDD. The y axis represents module size defined by number of genes within each module. Modules are defined by an arbitrary color name and are clustered by module differential connectivity (MDC) as gain of connectivity (GOC), loss of connectivity (LOC) and conserved. There is no module associated with a LOC in females with MDD. Enrichment is determined by corrected Fisher’s Exact Test p-value and is listed only for modules that reached significance (FDR p<0.05).
Extended Figure 7
Extended Figure 7
Gene co-expression modules in males with MDD are enriched for DEGs across brain regions. a, Topological overlap matrix (TOM) plots for control and b, MDD modules in males. Light color represents low topological overlap and progressively darker red color represents higher overlap. Each module is assigned by a unique color. c, Circos plots displaying the degree of enrichment for DEGs (p<0.05) in male modules. Colors within squares of the plots represent the corrected Fisher’s Exact Test p-value of the enrichment across modules which are depicted in the color bar below the circos plot. Legend on the bottom right corner defines individual layers of the circos plot. d, Peru module in male MDD shows enrichment for DEGs across brain regions. Hubs and nodes are defined by the size of the pie charts with colors representing enrichment for DEGs across brain regions (depicted in the bottom right panel). The star highlights EMX1, which was selected for sex-specific in vivo phenotypic validation studies. e, Schematic representation of the behavioral paradigm used to assess the impact of EMX1 overexpression in the vmPFC of males and females. Bar graph shows the HSV-mediated overexpression of EMX1 covering the infra- and prelimbic region of vmPFC in male mice. f, Behavioral consequence of EMX1 overexpression in the novelty-supressed feeding (NSF) test in males and g, females. Significance in tests e was determined using student independent sample t-test and in f–g using two-way ANOVA with Tuckey correction. e n=5/condition, f–g n=10/condition. Bars, mean ± sem; * p<0.05.
Extended Figure 8
Extended Figure 8
a, Schematic representation of the behavioral paradigm used to assess the impact of DUSP6 downregulation in the vmPFC of females. Behavioral consequences of DUSP6 downregulation in female vmPFC in the b, forced swim test (FST), c, open field test (OFT), and d, elevated plus maze (EPM). e, Schematic representation of the behavioral paradigm used to assess the impact of DUSP6 overexpression in females following sub-chronic variable stress. Bottom graph shows the HSV-mediated overexpression of DUSP6 covering the infra- and prelimbic region of the vmPFC in mice. Behavioral consequences of DUSP6 viral overexpression in the f, novelty-supressed feeding test (NSF) and g, sucrose preference test. Significance in tests e was determined using independent sample t-test while significance in b–d and f–g was determined using two-way ANOVA with Tuckey correction. b–d n =7/condition, e n=5/condition, f–g n=10/condition. Bars, mean ± sem; * p<0.05.
Extended Figure 9
Extended Figure 9
Females with MDD show elevated levels of phospho-ERK1/2 in PFC. a, Quantitative assessment of phospho-ERK1/2 levels measured by IHC in male (blue) and female (pink) mice with and without stress (21 days CVS). b, Representative image of phospho-ERK1/2 DAB staining across PFC cortical layers in postmortem brains (BA11) from females with MDD and healthy control (40×). Right panels show the layer specificity of the effects at a larger magnification (200×). c, Quantification of phospho-ERK1/2-reactive cell density in males (blue) and females (pink) with and without MDD. d, Layer specific (layers II/III and layers V/VI) quantification of phospho-ERK1/2-reactive cell density in females with and without MDD. Significance in tests a, c–d was determined using independent sample t-tests. a n=6–7 cells/condition, c–d n=4/condition. Bars, mean ± sem; * p<0.05.
Extended Figure 10
Extended Figure 10
Viral downregulation of DUSP6 in vmPFC increases phospho-1/2 levels in glutamatergic but not GABAergic cells in both males and females. Phospho-ERK1/2 staining in both male and female mice co-localizes in the dendrites of a, CaMKII (red) and c, VGlut1-reactive pyramidal cells. Outer boxes highlight the degree of co-localization of phospho-ERK1/2 in a, CaMKII and c, VGlut1 expressing cells at the synaptic level within virally DUSP6 KD-infected pyramidal cells. b, phospho-ERK1/2 staining in both male and female mice co-localizes in the soma of b, CamKII (red) but not d, GAD67 cells. Outer boxes in b highlight the degree of somatic co-localization of phospho-ERK1/2 in CaMKII expressing cells within virally DUSP6 KD-infected pyramidal cells. e, Quantification of HSV-DUSP6 KD-infected cells in the vmPFC showing GAD67 and phospho-ERK1/2 reactivity in females (upper panel) and males (lower panel). Significance in tests e was determined using student independent sample t-test. e n=4/condition. Bars, mean ± sem; * p<0.05.
Extended Figure 11
Extended Figure 11
EMX1 overexpression alters the physiological properties of vmPFC pyramidal neurons in a sex-specific fashion. a, Representative traces of neuronal activity in non-infected, GFP and EMX1-infected pyramidal neurons in male mice vmPFC. b, Quantification of EMX1-induced changes of spontaneous excitatory post-synaptic current (sEPSC) frequency in hertz (Hz) and c, amplitude in picoAmpere (pA) in male vmPFC. d, Representative traces of neuronal activity in non-infected, GFP and EMX1-infected pyramidal neurons in female mice vmPFC. e, Quantification of EMX1 effects on sEPSC frequency and f, amplitude in female vmPFC. Significance in tests b–c and e–f was determined using two-way ANOVA with Tuckey correction. b–c, Male non-infected: n=9 mice and n=32 cells, Male GFP-infected: n=5 mice and n=29 cells, Male EMX1-infected: n=4 and n=27 cells. e–f, Female non-infected: n=10 mice and n=25 cells, Female GFP-infected: n=4 mice and n=17 cells, Female EMX1-infected: n=4 mice and n=28 cells. Bars, mean ± sem; * p<0.05.
Extended Figure 12
Extended Figure 12
EMX1 overexpression in male vmPFC modifies the transcriptional and network structures induced by stress. a, Schematic representation of the behavioral paradigm used to assess the impact of EMX1 overexpression in male mice. b, Transcriptional reorganization of the male-specific Peru gene network by EMX1 viral overexpression in male vmPFC. Hubs and nodes are defined by the size of the circles with colors representing directionality of differential expression in the vmPFC (depicted in the bottom right panel). c, RRHO map directly comparing transcriptional profiles of males after EMX1 overexpression with 21 days CVS males in the vmPFC. Degree of significance is depicted in the color bar below the RRHO map. d, Venn diagrams displaying the overlap between genes differentially expressed (p<0.05) in males after 21 days of CVS (yellow) and males after EMX1 overexpression (blue) in the vmPFC. Heatmaps on the right compare transcriptional changes (log fold change; over the heatmaps) in males after 21 days of CVS and males after EMX1 overexpression in the vmPFC.
Figure 1
Figure 1
Differential expression profiles in humans with MDD reveal distinct sex-specific transcriptional signatures across brain regions. a,b, Rank-rank hypergeometric overlap (RRHO) maps comparing region to region transcriptional profiles in a, males and b, females with MDD. The upper left panel in a displays the overlap relationship across brain regions. The color bar between a and b represents degree of significance. c, RRHO maps directly comparing male and female transcriptional profiles across brain regions. Degree of significance is depicted in the color bar below the RRHO maps. d, Venn diagrams displaying low overlap between genes differentially expressed (p<0.05) in males (blue) and females (pink) across brain regions. e, Heatmaps comparing transcriptional changes (log fold change; below the heatmaps) in males and females with MDD compared to controls across brain regions.
Figure 2
Figure 2
Chronic variable stress (CVS) induces an equivalent depressive-like phenotype in male and female mice despite the induction of largely distinct transcriptional profiles. a, Quantification of latency to eat in the novelty suppressed feeding (NSF) test, b time spent grooming in the splash test, c time swimming in the forced swim test (FST) and d sucrose preference in male (blue) and female (pink) mice. Bars, mean ± sem; * p<0.05; † p<0.1. e, RRHO maps comparing male and female stressed mice in the vmPFC and NAc. Degree of significance is depicted in the color bar in between the RRHO maps. Venn diagrams displaying overlap between genes differentially expressed (p<0.05) in male (blue) and female (pink) stressed mice in both brain regions. Heatmaps comparing transcriptional changes (log fold change; in between the heatmaps) in stressed male and female mice compared to controls across both brain regions. Significance in tests a–d was determined using two-way ANOVA with Tuckey correction. n =10/condition.
Figure 3
Figure 3
Gene co-expression modules in females with MDD are enriched for DEGs across brain regions. a, Topological overlap matrix (TOM) plots for control and b, MDD modules in females. Light color represents low topological overlap and progressively darker red color represents higher overlap. Each module is assigned by unique color. c, Circos plots displaying the degree of enrichment for DEGs (p<0.05) in female modules. Colors within squares of the plots represent the corrected FET p-value of the enrichment of DEGs across modules which are depicted in the color bar below the circos plot. Legend on the top right corner defines individual layers of the circos plot. d, Gray26 module in female MDD shows enrichment for DEGs across brain regions. Hubs and nodes are defined by the size of the circles with colors representing enrichment for DEGs across brain regions (depicted in the bottom right panel). DUSP6, labelled in red, was selected for sex-specific in vivo functional validation studies.
Figure 4
Figure 4
DUSP6 downregulation in vmPFC induces a sex-specific depressive-like phenotype associated with increased ERK signaling in females. a, Schematic representation of the behavioral paradigm used to assess the impact DUSP6 downregulation in males and females. b, HSV-mediated downregulation of DUSP6 covering the infra- and prelimbic regions of the vmPFC in mice. c, Behavioral consequence of DUSP6 viral downregulation in the novelty-supressed feeding test in females and d, males and in the sucrose preference test in e, females and f, males. Significance in b was assessed using independent sample t-test. Significance in tests c–f was determined using two-way ANOVA with Tuckey correction. b n=5/condition, c–d n =10/condition, e–f n=7/condition. Bars, mean ± sem; * p<0.05. g, Phospho-ERK1/2 levels assessed by Western blot in male (blue) and female (pink) mice in vmPFC with and without stress (21 days CVS). h, Total ERK1/2 protein levels assessed by Western blot in male (blue) and female (pink) mice in vmPFC with and without stress (21 days CVS). i, Representative blot of phospho-ERK1/2, total ERK1/2 and actin in male and female mice with and without stress (21 days CVS). j, Phospho-ERK1/2 levels assessed by Western blot in males (blue) and females (pink) with and without MDD in vmPFC. k, Total ERK1/2 levels assessed by Western blot in males (blue) and females (pink) vmPFC with and without MDD. l, Representative blot of phospho-ERK1/2, total ERK1/2 and actin in males and females with and without MDD. Significance in tests g–h and j–k was determined using independent sample t-test (two-tail in mice; one tail in humans). g–h n=12/stressed mice and n=10 in control conditions. j–k, Male CTRL n=18, Male MDD n=19, Female CTRL n=14, Female MDD n=18. Bars, mean ± sem; * p<0.05. m, Phospho-ERK1/2 (red) in females with MDD co-localizes in CaMKII reactive pyramidal cells (green; upper panel) but not in GAD67 reactive cells (green; lower panel). n, Phospho-ERK1/2 (purple) in female stressed mice co-localizes in CaMKII reactive pyramidal cells (red) but not in GAD67 reactive cells (green).
Figure 5
Figure 5
DUSP6 downregulation alters the physiological properties of vmPFC pyramidal neurons in a sex-specific fashion. a, Representative action potential traces of burst firing pyramidal neuron (upper), regular firing pyramidal neuron (middle) and interneuron (lower). b, Representative traces of neuronal activity in non-infected, GFP-infected and DUSP6 KD-infected pyramidal neurons of vmPFC of female mice. c, DUSP6 KD-induced changes of spontaneous excitatory postsynaptic current (sEPSC) frequency in Hertz (Hz) and d, amplitude in picoAmpere (pA) in female vmPFC. e, Representative traces of neuronal activity in non-infected, GFP-infected and DUSP6 KD-infected pyramidal neurons of vmPFC of male mice. f, DUSP6 KD effects on sEPSC frequency and g, amplitude in male vmPFC. Significance in tests b–c and e–f was determined using two-way ANOVA with Tuckey correction. c–d Female non-infected: n=10 mice and n=25 cells, Female GFP-infected: n=4 mice and n=17 cells, Female DUSP6 KD-infected: n=5 mice and n=24 cells. f–g, Male non-infected: n=9 mice and n=32 cells, Male GFP-infected: n=5 mice and n=29 cells, Male DUSP6 KD-infected: n=4 and n=30 cells. Bars, mean ± sem; * p<0.05.
Figure 6
Figure 6
DUSP6 downregulation in female vmPFC reproduces the transcriptional and network alterations induced by 21 days of CVS in female vmPFC. a, Schematic representation of the behavioral paradigm used to assess the impact of DUSP6 downregulation in female mice. b, Transcriptional reorganization of the female-specific Gray26 gene network by DUSP6 downregulation in female vmPFC. Hubs and nodes are defined by the size of the circles with colors representing directionality of differential expression in the vmPFC (depicted in the bottom left panel). c, RRHO map directly comparing transcriptional profiles of females after DUSP6 downregulation with 21 days of CVS in the female vmPFC. Degree of significance is depicted in the color bar below the RRHO map. d, Top ontological terms enriched for downregulated genes following DUSP6 downregulation in female vmPFC. e, Venn diagram displaying the overlap between genes differentially expressed (p<0.05) in females after 21 days of CVS (yellow) and females after DUSP6 downregulation (blue) in the vmPFC. Heatmaps on the right compare transcriptional changes (log fold change; right to the heatmaps) in females after 21 days of CVS and females after DUSP6 downregulation in the vmPFC.

Comment in

References

    1. Organization., W. H. The Global burden of Disease 2004 update. 2008
    1. Kessler RC, Chiu WT, Demler O, Merikangas KR, Walters EE. Prevalence, severity, and comorbidity of 12-month DSM-IV disorders in the National Comorbidity Survey Replication. Arch Gen Psychiatry. 2005;62:617–627. doi: 10.1001/archpsyc.62.6.617. - DOI - PMC - PubMed
    1. Kuehner C. Gender differences in unipolar depression: an update of epidemiological findings and possible explanations. Acta Psychiatr Scand. 2003;108:163–174. - PubMed
    1. Breslau N. Gender differences in trauma and posttraumatic stress disorder. The journal of gender-specific medicine: JGSM: the official journal of the Partnership for Women’s Health at Columbia. 2002;5:34–40. - PubMed
    1. Kessler RC, McGonagle KA, Swartz M, Blazer DG, Nelson CB. Sex and depression in the National Comorbidity Survey. I: Lifetime prevalence, chronicity and recurrence. J Affect Disord. 1993;29:85–96. - PubMed

MeSH terms