. 2017 Oct;49(10):1553-1557.
doi: 10.1038/ng.3938. Epub 2017 Aug 21.

Condensin-mediated remodeling of the mitotic chromatin landscape in fission yeast

Affiliations

Condensin-mediated remodeling of the mitotic chromatin landscape in fission yeast

Yasutaka Kakui et al. Nat Genet. 2017 Oct.

Abstract

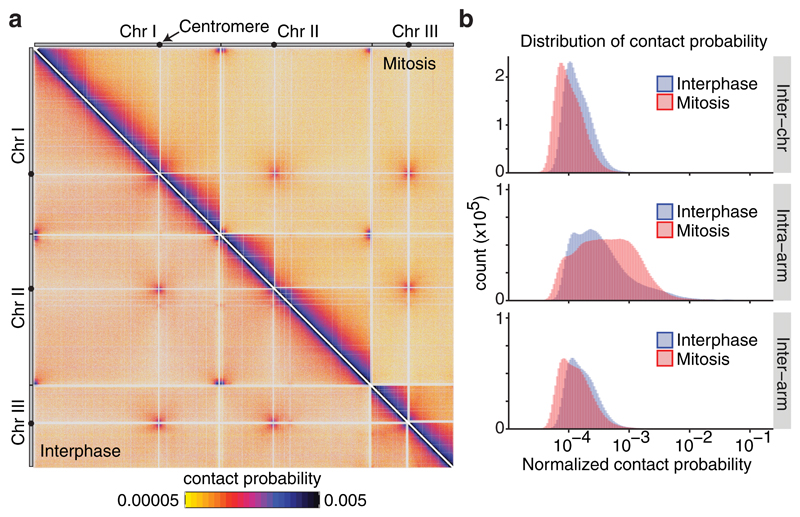
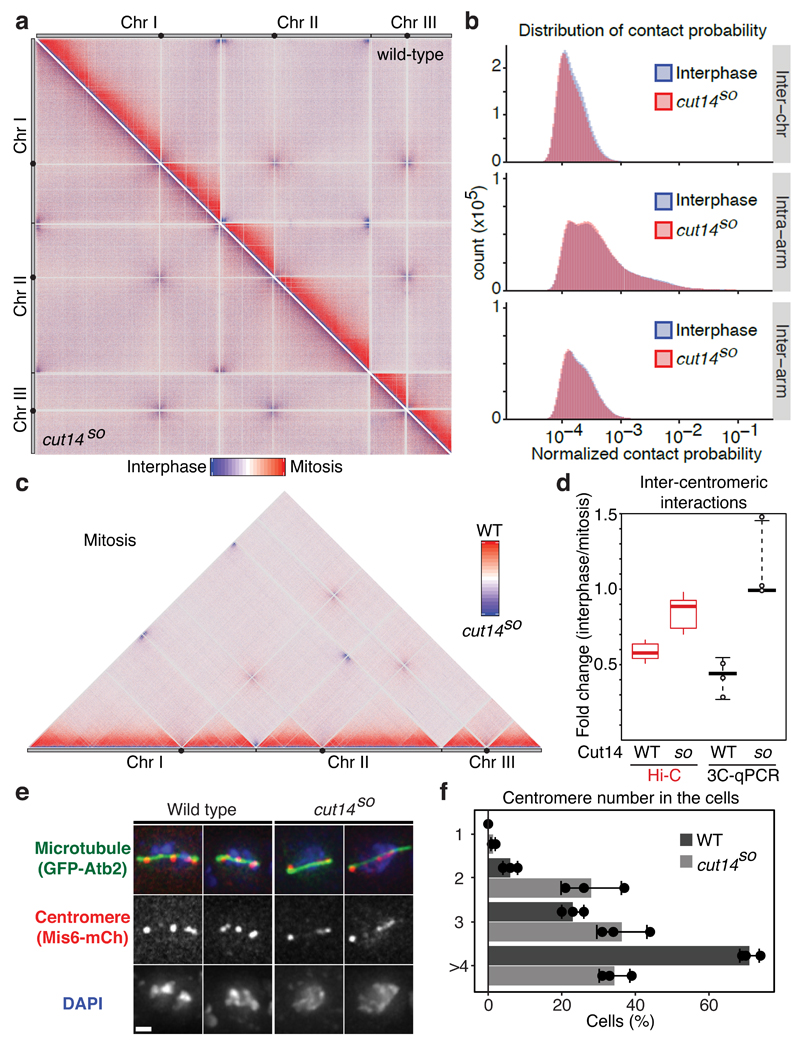
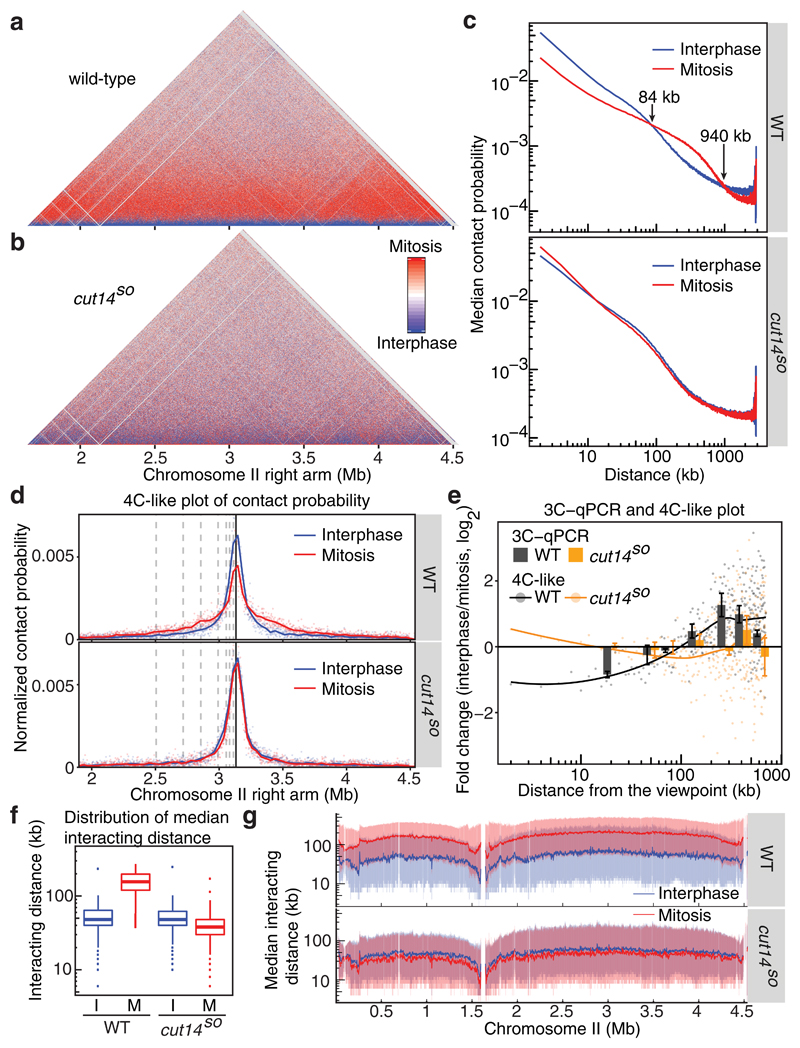
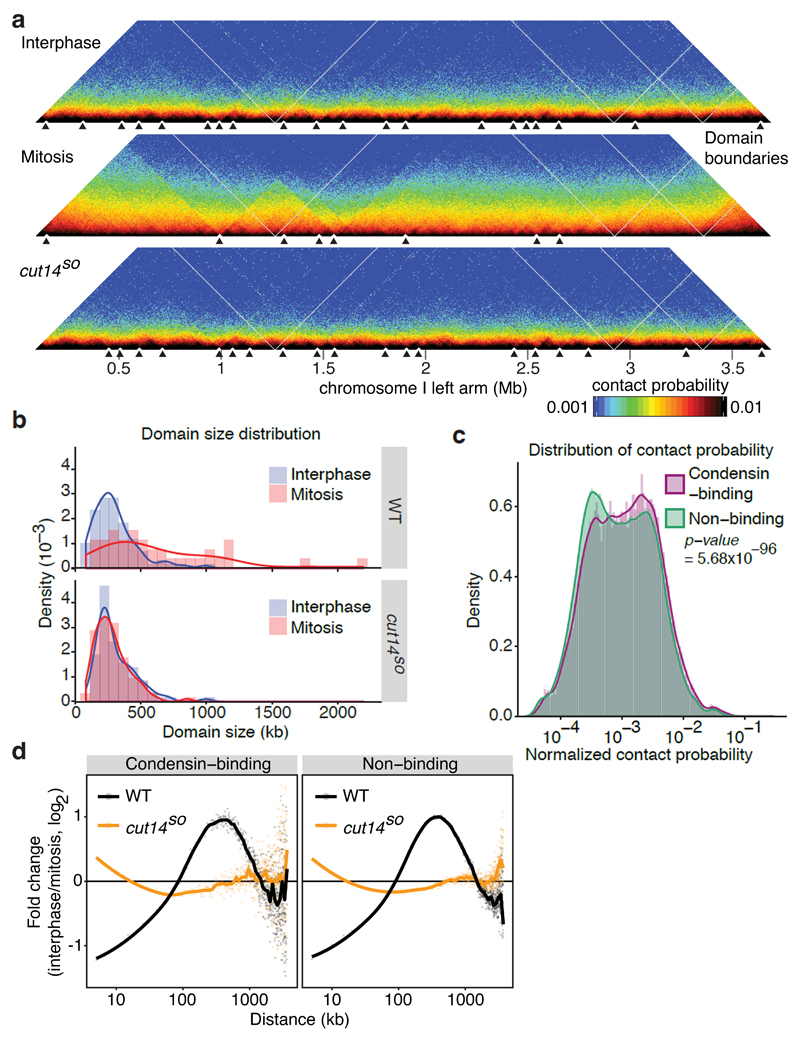
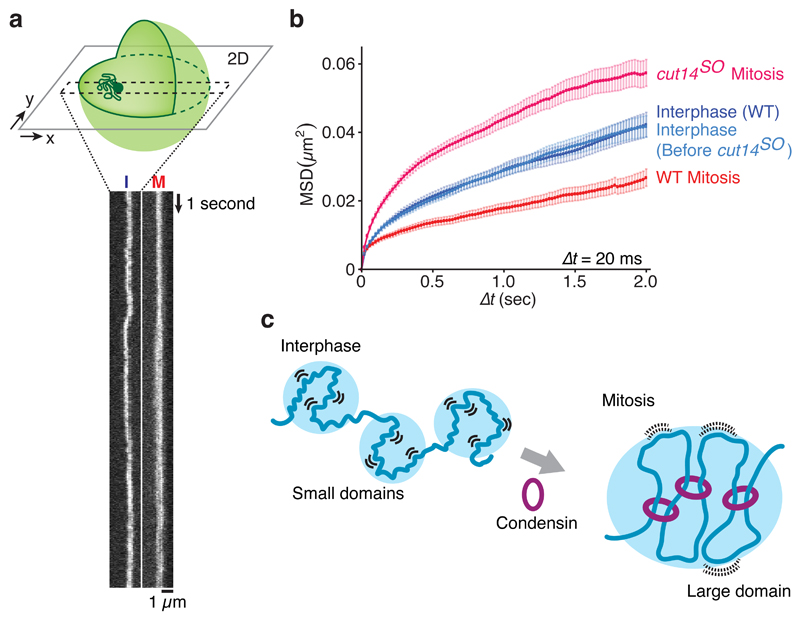
The eukaryotic genome consists of DNA molecules far longer than the cells that contain them. They reach their greatest compaction during chromosome condensation in mitosis. This process is aided by condensin, a structural maintenance of chromosomes (SMC) family member. The spatial organization of mitotic chromosomes and how condensin shapes chromatin architecture are not yet fully understood. Here we use chromosome conformation capture (Hi-C) to study mitotic chromosome condensation in the fission yeast Schizosaccharomyces pombe. This showed that the interphase landscape characterized by small chromatin domains is replaced by fewer but larger domains in mitosis. Condensin achieves this by setting up longer-range, intrachromosomal DNA interactions, which compact and individualize chromosomes. At the same time, local chromatin contacts are constrained by condensin, with profound implications for local chromatin function during mitosis. Our results highlight condensin as a major determinant that changes the chromatin landscape as cells prepare their genomes for cell division.


Conflict of interest statement

Competing Financial Interests

The authors declare no competing financial interests.

Figures

Figure 1
Figure 1. Hi-C reveals genome-wide contact changes during chromosome condensation.
(a) Normalized Hi-C contact probability maps in wild-type cells in interphase and mitosis (lower left and upper right triangles, respectively). The 3 fission yeast chromosomes are shown with centromere positions indicated (black dots). See Supplementary Figure 3 for an annotated schematic of the interactions that are recorded in this map. (b) Distribution of normalized contact probabilities between chromosomes (Inter-chr), within chromosome arms (Intra-arm) or between the two arms of the same chromosome (Inter-arm).
Figure 2
Figure 2. Mitotic conformational changes depend on the condensin complex.
(a) Hi-C difference maps between interphase and mitosis of wild-type and cut14SO cells (upper right and lower left triangles, respectively). (b) Distribution of normalized contact probabilities. As Fig. 1b, but comparing interphase and cut14SO mitosis. (c) Hi-C difference map comparing wild-type and cut14SO cells in mitosis. (d) Quantification of inter-centromeric interaction changes between interphase and mitosis. Box plots of the Hi-C contact probability changes between bins within central cores + 10 kb are compared to the medians and range of 3C-qPCR between centromere II and centromeres I and III of 2 technical replicates each of 3 independent experiments. (e) Localization of centromeres is shown in fixed mitotic cells. Mitotic spindles were also visualized and DNA was counterstained using 4',6-diamidino-2-phenylindole (DAPI). (f) The number of distinct centromere signals was counted. n = 100 cells were scored in three independent experiments, each. The mean ± s.d. is shown together with the individual results.
Figure 3
Figure 3. Condensin replaces local contacts with longer-range interactions in mitosis.
(a, b) Hi-C difference maps of the chromosome II right arm comparing interphase and mitosis in wild-type (a) and in cut14SO cells (b). (c) Median contact probabilities in interphase and mitosis as a function of distance along the chromosome II right arm are shown in wild-type (top) and cut14SO cells (bottom). (d) 4C-like plot of Hi-C contact probability from a viewpoint on the chromosome II right arm. The positions of 3C-qPCR primer-binding sites are shown (dotted and solid lines). (e) Interaction changes between interphase and mitosis determined by 3C-qPCR (mean ± s.e. of 3 biological repeats) are compared to 4C-like contact probability changes based on the Hi-C data (dots). Lines represent smoothed 4C-like contact probability changes. (f) Box plots of the distribution of contact frequencies within all chromosome arms under the indicated conditions. The box plot shows the medians and 25th and 75th percentiles, the whiskers indicate a 95% confidence interval. Outliers are also shown. (g) Moving intra-arm median interacting distances along chromosome II (solid lines) are shown together with shaded areas representing the 25th and 75th percentiles.
Figure 4
Figure 4. Condensin-dependent chromatin domain expansion in mitosis.
(a) Normalized Hi-C maps are shown with domain boundaries along a section of the chromosome I left arm under the indicated conditions. For domain visualization, a bin size of 5 kb was used. Black triangles indicate domain boundaries. (b) Density plots of domain size distributions. (c) Distribution of normalized contact probabilities of 5 kb bins containing or not containing a condensin binding site. A Wilcoxon Mann-Whitney test was used to test the null hypothesis that contact probabilities between condensin binding and non-binding sites are the same. (d) Contact probability changes between interphase and mitosis are plotted as a function of distance, separated into bins containing or not containing a condensin binding site.
Figure 5
Figure 5. Condensin confines local chromatin motility.
(a) Kymographs of the LacO locus on chromosome 1, marked by LacI-GFP, in wild type cells in interphase (I) and mitosis (M). The schematic illustrates the experiment. (b) Mean square displacement (MSD) of the LacO locus under the indicated conditions. Mean ± S.E.M are plotted (n = 61-72). (c) A model for how chromosome compaction by condensin is achieved by longer-range interactions, accompanied by chromatin domain enlargement as well as reduced local chromatin motility.

Comment in

References

    1. Hirano T. Condensin-Based Chromosome Organization from Bacteria to Vertebrates. Cell. 2016;164:847–57. - PubMed
    1. Uhlmann F. SMC complexes: from DNA to chromosomes. Nat Rev Mol Cell Biol. 2016;17:399–412. - PubMed
    1. Belton JM, et al. Hi-C: a comprehensive technique to capture the conformation of genomes. Methods. 2012;58:268–76. - PMC - PubMed
    1. Dekker J, Marti-Renom MA, Mirny LA. Exploring the three-dimensional organization of genomes: interpreting chromatin interaction data. Nat Rev Genet. 2013;14:390–403. - PMC - PubMed
    1. Saka Y, et al. Fission yeast cut3 and cut14, members of a ubiquitous protein family, are required for chromosome condensation and segregation in mitosis. EMBO J. 1994;13:4938–52. - PMC - PubMed

MeSH terms