. 2017 Aug 15:6:e26138.
doi: 10.7554/eLife.26138.

G protein βγ subunits inhibit TRPM3 ion channels in sensory neurons

Affiliations

G protein βγ subunits inhibit TRPM3 ion channels in sensory neurons

Talisia Quallo et al. Elife. .

Abstract

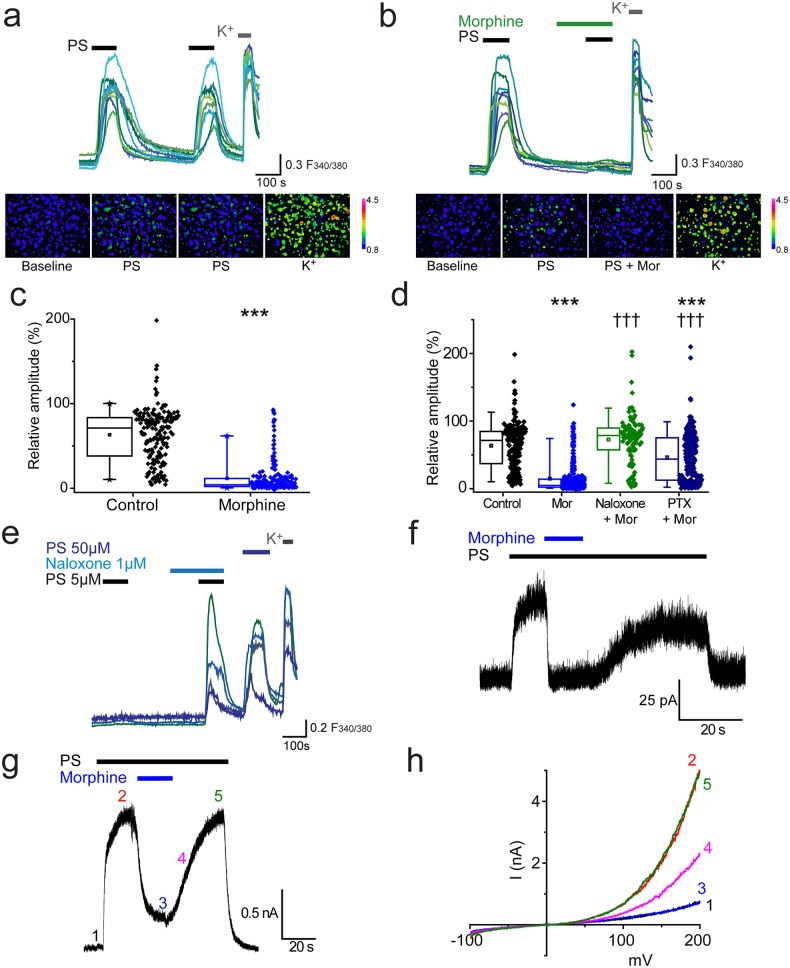
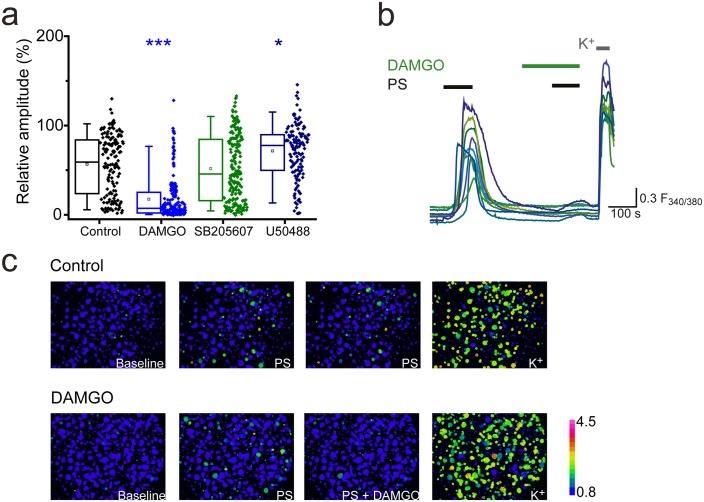
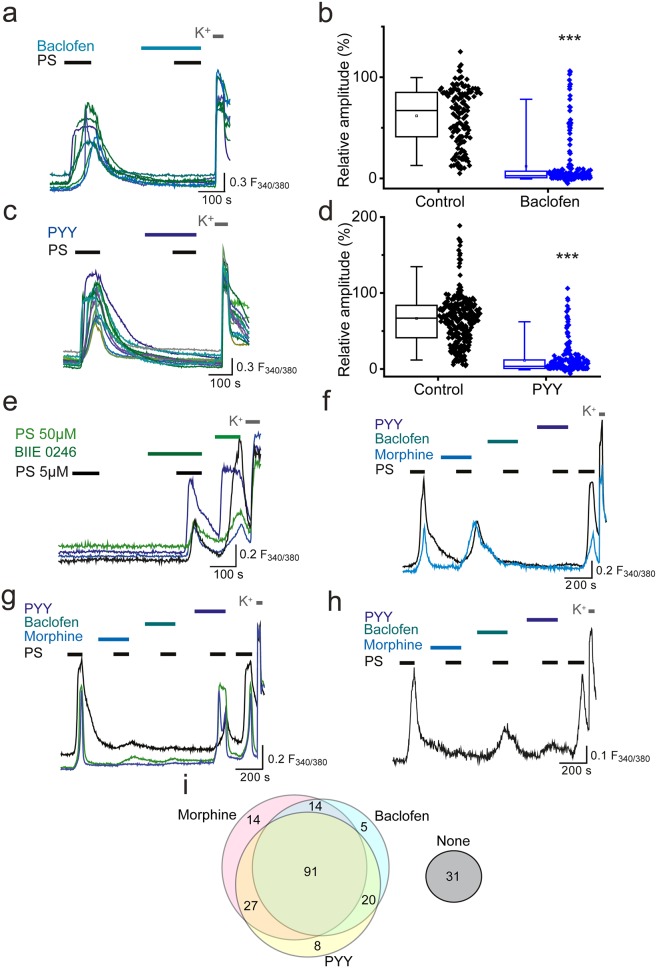
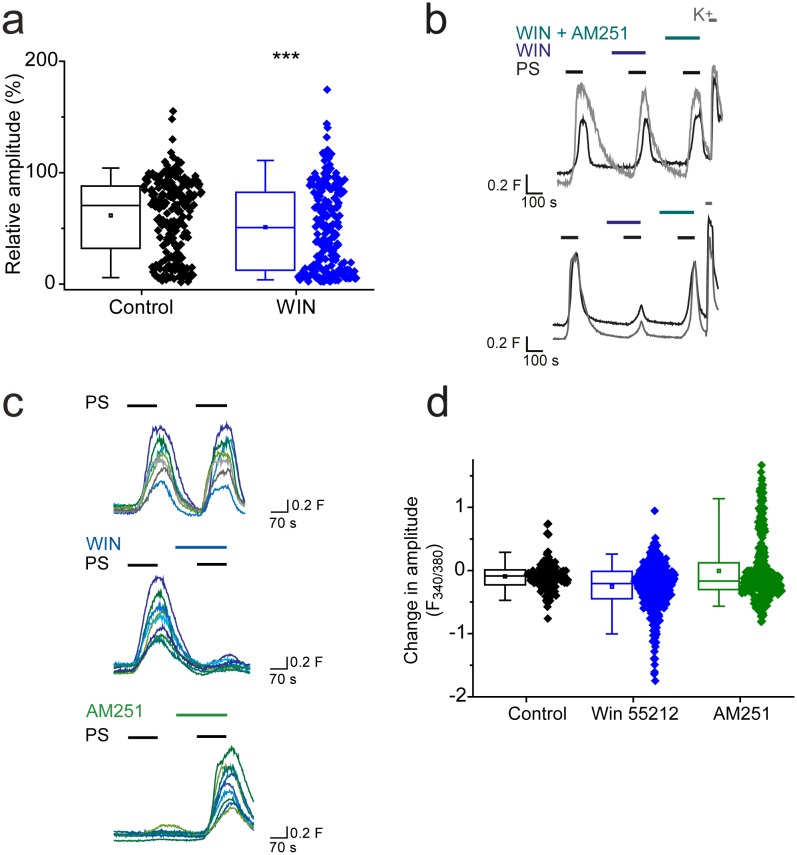
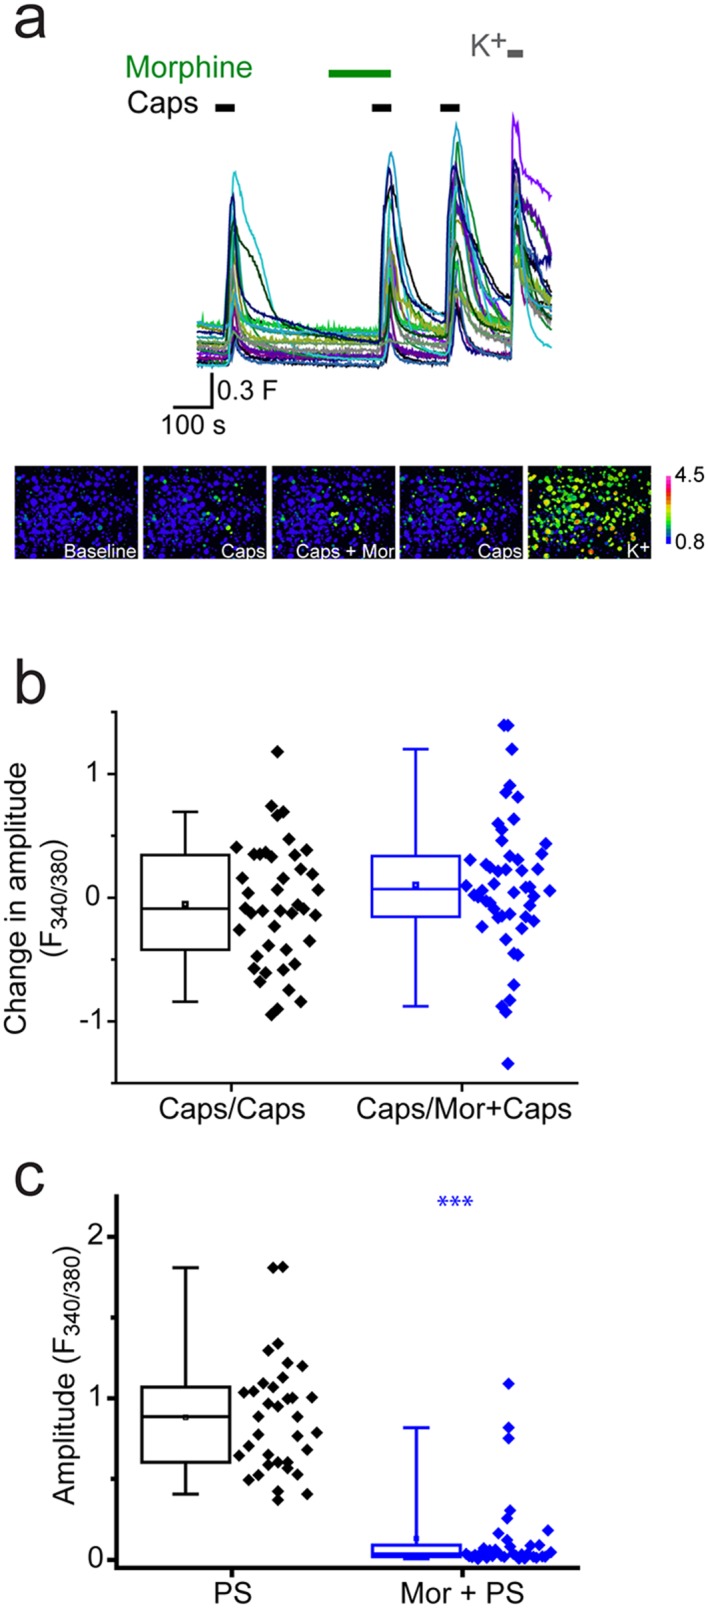
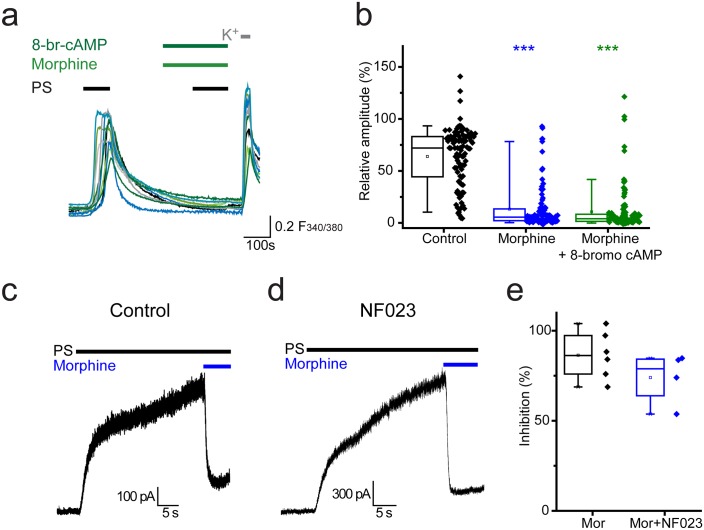
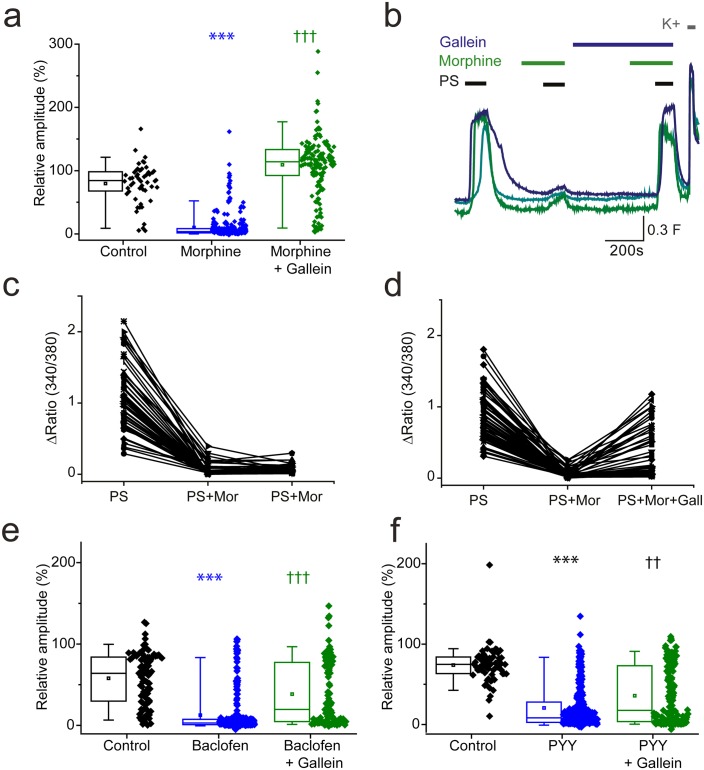
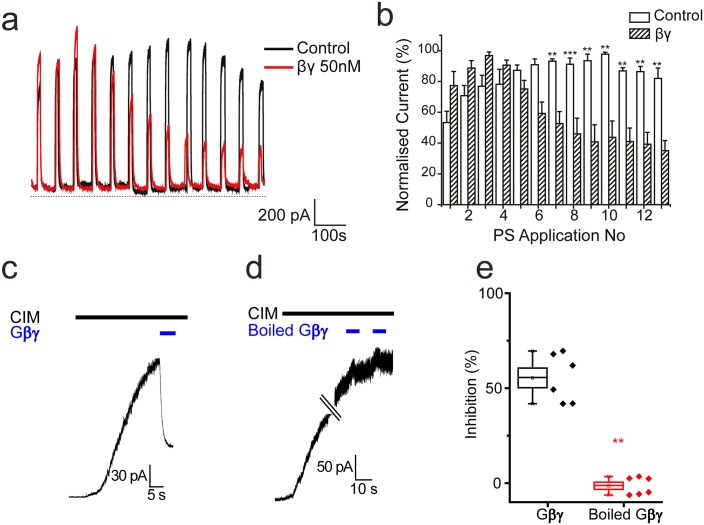
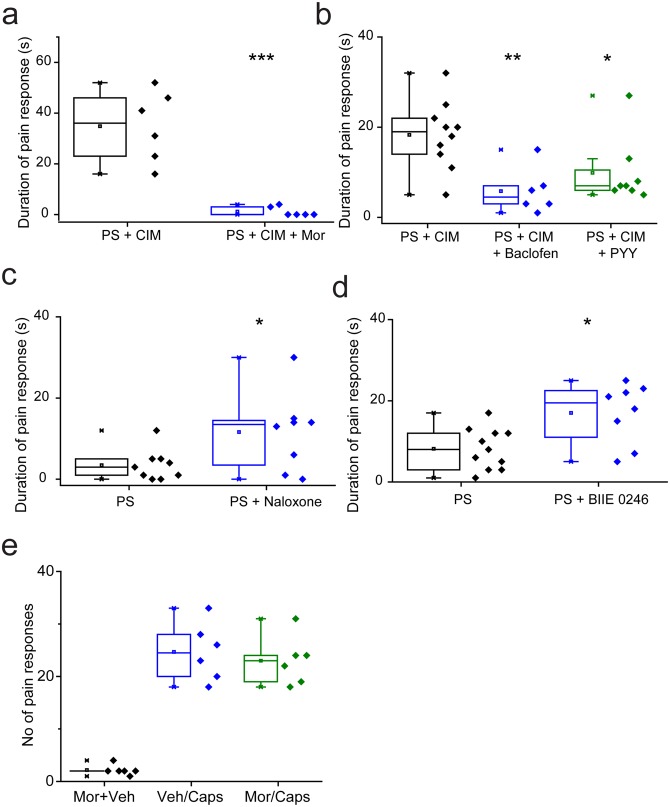
Transient receptor potential (TRP) ion channels in peripheral sensory neurons are functionally regulated by hydrolysis of the phosphoinositide PI(4,5)P2 and changes in the level of protein kinase mediated phosphorylation following activation of various G protein coupled receptors. We now show that the activity of TRPM3 expressed in mouse dorsal root ganglion (DRG) neurons is inhibited by agonists of the Gi-coupled µ opioid, GABA-B and NPY receptors. These agonist effects are mediated by direct inhibition of TRPM3 by Gβγ subunits, rather than by a canonical cAMP mediated mechanism. The activity of TRPM3 in DRG neurons is also negatively modulated by tonic, constitutive GPCR activity as TRPM3 responses can be potentiated by GPCR inverse agonists. GPCR regulation of TRPM3 is also seen in vivo where Gi/o GPCRs agonists inhibited and inverse agonists potentiated TRPM3 mediated nociceptive behavioural responses.

Keywords: DRG; GPCR; TRP channels; ion channels; mouse; neuroscience; pain; sensory neuron.


Conflict of interest statement

The authors declare that no competing interests exist.

Figures

Figure 1.
Figure 1.. Morphine inhibits TRPM3 channels expressed on sensory neurons.
(a) Traces of DRG [Ca2+]i responses evoked by two sequential PS challenges (20 µM) followed by high K+ (50 mM KCl). (b) Effect of treatment with 10 µM morphine for 2 min before and during the second PS challenge. F(340/380) indicates fura-2 emission ratio. The lower panels in (a) and (b) are pseudocolour images illustrating the change in F340/380 ratio in response to PS and KCl. The bar indicates the colours corresponding to various F340/380 values. (c) Box and whisker plots and data points showing the amplitudes for responses to the second PS challenge in (a) and (b), ***p<0.001; Mann-Whitney U test (control, n = 174; morphine, n = 209). (d) Effect of treatment with morphine (10 µM, n = 323), morphine (10 µM) and naloxone (1 µM, n = 110) and morphine (10 µM) following an incubation with pertussis toxin (200 ng/ml for 2.5 h-18h, n = 253) on [Ca2+]i responses evoked by the second PS (20 µM) challenge using the protocol in (a and b). Control group, n = 188. (e) Traces displaying neuronal [Ca2+]i responses to two PS (5 µM) challenges in the absence and presence of naloxone (1 µM), followed by a 50 µM PS challenge and high K+ (50 mM KCl). ***p<0.001, compared to control. ††† p<0.001, compared to morphine (10 µM), Kruskal-Wallis. (f) Whole cell recording illustrating that morphine reversibly inhibits PS-evoked outward membrane currents in DRG neurons (+40 mV). (g) Inhibitory effect of morphine on whole cell outward current in a CHO cell co-expressing TRPM3 and µ-opioid receptor (+60 mV). (h) Current-voltage relationships for another TRPM3/µ-opioid receptor expressing CHO cell measured at times corresponding to time points 1–5 in panel g. DOI: http://dx.doi.org/10.7554/eLife.26138.003
Figure 2.
Figure 2.. Activation of μ-opioid receptors inhibits TRPM3.
(a) Effect of the selective μ opioid receptor agonist DAMGO, δ opioid receptor agonist SB205607 and κ opioid receptor agonist U50488 (each at 20 nM) on [Ca2+]i-responses evoked by PS (20 µM, second application, see Figure 1 for protocol). *p<0.05, ***p<0.001; Kruskal-Wallis (control, n = 152; DAMGO, n = 184; SB205607, n = 200; U50488, n = 140). (b) Traces displaying the effect of DAMGO (20 nM) on neuronal [Ca2+]i responses to stimulation with PS (20 µM). F(340/380) indicates fura-2 emission ratio. (c) Pseudocolour images illustrating the change in F340/380 ratio in response to PS and KCl with the colours corresponding to various F340/380 values indicated by the bar. DOI: http://dx.doi.org/10.7554/eLife.26138.004
Figure 3.
Figure 3.. Activation of other Gi-coupled receptors also inhibit TRPM3.
(a, b) Effect of (RS)-Baclofen (100 µM) on the relative [Ca2+]i-response amplitude evoked by PS (20 µM). (c, d) Effect of PYY (100 nM) on the relative [Ca2+]i-response amplitude evoked by PS (20 µM). Plots illustrate the response amplitudes evoked by the second PS challenge (% of first PS amplitude) in control experiments and experiments where neurons were perfused with (b) (RS)-Baclofen (control, n = 138; Baclofen, n = 194) and (d) PYY (control, n = 289; PYY, n = 217). ***p<0.001; Mann-Whitney U test (e) Traces displaying [Ca2+]i responses to two sequential 5 µM PS challenges, followed by a 50 µM PS challenge and depolarisation with high K+ (50 mM KCl). Cells were exposed to 10 µM BIIE 0246 for 2 min before and during the second PS challenge. (f–h) Traces displaying DRG [Ca2+]i responses to sequential 20 µM PS challenges (indicated by black bars) in the presence and absence of morphine (10 µM), baclofen (100 µM) and PYY (100 nM), followed by depolarisation with high K+ (50 mM KCl). A group of cells were inhibited by some GPCR agonists but not others. F(340/380) indicates fura-2 emission ratio. (i) Venn diagram illustrating the pattern of inhibition of PS responses by morphine, baclofen and PYY, n = 210 PS and KCl responsive cells. Responses in 31 cells were not inhibited by any of the GPCR agonists (second response amplitude >15% of first PS response amplitude). DOI: http://dx.doi.org/10.7554/eLife.26138.005
Figure 4.
Figure 4.. CB1 activation can inhibit TRPM3 channels.
(a) Effect of CB1 receptor agonist WIN 55212–2 (1 µM) on DRG [Ca2+]i-responses evoked by PS (20 µM, second application). ***p<0.001; Mann-Whitney U test (control, n = 213; WIN 55212–2, n = 218). (b) Traces showing DRG [Ca2+]i responses to three PS (20 µM) challenges in the absence and presence of WIN 55212–2 (1 µM) and WIN 55212–2 (1 µM) plus AM251 (0.5 µM) followed by high K+ (50 mM KCl). Many PS responses were unaffected by WIN 55212–2 (upper panel) and some showed an inhibition that was reversed by co-application of the antagonist AM251 with WIN 55212–2 (bottom panel). (c) Traces displaying [Ca2+]i responses to sequential 20 µM PS challenges (indicated by black bars) in CHO cells co-expressing TRPM3 and CB1 receptors in the absence (top) and presence (middle) of 1 µM WIN 552212–2 during the second PS challenge. Middle traces show cells where WIN 552212–2 inhibited the PS responses. Bottom: [Ca2+]i responses to sequential applications of 5 µM PS with 0.5 µM present during the second PS application. (d) Plots showing the change in [Ca2+]i response amplitudes (second – first response). Note the increased number of negative values (inhibition) and the increased number of positive values (potentiation) in the presence of the agonist WIN 552212–2 and antagonist AM251, respectively. DOI: http://dx.doi.org/10.7554/eLife.26138.006
Figure 5.
Figure 5.. Morphine does not inhibit capsaicin evoked [Ca2+]i-responses.
Cyclosporin (1µM) included in all solutions to reduce TRPV1 desensitization. (a) Traces showing DRG [Ca2+]i responses to three capsaicin (1 µM) challenges (indicated by black bars) followed by high K+ (50 mM KCl). Morphine (10 µM was present) before and during the second capsaicin challenge. Lower panels are pseudocolour images illustrating the change in F340/380 ratio in response to capsaicin and KCl. (b) Plots showing the change in [Ca2+]i response amplitudes (second – first response) under control conditions (left, Caps/Caps) and when morphine was applied (middle, Caps/Mor + Caps). (c) 10 µM morphine reduced [Ca2+]i responses evoked by 20 µM PS in same experiment. Amplitudes of responses evoked by first PS application (left) and second application of PS in presence of morphine (right). ***p<0.001 DOI: http://dx.doi.org/10.7554/eLife.26138.007
Figure 6.
Figure 6.. Opioid-mediated inhibition of TRPM3 is independent of cAMP and Gαi subunits.
(a) Traces showing the effect of 8-bromo cAMP (1 mM) on morphine (10 µM) induced inhibition of [Ca2+]i–responses evoked by PS (20 µM) in DRG neurons. F(340/380) indicates fura-2 emission ratio. (b) Box and whisker and scatter plots displaying the average response amplitudes from experiments such as a., control, n = 96; morphine, n = 95; morphine +8 bromo cAMP, n = 118) ***p<0.001, compared to control. (c) Whole cell recordings illustrating morphine inhibition of PS-evoked outward membrane currents in CHO cells co-expressing TRPM3 and the µ opioid receptor (+60 mV) in the absence (left) and presence (right) of 100 µM NF023 in the pipette solution. (d) Box and whisker and scatter plots showing the percentage inhibition of 50 µM PS-evoked currents in the absence and presence of NF023. No significant difference noted (p=0.1). DOI: http://dx.doi.org/10.7554/eLife.26138.008
Figure 7.
Figure 7.. βγ subunits mediate Gi/o inhibition of TRPM3.
(a, b) Effect of the Gβγ inhibitor gallein (20 µM) on morphine (10 µM) induced inhibition of PS-evoked [Ca2+]i-responses. (a) Plots show the relative response amplitudes evoked by a second PS challenge (20 µM) in control conditions, in the presence of morphine and gallein, control n = 52; morphine n = 314; morphine + gallein n = 153. (b) Representative traces demonstrating that gallein reverses morphine inhibition of PS (20 µM). Cells were perfused with 10 µM morphine 2 min before and during the second and third PS challenge, and perfused with 20 µM gallein 7 min before and during the third PS challenge. The results shown are for morphine sensitive cells (PS response amplitude in presence of morphine < 30% of the first response amplitude). ***p<0.001 compared to control, †††p<0.001 compared to morphine, Kruskal Wallis. (c) Scatter and line plot showing the relationship between maximum response amplitudes (Δ Fura-2 ratio) for the first, second and third PS responses in control experiments without gallein and (d) in experiments with gallein (20 µM) present during the third PS application. (e,f) Plots displaying the relative response amplitudes evoked by the second (20 µM) PS challenge for control experiments and experiments where neurons were perfused with (e) 100 µM baclofen or 10 µM gallein and 100 µM baclofen (control, n = 88 baclofen, n = 236; baclofen and gallein, n = 102). ***p<0.001 compared to control, †††p<0.001 compared to baclofen, Kruskal Wallis. (f) Effect of 100 nM PYY or 10 µM gallein and 100 nM PYY on the relative amplitude of PS evoked [Ca2+]i-responses (control, n = 65; PYY, n = 288; PYY and gallein, n = 183). ***p<0.001 compared to control, ††p=0.01 compared to PYY. Kruskal-Wallis. F(340/380) indicates fura-2 emission ratio. DOI: http://dx.doi.org/10.7554/eLife.26138.009
Figure 8.
Figure 8.. Effect of βγ subunits on PS-evoked currents.
(a) Outward currents (+40 mV) evoked by 10 s PS (50 µM) applications every minute in TRPM3-expressing HEK293 cells. Cells dialysed intracellularly with βγ subunits (50 nM, red trace) showed a progressive decline in the evoked current amplitude compared to control cells. (b) Column graph displaying normalised current (% of maximum current) for PS-evoked outward currents in TRPM3-expressing HEK293 cells. Columns represent mean ± SEM; **p<0.01, ***p<0.001, unpaired t-test (control, n = 3–5 cells; βγ, n = 3–5 cells). (c) βγ subunits (50 nM) applied to the intracellular face of an inside out membrane patch from TRPM3-expressing HEK293 cell inhibit 10 µM CIM0216 evoked outward current (+60 mV). (d) Heat inactivated (100°C, 10 min) βγ subunits (50 nM) do not inhibit CIM0216 evoked currents. (e) Plots of percentage inhibition of CIM0216 evoked currents in inside out membrane patches for βγ subunits (n = 5) and boiled βγ subunits (n = 6).** p=0.002 DOI: http://dx.doi.org/10.7554/eLife.26138.010
Figure 9.
Figure 9.. Nociceptive responses to TRPM3 agonists are modulated by Gi GPCR ligands.
(a,b) Inhibitory effects of prior (5 min) intraplantar administrations of (a) 130 nmole morphine (n = 6 for each group) and (b) 240 nmole baclofen (n = 6) or 235 pmole PYY (n = 8) on the duration of licking/flinching evoked by intraplantar injection of 5 nmole PS plus 0.5 nmole CIM-0216 (n = 10 for PS + CIM0216). (c,d) Effects of prior (30 min) intraperitoneal administration of either (c) 2.5 mg/kg naloxone (n = 9 for PS, n = 8 for PS + naloxone) or (d) 3 mg/kg BIIE 0246 (n = 11 for PS, n = 8 for PS + BIIE 0246) on licking/flinching behaviour evoked by intraplantar administration of 5nmole PS. *p<0.05, **p<0.01, ***p<0.001; ANOVA followed by Tukey’s HSD test. (e) No effect of intraplantar morphine (130 nmole) on nociceptive responses evoked by intraplantar administration of capsaicin (33 nmole). Vehicle, 0.9% NaCl. DOI: http://dx.doi.org/10.7554/eLife.26138.011

Comment in

References

    1. Agarwal N, Pacher P, Tegeder I, Amaya F, Constantin CE, Brenner GJ, Rubino T, Michalski CW, Marsicano G, Monory K, Mackie K, Marian C, Batkai S, Parolaro D, Fischer MJ, Reeh P, Kunos G, Kress M, Lutz B, Woolf CJ, Kuner R. Cannabinoids mediate analgesia largely via peripheral type 1 cannabinoid receptors in nociceptors. Nature Neuroscience. 2007;10:870–879. doi: 10.1038/nn1916. - DOI - PMC - PubMed
    1. Badheka D, Borbiro I, Rohacs T. Transient receptor potential melastatin 3 is a phosphoinositide-dependent ion channel. The Journal of General Physiology. 2015;146:65–77. doi: 10.1085/jgp.201411336. - DOI - PMC - PubMed
    1. Bardoni R, Tawfik VL, Wang D, François A, Solorzano C, Shuster SA, Choudhury P, Betelli C, Cassidy C, Smith K, de Nooij JC, Mennicken F, O'Donnell D, Kieffer BL, Woodbury CJ, Basbaum AI, MacDermott AB, Scherrer G. Delta opioid receptors presynaptically regulate cutaneous mechanosensory neuron input to the spinal cord dorsal horn. Neuron. 2014;81:1312–1327. doi: 10.1016/j.neuron.2014.01.044. - DOI - PMC - PubMed
    1. Bevan S, Quallo T, Andersson DA. TRPV1. In: Nilius B, Flockerzi V, editors. Handbook of Experimental Pharmacology. Berlin: Springer; 2014. pp. 207–245. - PubMed
    1. Brumovsky P, Stanic D, Shuster S, Herzog H, Villar M, Hökfelt T. Neuropeptide Y2 receptor protein is present in peptidergic and nonpeptidergic primary sensory neurons of the mouse. The Journal of Comparative Neurology. 2005;489:328–348. doi: 10.1002/cne.20639. - DOI - PubMed

Publication types

MeSH terms