. 2017 Aug 21:6:e27679.
doi: 10.7554/eLife.27679.

Test of the 'glymphatic' hypothesis demonstrates diffusive and aquaporin-4-independent solute transport in rodent brain parenchyma

Affiliations

Test of the 'glymphatic' hypothesis demonstrates diffusive and aquaporin-4-independent solute transport in rodent brain parenchyma

Alex J Smith et al. Elife. .

Abstract

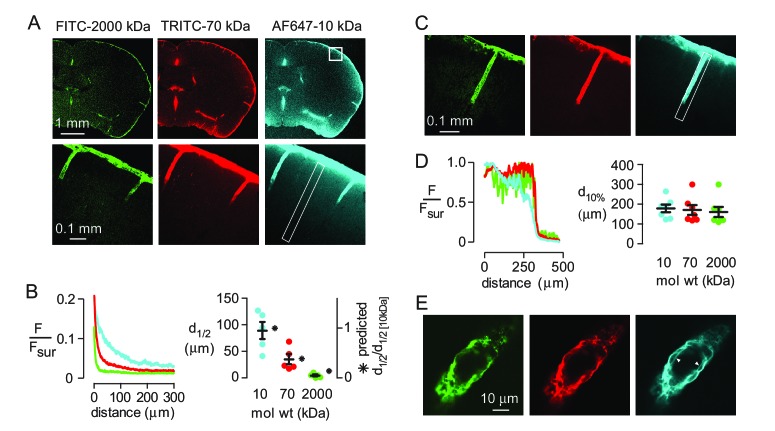
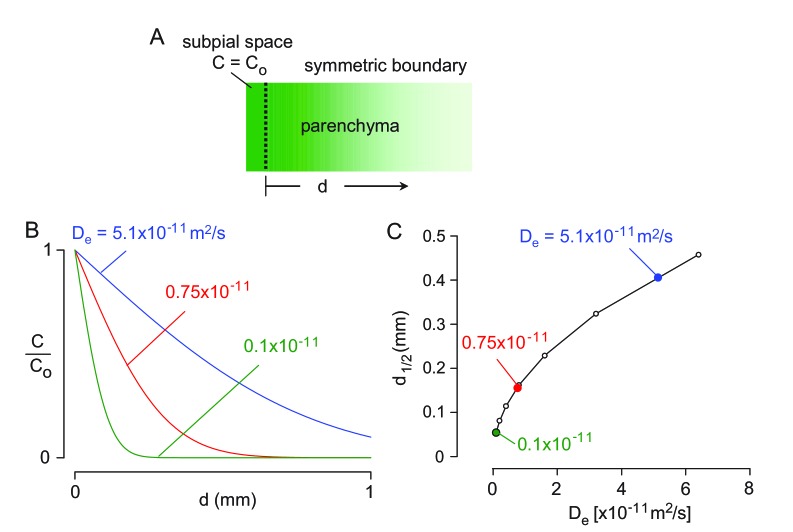
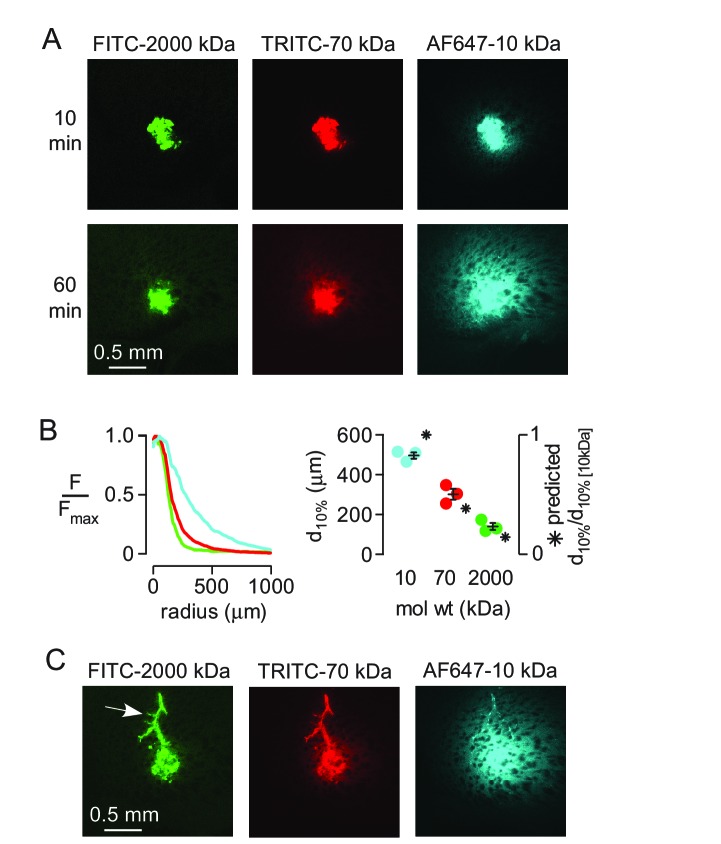
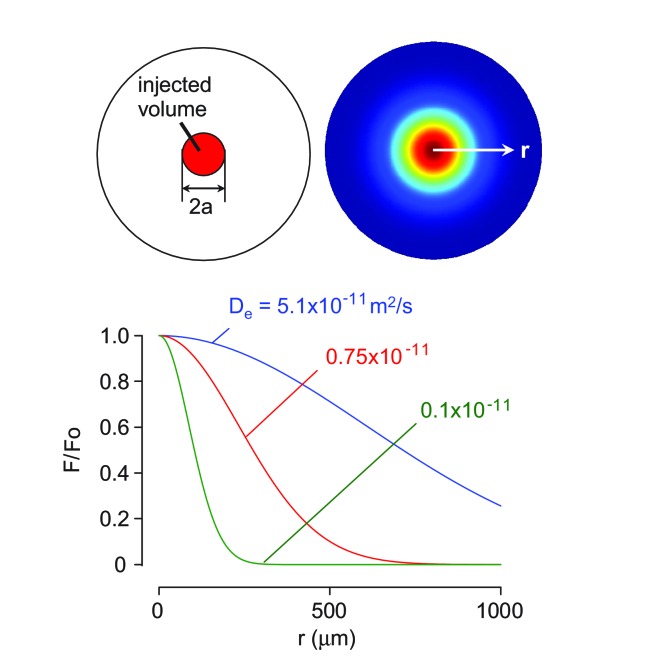
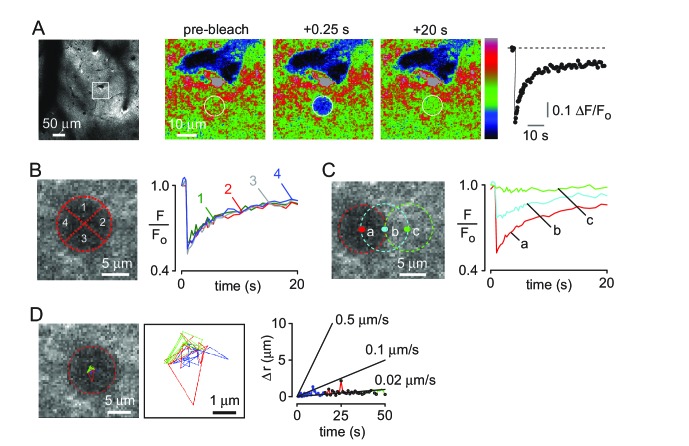
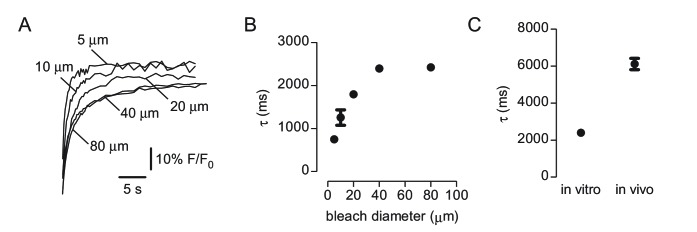
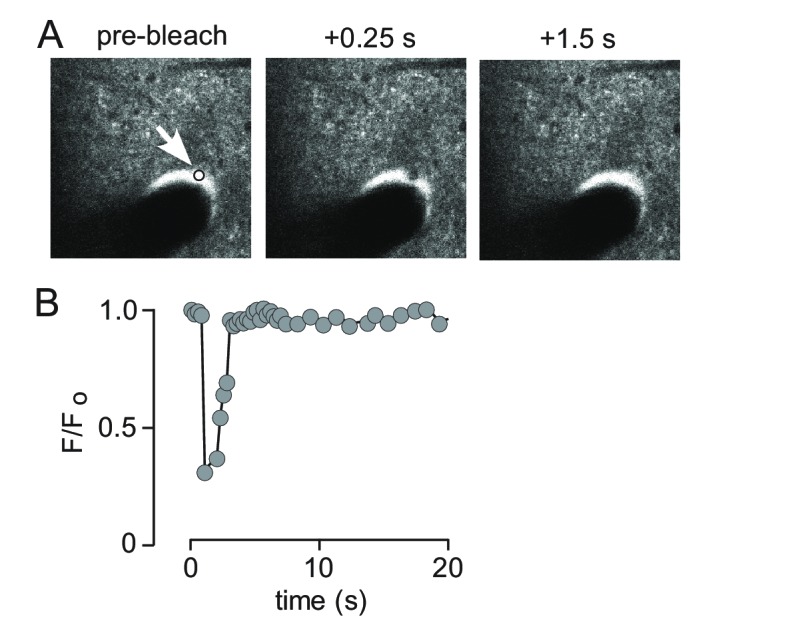
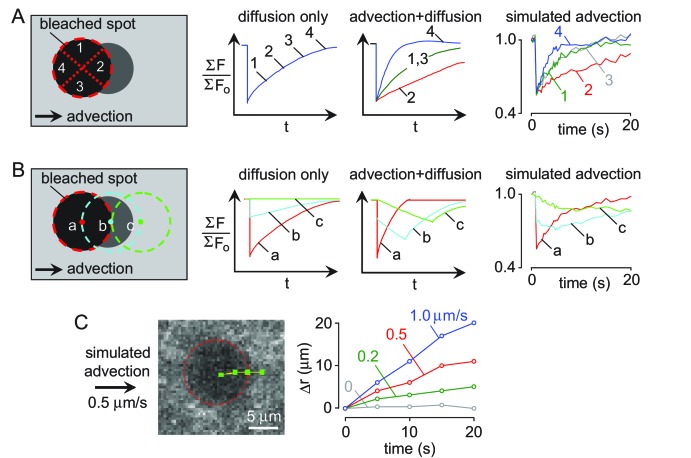
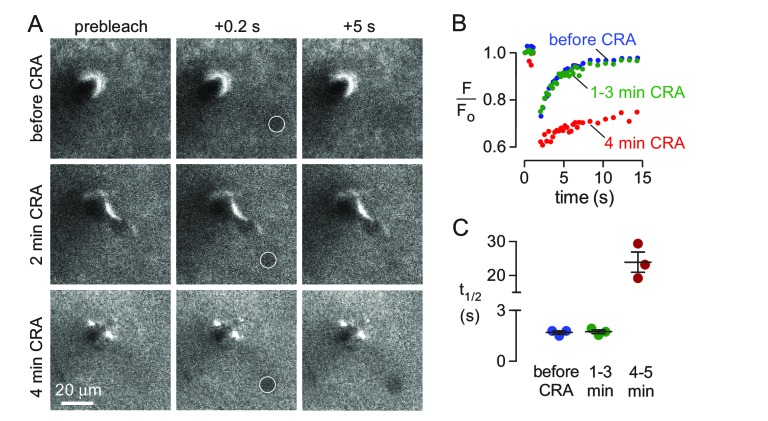
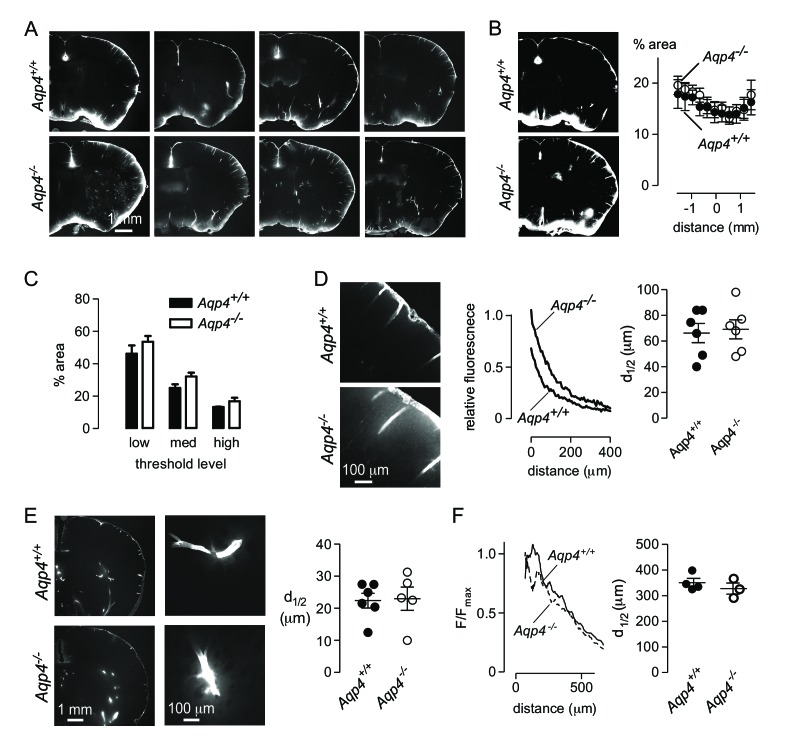
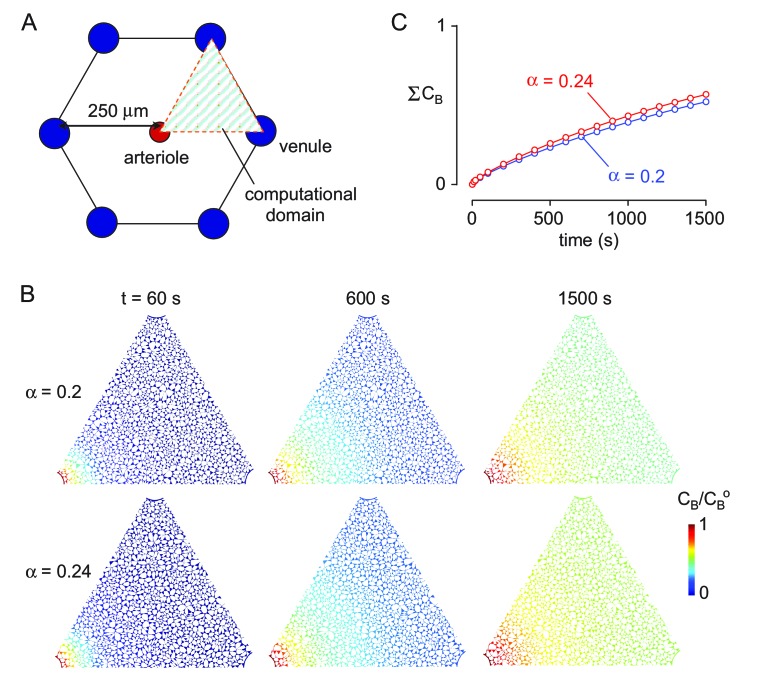
Transport of solutes through brain involves diffusion and convection. The importance of convective flow in the subarachnoid and paravascular spaces has long been recognized; a recently proposed 'glymphatic' clearance mechanism additionally suggests that aquaporin-4 (AQP4) water channels facilitate convective transport through brain parenchyma. Here, the major experimental underpinnings of the glymphatic mechanism were re-examined by measurements of solute movement in mouse brain following intracisternal or intraparenchymal solute injection. We found that: (i) transport of fluorescent dextrans in brain parenchyma depended on dextran size in a manner consistent with diffusive rather than convective transport; (ii) transport of dextrans in the parenchymal extracellular space, measured by 2-photon fluorescence recovery after photobleaching, was not affected just after cardiorespiratory arrest; and (iii) Aqp4 gene deletion did not impair transport of fluorescent solutes from sub-arachnoid space to brain in mice or rats. Our results do not support the proposed glymphatic mechanism of convective solute transport in brain parenchyma.

Keywords: CSF; aquaporin 4; convection; diffusion; extracellular space; glymphatic hypothesis; mouse; neuroscience; rat.


Conflict of interest statement

No competing interests declared.

Figures

Figure 1.
Figure 1.. Strongly size-dependent penetration of dextrans into mouse brain from the subarachnoid space following intracisternal injection.
(A) Confocal images showing the distribution of 10, 70 and 2000 kDa fixable dextrans in brain 60 min after their co-injection into the cisterna magna. The lower panels show a higher magnification view of the boxed region in the top right panel. (B) (left) Profile of dextran fluorescence, normalized to fluorescence at the brain surface, as a function of distance from the cortical surface for the rectangular region shown in the lower right panel in A. (right) Cortical depth at which measured fluorescence intensity decreases to half its value at the cortical surface (d1/2, circles, left axis, n = 5 mice, black bars mean ± S.E.M.), and the relative distance that each fluorophore is predicted penetrate in 60 min by diffusion alone (asterisks, right axis). (C) Confocal image of brain cortex 60 min after cisternal injection showing fluorescence along the paravascular space of a penetrating arteriole. (D) (left) Relative fluorescence as a function of distance from the parenchymal surface in the paravascular space outlined on the right of C, measured for each dextran. (right) Distance at which fluorescence intensity decreases to 10% of its initial value (mean ± S.E.M., seven arterioles). (E) High magnification confocal slice through a cortical penetrating arteriole showing subtle differences in the distributions of 10, 70 and 2000 kDa fixable dextrans in the paravascular sheath at 60 min after cisternal injection.
Figure 1—figure supplement 1.
Figure 1—figure supplement 1.. 1-D diffusion modeling of solute transport from the subarachnoid into the brain parenchyma.
(A) Schematic of solute diffusion and mathematical boundary conditions. (B) Concentration profile over time based on equation 1 for indicated diffusion coefficients. (C) Distance at which concentration is reduced by 50% for the indicated diffusion coefficients.
Figure 2.
Figure 2.. Strongly size-dependent transport of dextrans after direct injection into brain parenchyma.
(A) Confocal images showing the distribution of 10, 70 and 2000 kDa fixable dextrans at 10 and 60 min after coinjection into the striatum. (B) (left) Relative fluorescence of each dextran integrated over a circular region centered on the injection site, as a function of radial distance from the center, for the images shown in A. (right) Individual results and mean ± S.E.M. for three experiments showing the distance at which fluorescence decreases to 10% of that at the injection site for each dextran. Asterisks indicate the theoretical relative distance that would be expected for each dextran by diffusion alone. (C) Transport of injected dextrans into the paravascular space of vessels running through the injection site occurred independently of size.
Figure 2—figure supplement 1.
Figure 2—figure supplement 1.. 3-D diffusion modeling of solute transport in the brain cortex.
(A) Schematic of solute diffusion. (B) Concentration profiles over distance for indicated diffusion coefficients.
Figure 3.
Figure 3.. Two-photon photobleaching demonstrates non-directional solute transport in brain parenchyma.
(A) (left panel) Image of 500 kDa FITC-dextran in mouse cortex visualized by 2-photon fluorescence microscopy at a depth of 60 μm. (center panels) Photobleaching of a 10 μm diameter disk immediately adjacent to a penetrating arteriole showing partial recovery of fluorescence in the bleached region 20 s after bleaching. Images are pseudocolored for intensity. (right) Kinetics of fluorescence recovery in the bleached area. (B) Kinetics of fluorescence recovery within subdomains 1–4 of the original bleached area, showing spatially homogenous recovery. (C) Time course of fluorescence measured at different positions away from a nearby arteriole demonstrates confinement of bleached molecules to the initial bleaching area. (D) Positional tracking of the bleached area during recovery (left and center panels), and displacement over time (right panel).
Figure 3—figure supplement 1.
Figure 3—figure supplement 1.. Characterization of 2-photon photobleaching of 500 kDa FITC-dextran.
(A) Recovery curves following bleaching in disks from 5 to 80 μm in diameter measured in vitro. (B) Relationship between bleached disk size and recovery time constant for measurements done as in A. (C) Time constant of recovery following bleaching of a 40 μm diameter disk in vitro and in vivo.
Figure 3—figure supplement 2.
Figure 3—figure supplement 2.. Rapid solute transport in the paravascular space.
(A) Images of 500 kDa FITC-dextran in paravascular space before and following photobleaching show rapid recovery from deep bleaching. (B) Time course of fluorescence recovery following bleaching shown in A.
Figure 3—figure supplement 3.
Figure 3—figure supplement 3.. Quantification of convection verses diffusion from 2-photon photobleaching data.
(A). (left) Schematic of angle-segmened fluorescence recovery. (center) Schematic of fluorescence recovery profiles for four angle segments (each 90 degrees) from the center of mass of the bleached spot. (right) Angular average of fluorescence recovery by simulated convection generated by moving the experimentally recorded images at 0.5 μm/s. (B) (left) Schematic showing expected effect of convection on fluorescence in analysis regions along the direction of flow. (center) Simulated results in the presence of pure diffusion or convection at 0.5 μm/s. (right) Convection was simulated by moving the experimentally recorded images at 0.5 μm/s in the analysis regions. (C) (left) Detected center position of bleached area measured at 5 s intervals in the presence of simulated convection (0.5 μm/s). (right) Displacement of the bleached region in the presence of simulated convection (0, 0.2, 0.5 and 1 μm/s).
Figure 4.
Figure 4.. Effects of abrupt cessation of cardiac and respiratory pulsations on solute transport in brain parenchyma.
(A) Individual frames of a 10 μm diameter circular region (white circle) taken prior to (top panels), immediately following (middle panels) and 4 min after (bottom panels) cardiorespiratory arrest. (B) Fluorescence recovery curves for experiments as in A showing average of 2–3 trials done before (basal), at 1–3 min, or at 4–5 min following cardiorespiratory arrest. (C) Summary of fluorescence recovery half-times (t1/2) before and following cardiopulmonary arrest (mean ± S.E.M., 3 mice). Recovery half-time was not significantly different between baseline and 1–3 min. following cardiorespiratory arrest by t-test (p=0.78).
Figure 5.
Figure 5.. Aqp4 gene deletion does not impair penetration of fluorescent ovalbumin into brain parenchyma from the subarachnoid space.
(A) Fluorescence images of brain sections from Aqp4+/+ and Aqp4-/- mice that were fixed 30 min after injection of Alexa647-labelled ovalbumin into the cisterna magna, showing fluorescence in the paravascular spaces and parenchyma near the brain surface. (B) (left) Thresholding approach used to determine the fraction of the section containing labelled ovalbumin. (right) Fractional area of ovalbumin uptake for individual brain sections at indicated distances from the bregma (mean ± S.E.M., six mice per genotype, p=0.72 by two-way ANOVA). (C) Choosing different threshold levels for image analysis altered the area covered by fluorescence but did not reveal genotype-specific differences. (D) (left) Higher magnification images showing penetration of solute from the brain surface into the parenchyma in Aqp4+/+ and Aqp4-/- mice. (center) Fluorescence intensity as a function of distance from the surface, for the sections shown at left. (right) Average half-penetration distance of solute into the parenchyma from the brain surface in slices from six mice per genotype (mean ± S.E.M.). (E) (left) Distribution of Alexa 647-labelled ovalbumin at 30 min after injection into rat brain. (center) Movement of ovalbumin into the parenchyma from the para-arterial spaces. (right) Average half-distance moved by dye from the paravascular spaces into the striatal parenchyma for Aqp4+/+ (n = 6) and Aqp4-/- (n = 5) rats (mean ± S.E.M.). (F) Distribution of Aβ1-40 following interparenchymal injection in Aqp4+/+ and Aqp4-/- mice. (Left) Average fluorescence intensity of HiLyte-647 Aβ1-40 as a function of radial distance from the injection site. (Right) Distance at which fluorescence decreases to 50% of its value at the center of the injection site (4 Aqp4+/+ mice; 3 Aqp4-/- mice; p=0.42 by t-test).
Figure 5—figure supplement 1.
Figure 5—figure supplement 1.. Computation of solute transport in brain parenchyma for different ECS volume fractions.
(A) (left) Hexagonal spatial arrangement of arterioles and venules (in rodent brain parenchyma) showing triangular computational domain (right) with one arteriole and two venules. (B) Pseudocolored images showing tracer solute accumulation in ECS for indicated ECS volume ratio. Parameters: Pf = 0.04 cm/s, D = 10−10 m2/s. (C) Kinetics of tracer solute accumulation in ECS for indicated ECS volume ratio.

References

    1. Abbott NJ. Evidence for bulk flow of brain interstitial fluid: significance for physiology and pathology. Neurochemistry International. 2004;45:545–552. doi: 10.1016/j.neuint.2003.11.006. - DOI - PubMed
    1. Asgari M, de Zélicourt D, Kurtcuoglu V. How astrocyte networks may contribute to cerebral metabolite clearance. Scientific Reports. 2015;5:15024. doi: 10.1038/srep15024. - DOI - PMC - PubMed
    1. Asgari M, de Zélicourt D, Kurtcuoglu V. Glymphatic solute transport does not require bulk flow. Scientific Reports. 2016;6:38635. doi: 10.1038/srep38635. - DOI - PMC - PubMed
    1. Bakker EN, Bacskai BJ, Arbel-Ornath M, Aldea R, Bedussi B, Morris AW, Weller RO, Carare RO. Lymphatic clearance of the brain: perivascular, paravascular and significance for neurodegenerative diseases. Cellular and Molecular Neurobiology. 2016;36:181–194. doi: 10.1007/s10571-015-0273-8. - DOI - PMC - PubMed
    1. Bedussi B, van Lier MG, Bartstra JW, de Vos J, Siebes M, VanBavel E, Bakker EN. Clearance from the mouse brain by convection of interstitial fluid towards the ventricular system. Fluids and Barriers of the CNS. 2015;12:23. doi: 10.1186/s12987-015-0019-5. - DOI - PMC - PubMed

Publication types

MeSH terms