. 2017 Sep 7;67(5):837-852.e7.
doi: 10.1016/j.molcel.2017.07.022. Epub 2017 Aug 17.

Evolutionarily Conserved Principles Predict 3D Chromatin Organization

Affiliations

Evolutionarily Conserved Principles Predict 3D Chromatin Organization

M Jordan Rowley et al. Mol Cell. .

Abstract

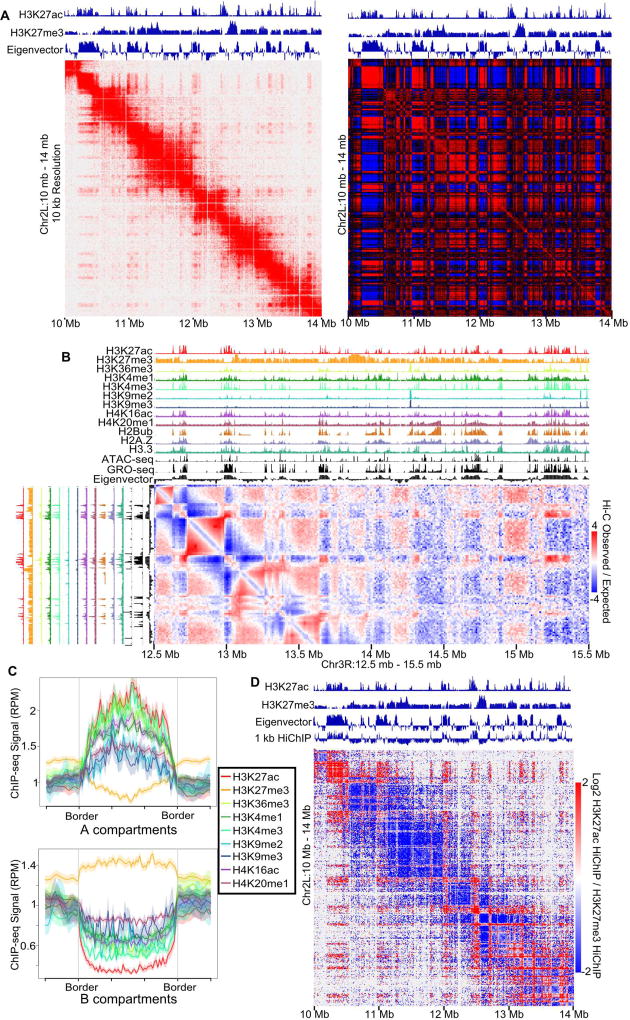
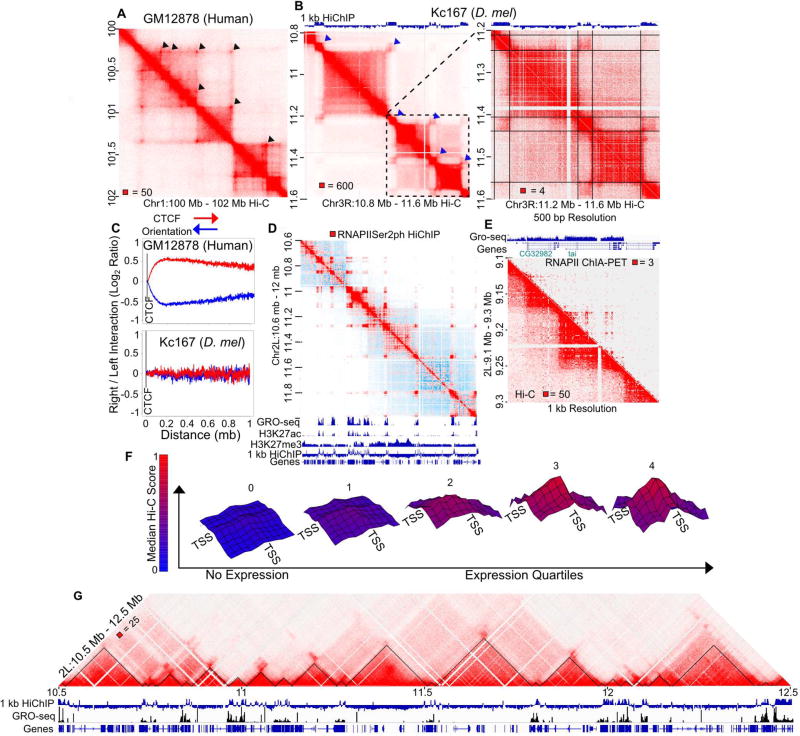
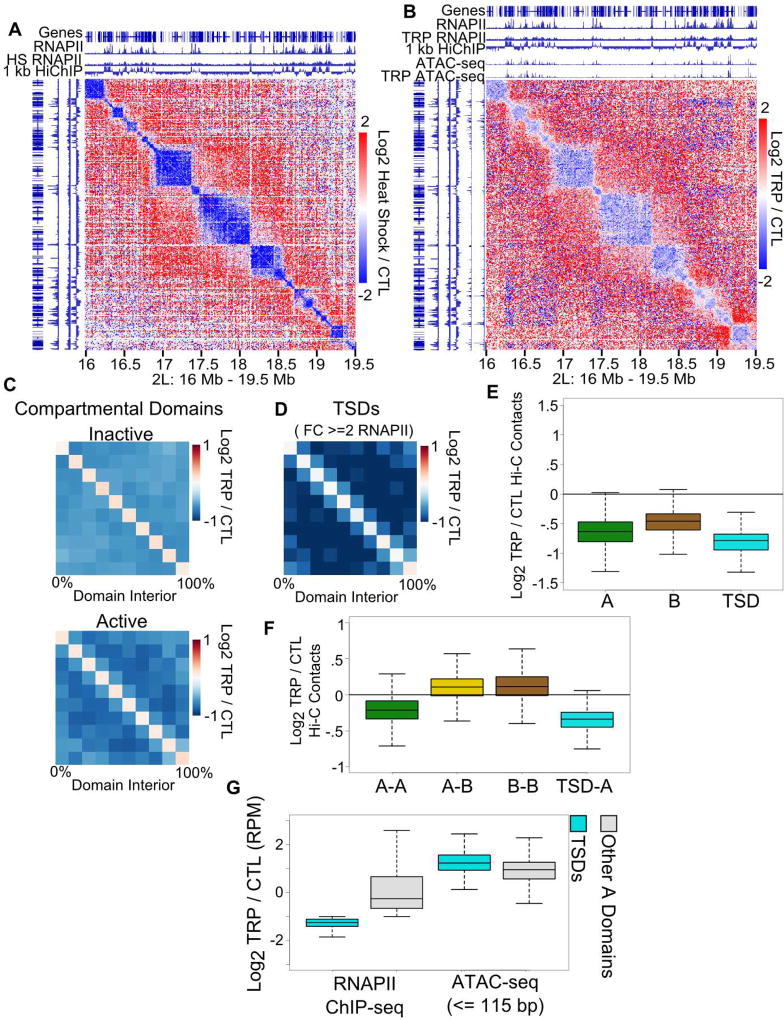
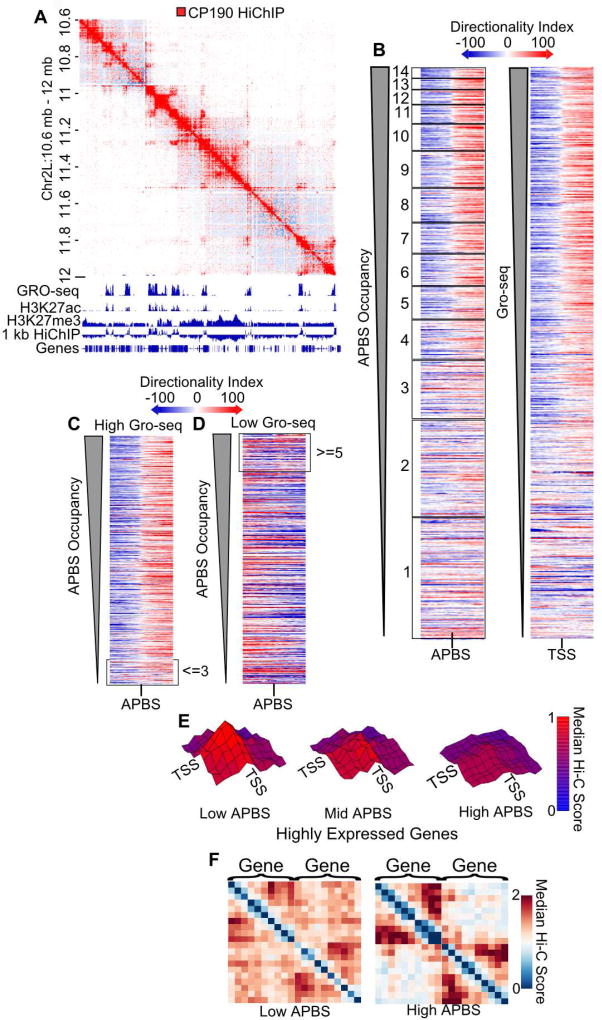
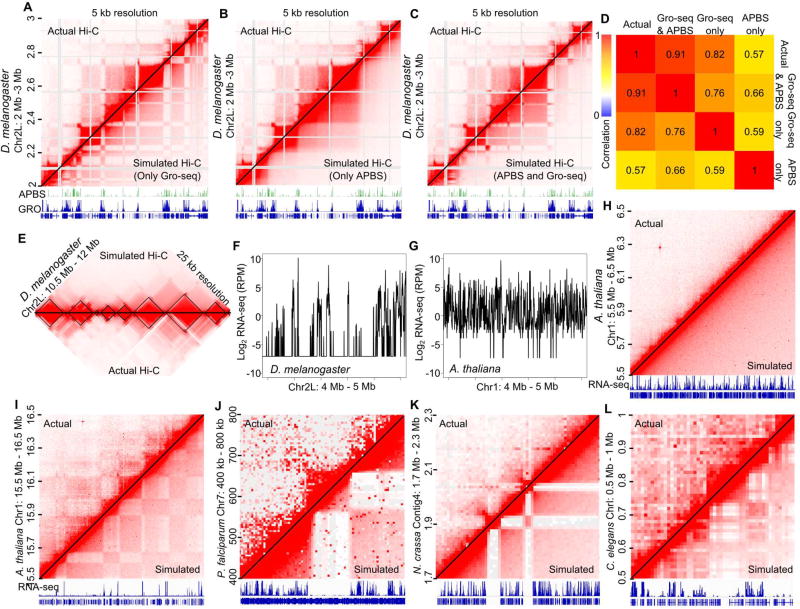
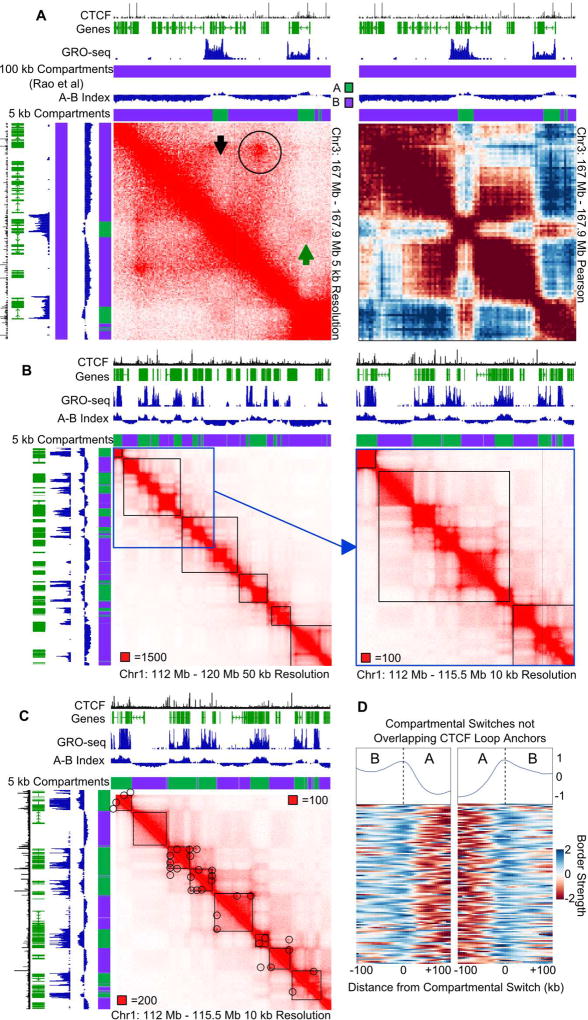
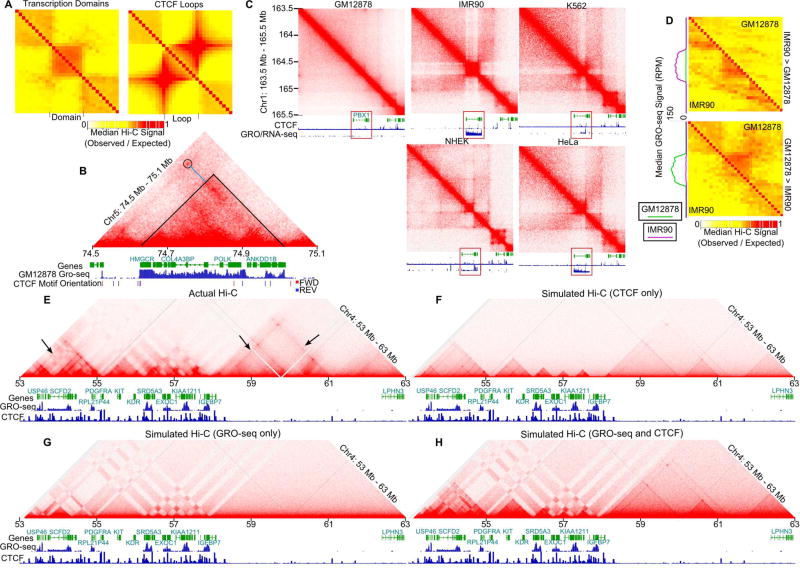
Topologically associating domains (TADs), CTCF loop domains, and A/B compartments have been identified as important structural and functional components of 3D chromatin organization, yet the relationship between these features is not well understood. Using high-resolution Hi-C and HiChIP, we show that Drosophila chromatin is organized into domains we term compartmental domains that correspond precisely with A/B compartments at high resolution. We find that transcriptional state is a major predictor of Hi-C contact maps in several eukaryotes tested, including C. elegans and A. thaliana. Architectural proteins insulate compartmental domains by reducing interaction frequencies between neighboring regions in Drosophila, but CTCF loops do not play a distinct role in this organism. In mammals, compartmental domains exist alongside CTCF loop domains to form topological domains. The results suggest that compartmental domains are responsible for domain structure in all eukaryotes, with CTCF playing an important role in domain formation in mammals.

Keywords: CTCF; Hi-C; TAD; compartment; epigenetics; insulator; loop; transcription.


Figures

Figure 1
Figure 1. Drosophila has Fine-Scale Compartments
A. Left: Normalized Hi-C map of Kc167 cells at 10 kb resolution. Right: Pearson Correlation matrix of Hi-C. The eigenvector and H3K27ac and H3K27me3 ChIP-seq are above the Hi-C plot. B. ChIP-seq for 12 different histone modifications, ATAC-seq, and GRO-seq compared to the Hi-C eigenvector. A slice of the distance normalized Hi-C matrix (observed/expected) is shown corresponding to Chr3R:12.5 Mb – 15.5 Mb (horizontal) and Chr3R:12.5 Mb-13.5 Mb (vertical). C. Active and inactive chromatin correspond to A and B compartments. Average histone modification profiles over A and B compartments. Color coding of ChIP-seq for histone modifications/variants is indicated. D. Compartmental interactions defined by HiChIP. Contact map showing differential contacts for H3K27ac vs H3K27me3 HiChIP visualized by Juicebox. See also Figures S1 and Table S1–S2.
Figure 2
Figure 2. Compartments Explain Domain Organization in Drosophila
A. Contact domains in human cells show enriched interaction signal between borders (arrowheads). Normalized Hi-C map of GM12878 cells at 5 kb resolution. B. Contact domains in Drosophila do not show enriched interaction signal between borders (arrowheads). Normalized Hi-C map of Kc167 cells at 5 kb resolution (left) and 500 bp resolution (right). The A/B compartmental interactions computed by H3K27ac vs H3K27me3 HiChIP are shown above. Lines indicate borders. C. Human CTCF motif orientation has a directional bias, while Drosophila does not. Total interactions as log2 ratio of right/left reads for each distance on right (red) or left (blue) oriented bound CTCF motifs in GM12878 cells (top) or Kc167 cells (bottom). D. HiChIP for phosphorylated RNAPIISer2 captures active compartments. Raw HiChIP signal for phosphorylated RNAPIISer2 (red) overlaying Hi-C signal (blue). Gene annotations, GRO-seq, H3K27ac, and H3K27me3 ChIP-seq are shown below. 1 kb HiChIP indicates H3K27ac/H3K27me3 HiChIP compartmental interaction preference. E. Individual genes can form mini-domains. RNAPII ChIA-PET signal in 1 kb bins (top right). Hi-C signal in 1 kb bins (bottom left). GRO-seq and gene annotations are shown above. F. Distance normalized Hi-C signal at 1 kb resolution is plotted between distinct transcription start sites (TSSs) within the same compartment. Height and color (blue to red) correspond to the relative median observed/expected Hi-C signal. Nodes indicate 1 kb windows from −5 kb to +5 kb surrounding the TSS. Expression level defined by no GRO-seq signal (No Expression) and quartiles of GRO-seq signal. p-value < .05 for each center point (Wilcoxon test compared to no GRO-seq). G. Transcriptional states correspond to Hi-C domains. Transcriptional state domains identified by GRO-seq (black triangles) overlaying Kc167 Hi-C at 1 kb resolution. GRO seq and gene annotations are shown below. 1 kb HiChIP indicates compartmental interaction preference. See also Figure S2–S3 and Table S3.
Figure 3
Figure 3. RNAPII Depletion Alters Drosophila Chromatin Organization
A. Heat shock decreases domain formation. Hi-C heatmap of log2 ratio of heat shocked to control cells (CTL). Gene annotations, control and heat shocked RNAPII ChIP-seq signal are shown above. 1 kb HiChIP indicates compartmental interaction preference. B. Inhibition of transcription decreases domain formation. Hi-C heatmap of log2 ratio of triptolide treated (TRP) to control cells (CTL). Gene annotations, control and triptiolide treated RNAPII ChIP-seq signal are shown above. 1 kb HiChIP indicates compartmental interaction preference. C. Inhibiting transcription decreases contacts in A compartmental domains. Hi-C median metaplot comparing contacts in A and B domains in triptolide treated (TRP) vs control cells (CTL). D. Hi-C median metaplot A compartmental domains with large decreases in RNAPII after triptolide treatment; i.e. triptolide sensitive domains (TSDs). E. Decreases in intra-domain contacts in A and B compartments and in triptolide sensitive domains (TSD) after triptolide treatment. Boxes depict median and interquartile range. F. Ratio of inter-compartmental contact counts in triptolide (TRP) vs control (CTL) treated cells. Boxes depict median and interquartile range. G. Ratio of RNAPII ChIP-seq or ATAC-seq signal in triptolide sensitive domains (TSDs) or other A compartmental domains (nonTSDs). Boxes depict median and interquartile range. See also Figure S4.
Figure 4
Figure 4. Architectural Proteins Insulate Gene-to-Gene Interactions
A. HiChIP for CP190 captures active compartments. HiChIP signal for CP190 (red) overlaying Hi-C signal (blue). Gene annotations, GRO-seq, H3K27ac, and H3K27me3 ChIP-seq are shown below. 1 kb HiChIP indicates compartmental interaction preference. B. Heatmaps of Hi-C directionality anchored and ordered by APBS occupancy (left) or GRO-seq signal (right) show switches in directionality (blue to red). C. Heatmap of APBSs within 250 bp of a highly expressed TSS ordered by APBS occupancy. Low occupancy sites (<= 3 proteins bound) are indicated for comparison with Figure 4B. D. Heatmap of APBSs at least 20 kb away from a highly expressed gene ordered by APBS occupancy. High occupancy sites (>= 5 proteins bound) are indicated for comparison with Figure 4B. E. Distance normalized Hi-C signal at 1 kb resolution is plotted between distinct transcription start sites (TSSs) from the top two GRO-seq quartiles. Low, mid, and high APBSs are defined as the maximum APBS cluster site between genes divided into those containing below 5, 5–8, and above 8 architectural proteins, respectively. Height and color (blue to red) correspond to the relative median observed/expected Hi-C signal. Vertices indicate 1 kb windows from −5 kb to +5 kb surrounding the TSS. p-value < .05 for center point of low APBS compared to high APBS (Wilcoxon text). F. Neighboring genes are insulated by APBSs. Hi-C metaplot of highly expressed neighboring genes separated by low and high occupancy APBSs. See also Figure S3 and Table S3.
Figure 5
Figure 5. Transcriptional States Explain 3D Chromatin Interactions throughout Eukarya
A. Transcription based simulated contact maps predict Hi-C structures. Contact heatmaps at 5 kb resolution using actual Hi-C data (left) and simulated data based on GRO-seq signal only (right). Repetitive/non-mappable regions are shaded grey. Shown below are APBS occupancy counts, GRO-seq, and gene annotations. B. APBS-based simulated contact maps do not fully explain Hi-C heatmaps. Contact heatmaps at 5 kb resolution using actual Hi-C data (left) and simulated data based on APBS occupancy only (right). Repetitive/non-mappable regions are shaded grey. Shown below are APBS occupancy counts, GRO-seq, gene annotations. C. GRO-seq and APBS-based simulated contact maps recapitulate domains and compartments in Drosophila melanogaster. Contact heatmaps at 5 kb resolution using actual Hi-C data (left) and simulated data based on GRO-seq and APBS occupancy (right). Repetitive/non-mappable regions are shaded grey. Shown below are APBS occupancy counts, GRO-seq, and gene annotations. D. Spearman correlation of 5 kb bins of actual Hi-C with simulated Hi-C incorporating APBS occupancy, GRO-seq signal, or both. E. Simulated contacts recapitulate small and large structures. Actual Hi-C (bottom) compared to simulated data (top). TADs are shown in black. F. Drosophila expression varies sharply throughout the genome. Log2 RNA-seq profile of a 1 Mb region in Drosophila melanogaster. G. Arabidopsis expression is linearly constant throughout the genome. Log2 RNA-seq profile of a 1 Mb region in Arabidopsis thaliana. H. Arabidopsis expression profile contributes to lack of visible domain architecture. Contact heatmaps at 10 kb resolution using actual Hi-C data (left) and simulated data based on RNA-seq data (right). RNA-seq and gene annotations are shown below. I–L. Large inactive regions form domain structures throughout Eukarya. Contact heatmaps at 10 kb resolution using actual Hi-C data (left) and simulated data based on RNA-seq data (right). RNA-seq and gene annotations are shown below. Sections of the genome with large inactive regions were selected for A. thaliana (I), P. falciparum (J), N. crassa (K), and C. elegans (L). See also Figure S5.
Figure 6
Figure 6. Compartments are Fine-scale Structures in Human Cells
A. Compartment identification using an A-B index obtained at 5 kb and previously reported compartments at 100 kb, showing identification of smaller A (green) and B (purple) compartments. Gene annotations are shown above and to the left. Left: Hi-C map at 5 kb resolution. Circle indicates a CTCF loop, black arrow indicates a distinct compartment switch within a CTCF loop, green arrow indicates inter-A compartment interactions. Right: Pearson correlation map showing A and B associations. B. Compartmentalization subdivides low-resolution TADs. Black squares denote TAD calls at 40 kb(Moore et al., 2015). Blue square denotes area depicted to the right at higher resolution. C. High resolution TAD calls identify small domains. Black squares denote high resolution TAD calls. Circles denote CTCF loops. D. Compartments create domains in humans. Boundary score at compartmental switches more than 50 kb from a CTCF loop anchor. The median profile is shown above. See also Figure S6.
Figure 7
Figure 7. Transcriptional States and CTCF Loops Contribute to Formation of Domains in Human Cells
A. Transcriptionally active regions form domains distinct from CTCF loops. Scaled meta plot of Hi-C interactions at transcriptionally active regions (left) compared to CTCF loops (right). B. Hi-C heatmap of GM12878 cells at 5 kb resolution. A region where transcriptional activity matches border formation better than CTCF looping (circle) is shown. Blue line indicates CTCF loop anchor. Gene annotations, CTCF forward (red) and reverse (blue) motif orientation, and GRO-seq are shown below. C. Hi-C heatmap comparing GM12878, IMR90, K562, NHEK, and HeLa cells. Tracks comparing GRO-seq/RNA-seq and CTCF occupancy in each cell line are shown below. Red rectangle indicates differentially expressed region. D. Transcriptional activity corresponds to domain formation. Scaled meta-plots of distance normalized (observed/expected) Hi-C contacts surrounding transcriptionally active regions in IMR90 that are transcriptionally inactive in GM12878 (top) or vice versa (bottom). Metaplot of GRO-seq signal in GM12878 (green) and IMR90 (pink) for differentially called regions is shown on the left. E. Transcriptional activity and CTCF looping explains chromatin architecture. Actual Hi-C contact map for a region of chromosome 4. Gene annotations, GRO-seq, and CTCF ChIP-seq signal tracks are shown below. Arrows indicate lines of interactions at CTCF anchors. F. CTCF looping alone cannot explain chromatin organization. Simulation created using CTCF-loop information only. G. Transcription alone cannot explain chromatin organization. Simulation created using GRO-seq signal correlation as the probability of two sites interacting. H. Transcription and CTCF both contribute to chromatin organization. Simulation created using CTCF-loop information as well as GRO-seq signal as a measurement of transcriptional activity. Contacts are a feature of CTCF loops and the correlation in GRO seq between loci. See also Figure S7.

References

    1. Andersson R, Refsing Andersen P, Valen E, Core LJ, Bornholdt J, Boyd M, Heick Jensen T, Sandelin A. Nuclear stability and transcriptional directionality separate functionally distinct RNA species. Nat. Commun. 2014;5:5336. - PubMed
    1. Ay F, Bunnik EM, Varoquaux N, Bol SM, Prudhomme J, Vert J-P, Noble WS, Le Roch KG. Three-dimensional modeling of the P. falciparum genome during the erythrocytic cycle reveals a strong connection between genome architecture and gene expression. Genome Res. 2014;24:974–988. - PMC - PubMed
    1. Corces MR, Buenrostro JD, Wu B, Greenside PG, Chan SM, Koenig JL, Snyder MP, Pritchard JK, Kundaje A, Greenleaf WJ, et al. Lineage-specific and single-cell chromatin accessibility charts human hematopoiesis and leukemia evolution. Nat. Genet. 2016;48:1193–1203. - PMC - PubMed
    1. Core LJ, Waterfall JJ, Lis JT. Nascent RNA sequencing reveals widespread pausing and divergent initiation at human promoters. Science. 2008;322:1845–1848. - PMC - PubMed
    1. Core LJ, Waterfall JJ, Gilchrist DA, Fargo DC, Kwak H, Adelman K, Lis JT. Defining the status of RNA polymerase at promoters. Cell Rep. 2012;2:1025–1035. - PMC - PubMed

MeSH terms