. 2017 Sep 12;114(37):E7746-E7755.
doi: 10.1073/pnas.1706070114. Epub 2017 Aug 21.

Human genetic variation in VAC14 regulates Salmonella invasion and typhoid fever through modulation of cholesterol

Affiliations

Human genetic variation in VAC14 regulates Salmonella invasion and typhoid fever through modulation of cholesterol

Monica I Alvarez et al. Proc Natl Acad Sci U S A. .

Erratum in

Abstract

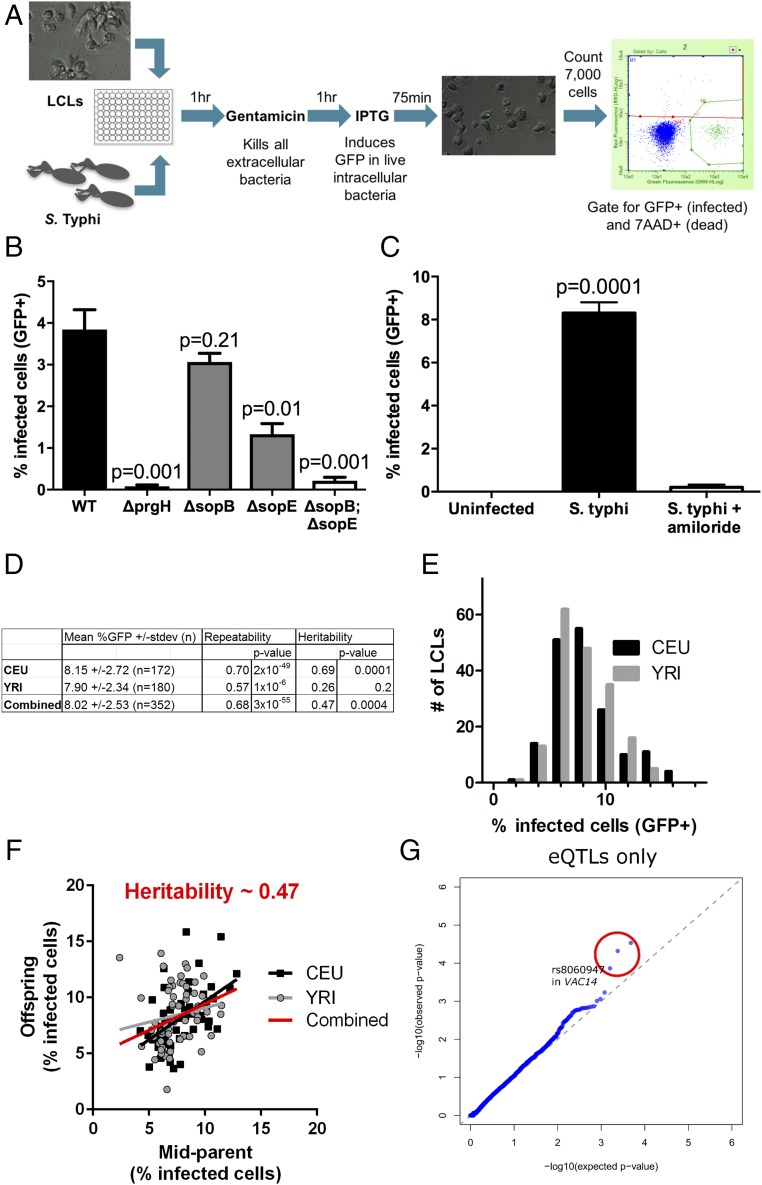
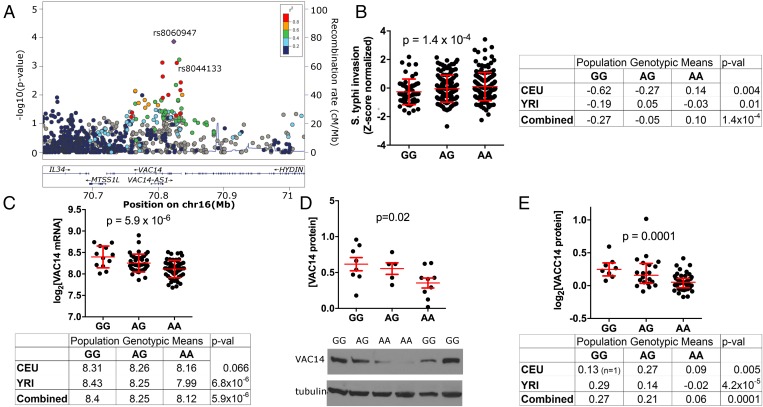
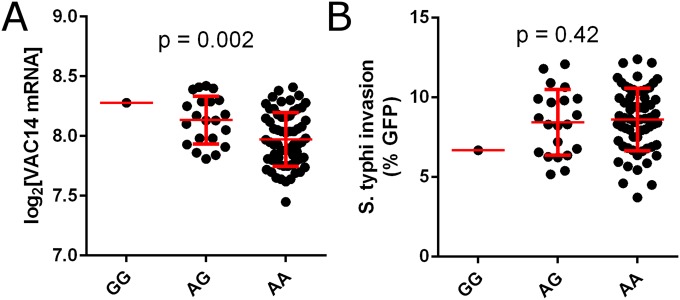
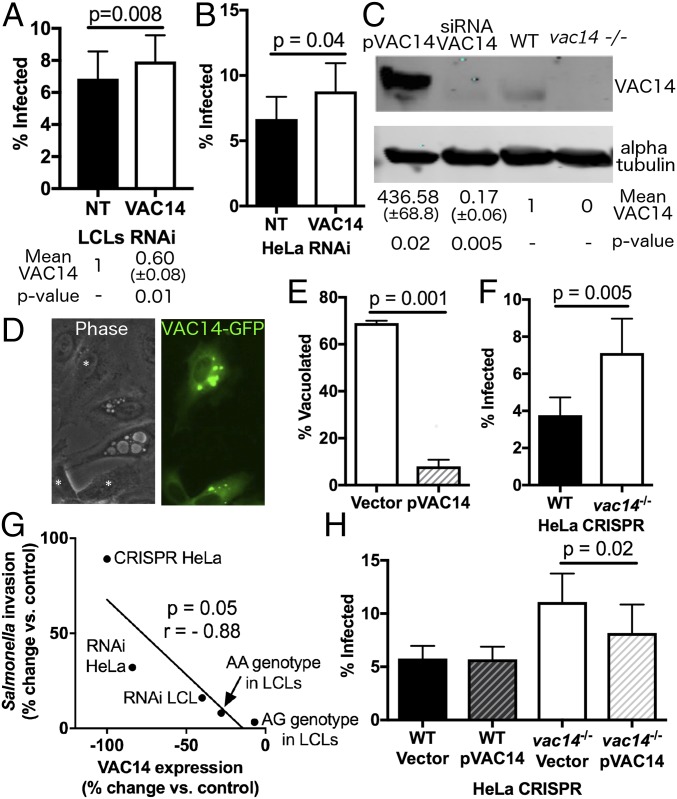
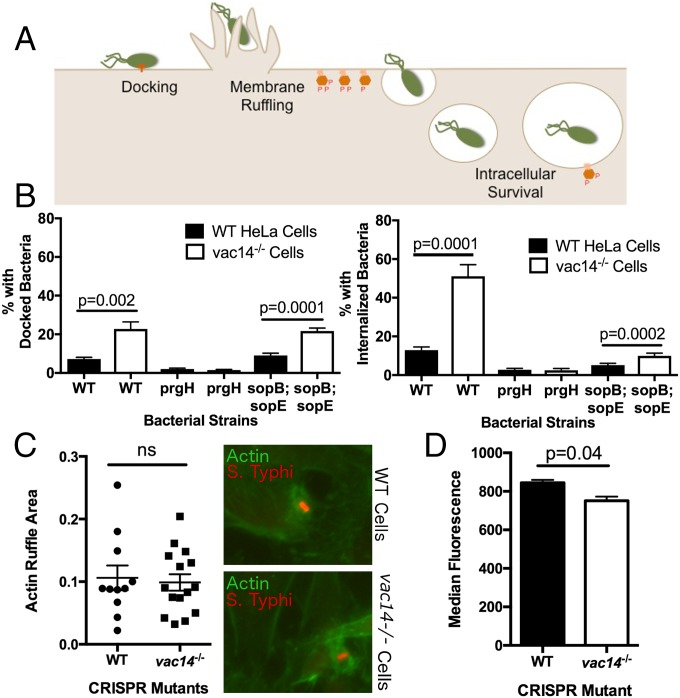
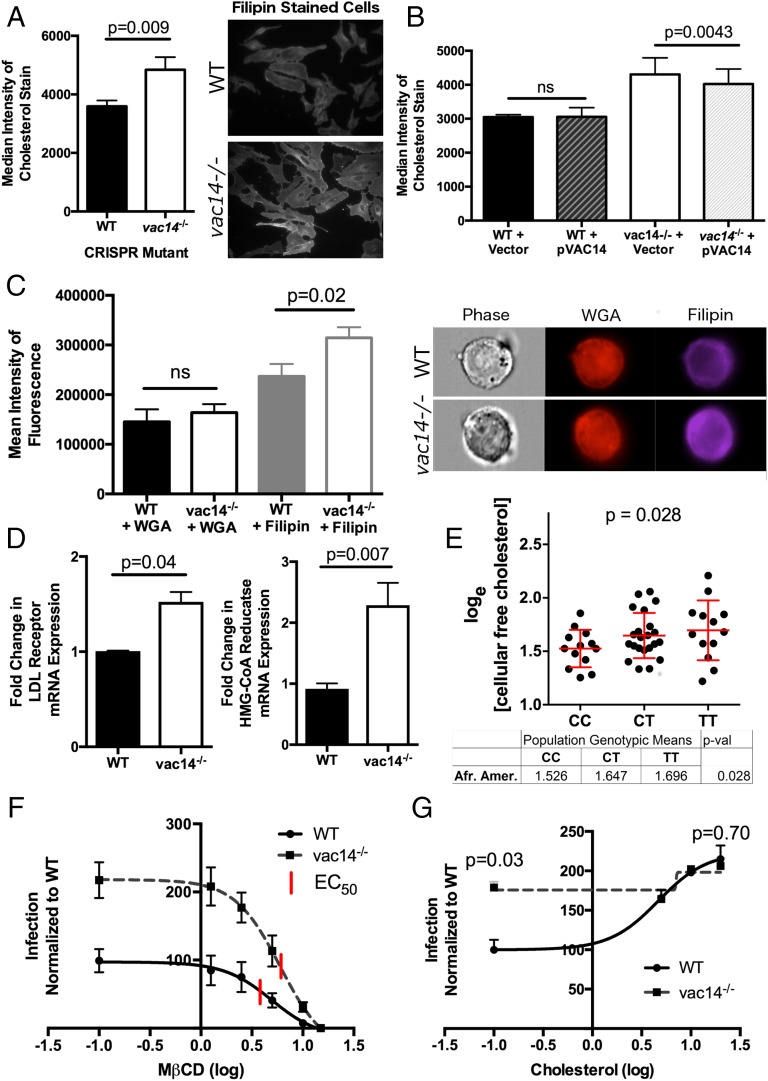
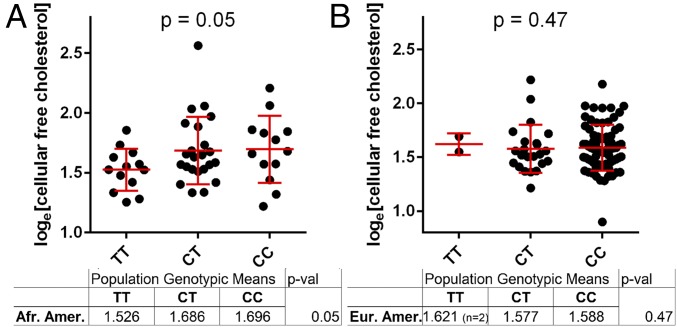
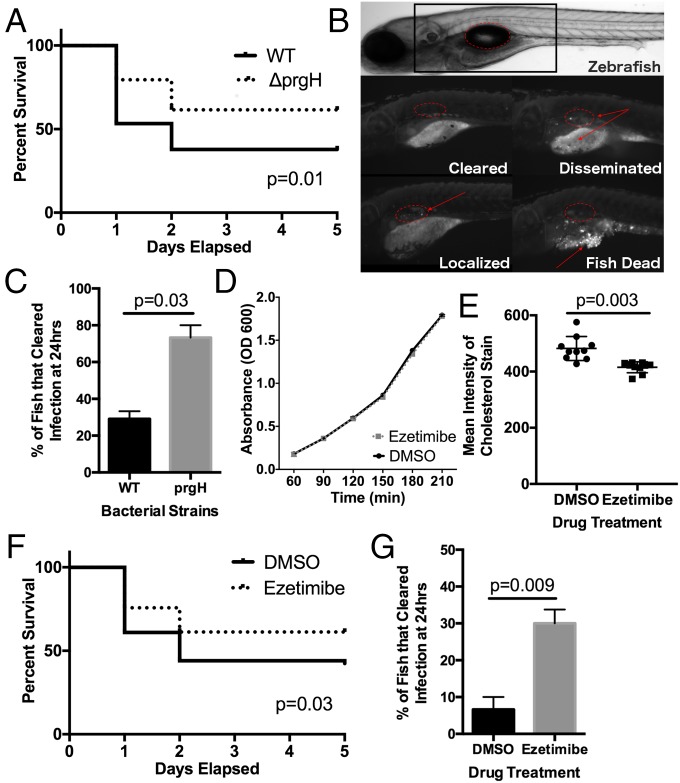
Risk, severity, and outcome of infection depend on the interplay of pathogen virulence and host susceptibility. Systematic identification of genetic susceptibility to infection is being undertaken through genome-wide association studies, but how to expeditiously move from genetic differences to functional mechanisms is unclear. Here, we use genetic association of molecular, cellular, and human disease traits and experimental validation to demonstrate that genetic variation affects expression of VAC14, a phosphoinositide-regulating protein, to influence susceptibility to Salmonella enterica serovar Typhi (S Typhi) infection. Decreased VAC14 expression increased plasma membrane cholesterol, facilitating Salmonella docking and invasion. This increased susceptibility at the cellular level manifests as increased susceptibility to typhoid fever in a Vietnamese population. Furthermore, treating zebrafish with a cholesterol-lowering agent, ezetimibe, reduced susceptibility to S Typhi. Thus, coupling multiple genetic association studies with mechanistic dissection revealed how VAC14 regulates Salmonella invasion and typhoid fever susceptibility and may open doors to new prophylactic/therapeutic approaches.

Keywords: Salmonella pathogenicity island 1; ezetimibe; lymphoblastoid cell line; phosphoinositide; single nucleotide polymorphism.


Conflict of interest statement

The authors declare no conflict of interest.

Figures

Fig. 1.
Fig. 1.
Invasion of S. Typhi into LCLs occurs via SPI-1–dependent macropinocytosis. (A) Schematic of the flow cytometric assay of S. Typhi invasion into LCLs. Following 1 h incubation with S. Typhi, gentamicin was added to kill extracellular bacteria. IPTG was added to induce expression of GFP in living, intracellular bacteria, and the percentage of GFP+ infected cells was quantified by flow cytometry. (B) Invasion of S. Typhi into LCLs requires SPI-1 TTSS and SPI-1 effectors. The percentage of infected cells identified by flow cytometry is dramatically reduced with deletion of the gene encoding the SPI-1 TTSS component prgH or by deletion of the genes encoding the secreted effectors sopE and sopB. Data presented are the mean ± SEM from three independent experiments. P values in B and C are from t tests. Data are from LCL 7056 from the CEU population. Similar data were observed with LCL 19203 from the YRI population (Fig. S1). (C) Invasion of S. Typhi into LCLs is blocked by amiloride, an inhibitor of macropinocytosis. Cells were pretreated for 30 min with 1 mM amiloride before infection with S. Typhi. Data presented are the mean ± SEM from four biological replicates. (D) Highly reproducible and heritable variation in S. Typhi invasion into LCLs. Data presented are the mean ± SD from independent measurements from three serial passages of LCLs from CEU and YRI populations. Repeatability of the measurement was calculated as the interindividual component of variance from ANOVA. Heritability was calculated by parent–offspring regression, and P values are significance of nonzero slope. For DG, n = 352 LCLs. (E) Histogram of distribution of S. Typhi invasion (percentage GFP+ at 3.5 h) into LCLs. (F) Invasion of S. Typhi into LCLs is heritable. Parent–offspring regression from CEU (black squares) and YRI (gray circles) trios gives a slope of 0.47, estimating that 47% of the variance for the trait is heritable. (G) A Q–Q plot of P values for only cis-eQTLs reveals P values lower than expected by chance for P < 0.001. In ref. , 4787 cis-eQTLs were identified. rs8060947 in VAC14 has the third lowest P value in the Q–Q plot (1.4 × 10⁻⁴). Characteristics of the cis-eQTLs within the red circle are given in Table S1. A Q–Q plot of all SNPs is shown in Fig. S2.
Fig. S1.
Fig. S1.
Specificity of the invasion phenotype demonstrated in LCL 19203 from the YRI population. The percentage of infected cells quantified by flow cytometry is dramatically reduced with deletion of the gene encoding the SPI-1 TTSS component prgH or by deletion of the genes encoding the secreted effectors sopE and sopB. Data shown are the mean ± SEM from three independent experiments.
Fig. S2.
Fig. S2.
A Q–Q plot of P values for all SNPs for the invasion association screen demonstrates that most SNPs follow the expected neutral distribution.
Fig. 2.
Fig. 2.
A SNP in VAC14 is associated with VAC14 expression and S. Typhi invasion. (A) Regional plot around the VAC14 gene demonstrates an association of rs8060947 with S. Typhi invasion. SNPs are plotted by position on chromosome 16 and by −log(P value) and are color-coded by r2 value to rs8060947 from 1,000 Genomes European data. rs8060947 is located within the first intron of VAC14. A second labeled SNP in high LD, rs8044133, is described in the text. (B) rs8060947 is associated with susceptibility of LCLs to S. Typhi invasion. The derived allele A is associated with increased levels of invasion in CEU and YRI populations. For genotypic means, percent invasion for each individual has been normalized into a Z-score to minimize a batch effect due to measurement of LCLs at two different times. P values are from family-based association analysis using QFAM-parents in PLINK. (C) rs8060947 is associated with the expression of VAC14 mRNA. The derived allele A is associated with lower levels of VAC14 mRNA in CEU and YRI populations (n = 60 unrelated individuals in each population). Gene expression values for each LCL are from ref. . Genotypic means are given for each population and for individuals from both populations combined. P values in CE are from linear regression. (D) rs8060947 is associated with the expression of VAC14 protein levels. The derived allele A is associated with lower VAC14 protein. VAC14 protein was quantified by immunoblotting of 22 LCLs with β-tubulin as a loading control. The intensity of the VAC14 band normalized to β-tubulin was averaged from two separate scanned blots. (E) Confirmation of the association of rs8060947 with VAC14 protein. VAC14 protein levels were obtained from a mass spectrometry dataset with CEU (n = 47) and YRI (n = 28) LCLs (8).
Fig. S3.
Fig. S3.
(A) rs8060947 is associated with the expression of VAC14 mRNA. The derived allele A is associated with lower levels of VAC14 mRNA in Asian (CHB and JPT) populations (P = 0.002; 85 unrelated individuals). Gene expression values for each LCL are from ref. . The P value is from linear regression. (B) rs8060947 is not associated with susceptibility of LCLs to S. Typhi invasion. As in CEU and YRI populations, the AA > AG > GG pattern is observed, but the association is not significant (P = 0.42). The P value is from linear regression using with PCA correction in PLINK.
Fig. 3.
Fig. 3.
Loss-of-function studies and complementation indicate that VAC14 limits Salmonella invasion. (A) Reduction of VAC14 expression in LCLs by RNAi increases S. Typhi invasion. Percentages of S. Typhi invasion of 18,507 LCLs (YRI population) treated with either nontargeting (NT) or VAC14 siRNA demonstrated increased invasion with VAC14 depletion (P = 0.008). Data shown are the mean ± SEM of three experiments. Quantification of three Western blots of VAC14 knockdown showed 40% reduction in VAC14 protein levels (P = 0.01). (B) Reduction of VAC14 expression in HeLa cells by RNAi increased S. Typhi invasion. Shown are percentages of S. Typhi invasion in HeLa cells treated with either NT or VAC14 siRNA (P = 0.02). Data shown are the mean ± SEM from four experiments. (C) Representative Western blot of VAC14 protein demonstrated endogenous protein levels (WT), effective RNAi (siRNA VAC14), CRISPR knockout (vac14−/−), and plasmid overexpression (pVAC14) in HeLa cells. Protein extracted from each lane was collected from 300,000 cells, and α-tubulin was used as a loading control. Values below the blots show the mean ± SEM of three Western blots. (D) vac14−/− HeLa cells contain enlarged vacuoles, and transfection of pVAC14 rescued the vacuolated phenotype. Asterisks in the phase image denote cells that are transiently transfected with pVAC14-GFP. (E) Quantified (n = 100) vacuole-containing vac14−/− HeLa cells transfected with pVAC14-GFP demonstrated complementation (P = 0.001). (F) Complete loss of VAC14 protein expression in HeLa cells by CRISPR/Cas9 mutation increased S. Typhi invasion. S. Typhi invasion percentages demonstrated increased invasion in vac14−/− compared with WT cells (P = 0.005). Data shown are the mean ± SEM from four experiments. (G) Increase in Salmonella invasion is inversely correlated with VAC14 depletion (P = 0.05, r = −0.88). Increases in invasion percentage and the percentage of VAC14 protein depletion are calculated relative to Salmonella invasion with the GG allele in LCLs, NT siRNA controls, or WT HeLa cell controls. (H) Transient transfection of pVAC14 in vac14−/− cells complements invasion phenotype (P = 0.02). Data shown are the mean ± SEM from five experiments. All P values are calculated from paired t tests.
Fig. S4.
Fig. S4.
Characterization of the genetic lesion in VAC14 CRISPR knockout. PCR amplification of a 603-bp region in the VAC14 gene of genomic DNA from the 364C mutant cell line revealed two bands of equal intensity, one around 600 bp and the other around 750 bp. DNA sequencing of the individually cloned mutant alleles revealed two mutant alleles with insertions (red boxes): a 761-bp PCR product found to have a 158-bp insertion and a 604-bp PCR product containing a single additional adenine located 12 bp downstream of the start codon (green box). Both insertions are predicted to cause premature stop codons.
Fig. 4.
Fig. 4.
Loss of VAC14 enhances S. Typhi docking. (A) Schematic of cellular processes where VAC14 could affect Salmonella invasion. Phosphoinositides (orange hexagons) are known to be involved in macropinocytosis and SCV maturation. (B) Loss of VAC14 increases S. Typhi docking. WT and vac14−/− HeLa cells were infected with three different S. Typhi bacterial strains (WT, ΔprgH, and a ΔsopB;ΔsopE double mutant). Cells were infected with fluorescently green S. Typhi for 1 h, washed, and fixed. External, adhered bacteria were stained with anti-Salmonella LPS (red). Bacteria were counted as either green only (internalized) or green and red (adhered). Cell counts were obtained by counting DAPI-stained nuclei. (C) Loss of VAC14 has no effect on membrane ruffling. WT and vac14−/− cells were infected with fluorescently labeled S. Typhi (pseudocolored red) for 15 min at a MOI of 50, washed, fixed, stained with Phalloidin-647 (pseudocolored green) for 20 min, and imaged. The area of actin ruffle was measured using Fiji (103); no difference between WT and vac14−/− cells was detected (P = 0.749). (D) Loss of VAC14 does not increase S. Typhi intracellular survival. Early intracellular survival was measured by quantifying median fluorescence of each cell 8 h post invasion. GFP fluorescence was induced 75 min before measurement; after a 1-h gentamicin treatment the green fluorescence represents living intracellular bacteria. Therefore, higher median fluorescence reflects an increased number of living GFP fluorescent bacteria inside each cell. A slightly significant decrease was detected (P = 0.04) and therefore cannot account for the increase in invasion. In all panels the mean ± SEM for three independent experiments or a minimum of 100 imaged cells are shown. P values are calculated from a paired t test.
Fig. 5.
Fig. 5.
Loss of VAC14 increases cholesterol at the plasma membrane. (A) vac14−/− cells have increased total cholesterol. WT and vac14−/− cells were fixed and stained with filipin, and fluorescence was measured by flow cytometry (P = 0.009). Fluorescent microscopy of WT and vac14−/− cells also shows increased filipin staining in the vac14−/− cells. Data shown are the mean ± SEM from three independent experiments. (B) Transient transfection of pVAC14 partially rescues cholesterol phenotype. Decreased filipin staining by flow cytometry was measured in vac14−/− cells transfected with pVAC14, while no difference was detected in transfected WT cells (P = 0.004). Data shown are the mean ± SEM from four independent experiments. ns, not significant. (C) vac14−/− cells have increased cholesterol at the plasma membrane. Imaging flow cytometry was used to image and measure WGA (cell membrane staining) and filipin staining in WT and vac14−/− cells. No difference is seen in WGA staining, while filipin staining at the plasma membrane is significantly increased in vac14−/− cells (P = 0.02). Data shown are the mean ± SEM from three independent experiments. (D) Expression of LDLR and HMG-Co-A Reductase mRNA are increased in vac14−/− cells. qPCR analysis of LDLR and HMGCR was done on WT and vac14−/− cells using 18S rRNA to normalize. Data shown are the mean ± SEM from three independent experiments for LDLR and four independent experiments for HMGCR. (E) rs8044133 is associated with free cholesterol levels in 48 CAP African American LCLs (P = 0.028). Cellular free cholesterol was measured using the Amplex Red Cholesterol Assay Kit, and rs8044133 genotypes were imputed. One heterozygous outlier was removed based on Grubbs’ test (P < 0.01). One-tailed P values are from linear regression. African American data without the outlier removed (P = 0.05) and European American data (P = 0.47) are shown in Fig. S5. (F) Cholesterol depletion with MβCD reduces S. Typhi invasion. The EC50 was significantly higher in vac14−/− cells than in WT cells (P = 0.02) indicating that greater amounts of MβCD are needed to overcome the higher cellular cholesterol in vac14−/− cells. Data shown are the mean ± SEM from nine independent experiments. (G) Repletion of cholesterol increases S. Typhi invasion. Exogenous cholesterol increases invasion in WT cells to levels similar to vac14−/− cells. Data shown are the mean ± SEM from four independent experiments. The P value is calculated from a paired t test.
Fig. S5.
Fig. S5.
(A) rs8044133 is associated with free cholesterol levels in 49 CAP African American LCLs (P = 0.05). Cellular free cholesterol was measured using the Amplex Red Cholesterol Assay Kit, and rs8044133 genotypes were imputed. One-tailed P values are from linear regression. (B) rs8044133 is not associated with free cholesterol levels in 98 CAP European American LCLs. Cellular free cholesterol was measured using the Amplex Red Cholesterol Assay Kit, and rs8044133 genotypes were imputed. One-tailed P values are from linear regression.
Fig. 6.
Fig. 6.
Ezetimibe is protective in a zebrafish model of S. Typhi infection. (A) Fish infected with S. Typhi prgH had increased survival compared with fish infected with WT S. Typhi (P = 0.01). The survival curve was carried out for 5 d; fish were checked once each day. (B) Zebrafish were scored 24 h post S. Typhi infection as cleared (no bacteria), localized (bacteria only in the swim bladder), disseminated (bacteria found outside the swim bladder), or dead (fish dead due to bacterial burden). The swim bladders are denoted by red circles; bacteria are denoted by the red arrows. (C) Fish infected with the S. Typhi prgH mutant had increased clearance of bacteria at 24 h (P = 0.03). (D) Ezetimibe had no effect on S. Typhi bacterial growth. Bacteria were diluted from an overnight stock and grown with DMSO or 10 µM ezetimibe. The OD600 was taken every 30 min for 3.5 h. Data points are the mean from two separate experiments. (E) Ezetimibe decreased filipin staining in fish. Twenty-four–hour pretreatment with 10 µM ezetimibe reduced filipin (0.05 mg/mL) staining (P = 0.003) in zebrafish; n = 20 fish from two separate experiments; P value from an unpaired t test. (F) Fish pretreated with ezetimibe had increased survival from S. Typhi infection compared with DMSO-pretreated controls (P = 0.03). (G) Ezetimibe treatment increased bacterial clearance in fish. Twenty-four–hour pretreatment with 10 µM ezetimibe increased the percentage of fish that cleared the bacteria 24 h postinfection from 8 to 30% (P = 0.009). Infection data for each survival curve and clearance comparisons are from three independent experiments with a minimum of n = 60 fish. P values from survival curves are from the Mantel–Cox test; P values for other comparisons are from unpaired t tests.

Comment in

References

    1. Dougan G, Baker S. Salmonella enterica serovar Typhi and the pathogenesis of typhoid fever. Annu Rev Microbiol. 2014;68:317–336. - PubMed
    1. Bhan MK, Bahl R, Bhatnagar S. Typhoid and paratyphoid fever. Lancet. 2005;366:749–762. - PubMed
    1. Marineli F, Tsoucalas G, Karamanou M, Androutsos G. Mary Mallon (1869–1938) and the history of typhoid fever. Ann Gastroenterol. 2013;26:132–134. - PMC - PubMed
    1. Mason WP. Typhoid Mary. Science. 1909;30:117–118. - PubMed
    1. Dunstan SJ, et al. Variation at HLA-DRB1 is associated with resistance to enteric fever. Nat Genet. 2014;46:1333–1336. - PMC - PubMed

Publication types

MeSH terms