. 2017 Sep 5;114(36):E7536-E7544.
doi: 10.1073/pnas.1706356114. Epub 2017 Aug 21.

Foxp3-independent mechanism by which TGF-β controls peripheral T cell tolerance

Affiliations

Foxp3-independent mechanism by which TGF-β controls peripheral T cell tolerance

Soyoung A Oh et al. Proc Natl Acad Sci U S A. .

Abstract

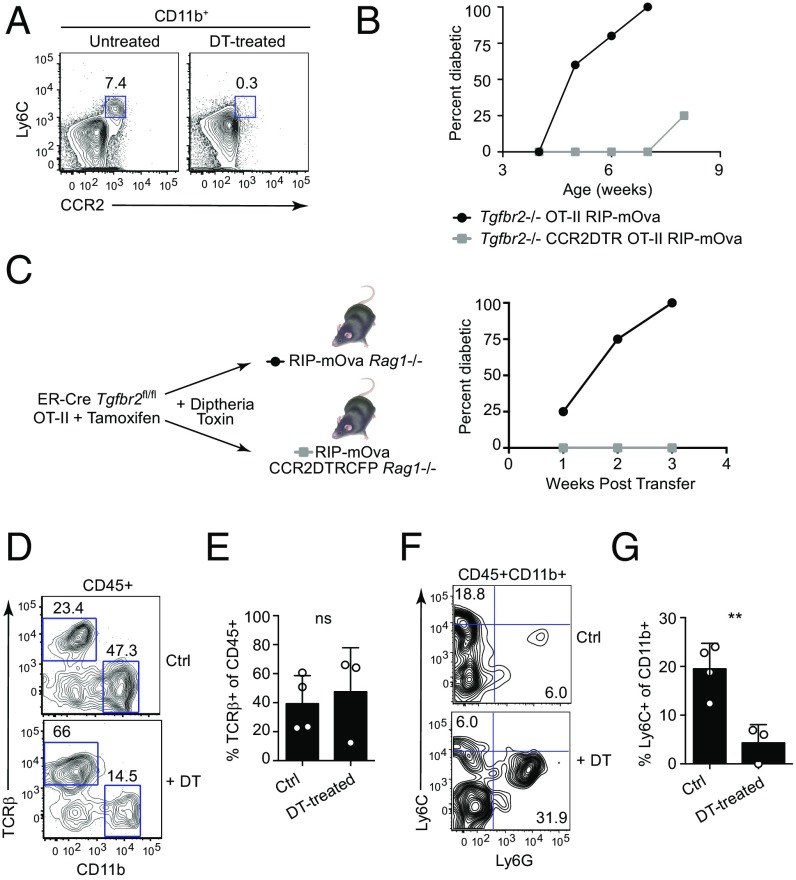
Peripheral T cell tolerance is promoted by the regulatory cytokine TGF-β and Foxp3-expressing Treg cells. However, whether TGF-β and Treg cells are part of the same regulatory module, or exist largely as distinct pathways to repress self-reactive T cells remains incompletely understood. Using a transgenic model of autoimmune diabetes, here we show that ablation of TGF-β receptor II (TβRII) in T cells, but not Foxp3 deficiency, resulted in early-onset diabetes with complete penetrance. The rampant autoimmune disease was associated with enhanced T cell priming and elevated T cell expression of the inflammatory cytokine GM-CSF, concomitant with pancreatic infiltration of inflammatory monocytes that triggered immunopathology. Ablation of the GM-CSF receptor alleviated the monocyte response and inhibited disease development. These findings reveal that TGF-β promotes T cell tolerance primarily via Foxp3-independent mechanisms and prevents autoimmunity in this model by repressing the cross talk between adaptive and innate immune systems.

Keywords: T cell; TGF-β; autoimmunity; tolerance.


Conflict of interest statement

Conflict of interest statement: The editor, A.Y.R., notes that he shares an institutional affiliation with the authors and coauthored a review article with M.O.L. in 2016.

Figures

Fig. 1.
Fig. 1.
OT-II T cells encounter antigen in the pancreas-draining lymph nodes of OT-II RIP-mOva mice. (A) Flow cytometric analysis of CD62L and CD44 expression on T cells from the nondraining and pancreatic lymph nodes from single-transgenic OT-II Rag1-deficient and double-transgenic OT-II RIP-mOva Rag1-deficient mice. Numbers indicate the percentage of cells in the respective gates. (B) The graph shows percentages of naive CD62L+CD44lo T cells from nondraining and pancreatic lymph nodes from OT-II Rag1-deficient and OT-II RIP-mOva Rag1-deficient mice. Circles represent individual mice. Error bars indicate the mean ± SEM. Statistical significance was calculated using a two-tailed unpaired Student’s t test. ns, not significant. (C) Flow cytometric analysis of CD69 expression on T cells from the nondraining and pancreatic lymph nodes of OT-II Rag1-deficient and OT-II RIP-mOva Rag1-deficient mice. Numbers indicate the percentage of cells in the respective gates. (D) The graph shows the percentage of CD69-expressing T cells from the nondraining and pancreatic lymph nodes of OT-II Rag1-deficient and OT-II RIP-mOva Rag1-deficient mice. Circles represent individual mice. Error bars indicate mean ± SEM. Statistical significance was calculated using a two-tailed unpaired Student’s t test. *P < 0.05.
Fig. 2.
Fig. 2.
TGF-β promotes T cell tolerance via Treg cell-independent mechanisms. (A) Flow cytometric analysis of Foxp3 and CD25 expression among lymph node T cells from OT-II Rag1-deficient and OT-II RIP-mOva Rag1-deficient mice. Numbers indicate the percentage of cells in the respective gates. (B) The graph shows the percentage of Foxp3+CD25+ cells among total lymph node T cells in OT-II Rag1-deficient and OT-II RIP-mOva Rag1-deficient mice. Circles represent individual mice. Error bars indicate mean ± SEM. Statistical significance was calculated using a two-tailed unpaired Student’s t test. **P ≤ 0.01. (C) Flow cytometric analysis of pSmad2/3 in T cells from the nondraining (dotted lines) and pancreatic (solid lines) lymph nodes of OT-II Rag1-deficient and OT-II RIP-mOva Rag1-deficient mice. The tinted gray histogram represents the fluorescence minus one (FMO) control. (D) The graph shows the mean fluorescence intensity (MFI) of pSmad2/3 staining in T cells from the nondraining and pancreatic lymph nodes of OT-II Rag1-deficient (white squares) and OT-II RIP-mOva Rag1-deficient (black circles) mice. Lines connect the pSmad2/3 MFI values from the nondraining and pancreatic lymph nodes of the same mouse. Statistical significance was calculated using the paired Student’s t test. (E) The graph shows the incidence of diabetes versus age for Tgfbr2−/− OT-II RIP-mOva Rag1-deficient (circles, n = 16), Foxp3sf OT-II RIP-mOva Rag1-deficient (squares, n = 11), and control OT-II RIP-mOva Rag1-deficient (triangles, n = 8) mice. (F) RIP-mOva Rag1-deficient mice were adoptively transferred with ER-Cre Tgfbr2fl/fl OT-II T cells (circles, n = 12), Foxp3sf OT-II T cells (squares, n = 7), or control OT-II T cells (triangles, n = 6) and were monitored for diabetes development. The graph shows the incidence of diabetes versus time after T cell transfer.
Fig. S1.
Fig. S1.
Treg cell phenotype and conditional ablation of TβRII in T cells. (A) Flow cytometric analysis of Foxp3 and CD25 expression among total (Left), CD69 (Center), and CD69+ (Right) CD4+TCRβ+ cells from the lymph nodes of control OT-II RIP-mOva Rag1-deficient mice. Numbers indicate the frequency of cells in the respective gates. (B) Flow cytometric analysis of Foxp3 and CD25 expression among CD4+TCRβ+ cells from the lymph nodes of control (Left) and Tgfbr2−/− (Center) OT-II RIP-mOva Rag1-deficient mice. (Right) The dot plot shows FMO control staining. The graph shows the frequency of FoxP3+CD25+ cells among total CD4+TCRβ+ cells from control and Tgfbr2−/− OT-II RIP-mOva Rag1-deficient mice. Circles represent individual mice. Error bars indicate mean ± SEM. (C) Representative flow cytometric analysis of TβRII expression on ER-Cre Tgfbr2fl/fl OT-II T cells transferred into RIP-mOva Rag1-deficient recipients that were untreated (solid line) or tamoxifen treated (dashed line) to induce Tgfbr2 deletion. The solid gray histogram represents the FMO control.
Fig. 3.
Fig. 3.
Enhanced T cell priming in the absence of TβRII in T cells. (A) Flow cytometric analysis of CD62L and CD44 expression on T cells from the pancreatic lymph nodes of nondiabetic control OT-II RIP-mOva Rag1-deficient, diabetic Tgfbr2−/− OT-II RIP-mOva Rag1-deficient, and diabetic Foxp3sf OT-II RIP-mOva Rag1-deficient mice. Numbers indicate the percentage of cells in the respective gates. (B) The graph shows the percentage of activated CD62LCD44+ T cells in the pancreatic lymph nodes of nondiabetic control OT-II RIP-mOva Rag1-deficient, diabetic Tgfbr2−/− OT-II RIP-mOva Rag1-deficient, and diabetic Foxp3sf OT-II RIP-mOva Rag1-deficient mice. Circles represent individual mice. Error bars indicate mean ± SEM. Statistical significance was calculated using a two-tailed unpaired Student’s t test. *P < 0.05, ****P ≤ 0.0001. (C) Flow cytometric analysis of IFN-γ production by pancreatic lymph nodes of nondiabetic control OT-II RIP-mOva Rag1-deficient, diabetic Tgfbr2−/− OT-II RIP-mOva Rag1-deficient, and diabetic Foxp3sf OT-II RIP-mOva Rag1-deficient mice. Numbers indicate the percentage of cells in the respective gates. (D) The graph shows the percentage of IFN-γ–producing T cells in the pancreatic lymph nodes of nondiabetic control OT-II RIP-mOva Rag1-deficient, diabetic Tgfbr2−/− OT-II RIP-mOva Rag1-deficient, and diabetic Foxp3sf OT-II RIP-mOva Rag1-deficient mice. Circles represent individual mice. Error bars indicate mean ± SEM. Statistical significance was calculated using a two-tailed unpaired Student’s t test. **P ≤ 0.01.
Fig. 4.
Fig. 4.
Acute diabetes triggered by TβRII-deficient t cells is associated with an enhanced Th1 effector phenotype and the accumulation of pancreas-infiltrating inflammatory monocytes. (A) The graph shows the percentage of pancreas-infiltrating T cells in nondiabetic control OT-II RIP-mOva Rag1-deficient, diabetic Tgfbr2−/− OT-II RIP-mOva Rag1-deficient, and diabetic Foxp3sf OT-II RIP-mOva Rag1-deficient mice. Circles represent individual mice. Error bars indicate mean ± SEM. Statistical significance was calculated using a two-tailed unpaired Student’s t test. ***P ≤ 0.001; ns, not significant. (B) Flow cytometric analysis of IFN-γ production by pancreas-infiltrating T cells in diabetic Tgfbr2−/− OT-II RIP-mOva Rag1-deficient and Foxp3sf OT-II RIP-mOva Rag1-deficient mice. Numbers indicate the percentage of cells in the respective gates. (C) The graph shows the percentage of IFN-γ–producing T cells in the pancreas of diabetic Tgfbr2−/− OT-II RIP-mOva Rag1-deficient and Foxp3sf OT-II RIP-mOva Rag1-deficient mice. Circles represent individual mice. Error bars indicate mean ± SEM. Statistical significance was calculated using a two-tailed unpaired Student’s t test. *P < 0.05. (D) Flow cytometric analysis of Ly6C expression by pancreas-infiltrating T cells from diabetic Tgfbr2−/− OT-II RIP-mOva Rag1-deficient and Foxp3sf OT-II RIP-mOva Rag1-deficient mice. (E) The graph shows the percentage of Ly6C-expressing T cells in the pancreas of diabetic Tgfbr2−/− OT-II RIP-mOva Rag1-deficient and Foxp3sf OT-II RIP-mOva Rag1-deficient mice. Circles represent individual mice. Error bars indicate mean ± SEM. Statistical significance was calculated using a two-tailed unpaired Student’s t test. **P ≤ 0.01. (F) Flow cytometric analysis of Ly6C and Ly6G expression among CD45+CD11b+ cells in the pancreas of nondiabetic control OT-II RIP-mOva Rag1-deficient, diabetic Tgfbr2−/− OT-II RIP-mOva Rag1-deficient, and diabetic Foxp3sf OT-II RIP-mOva Rag1-deficient mice. Numbers indicate the percentage of cells in the respective gates. (G) The graph shows the percentage of Ly6C+ monocytes among CD11b+ cells in the pancreas of nondiabetic control OT-II RIP-mOva Rag1-deficient, diabetic Tgfbr2−/− OT-II RIP-mOva Rag1-deficient, and diabetic Foxp3sf OT-II RIP-mOva Rag1-deficient mice. Circles represent individual mice. Error bars indicate mean ± SEM. Statistical significance was calculated using a two-tailed unpaired Student’s t test. *P < 0.05. (H) Immunofluorescent staining of T cells and macrophages in the pancreata of Tgfbr2−/− OT-II RIP-mOva, Tgfbr2+/+ OT-II RIP-mOva, and C57BL/6 mice.
Fig. S2.
Fig. S2.
T cell and monocyte infiltration in the transfer model of diabetes. (A) The graph shows the frequency of TCRβ+ cells among total CD45+ cells in the pancreas of RIP-mOva Rag1-deficient mice that received ER-Cre Tgfbr2fl/fl OT-II cells + tamoxifen treatment to induce Tgfbr2 deletion (Tgfbr2−/− OT-II) or Foxp3sf OT-II cells. Circles represent individual mice. Error bars indicate mean ± SEM. Statistical significance was calculated using a two-tailed unpaired Student’s t test. **P ≤ 0.01. (B) Flow cytometric analysis of Ly6C expression on pancreas-infiltrating Tgfbr2−/− (Left) or Foxp3sf (Right) OT-II cells. Numbers indicate the percentage of cells in the respective gates. (C) The graph shows the frequency of Ly6C-expressing cells among total TCRβ+ cells in the pancreas of RIP-mOva Rag1-deficient mice that received Tgfbr2−/− or Foxp3sf OT-II cells. Circles represent individual mice. Error bars indicate mean ± SEM. Statistical significance was calculated using a two-tailed unpaired Student’s t test. **P ≤ 0.01. (D and E) Only RIP-mOva Rag1-deficient mice that received ER-Cre Tgfbr2fl/fl OT-II T cells were diabetic. Control and Foxp3sf OT-II T cell-recipient mice were nondiabetic at analysis. (D) Flow cytometric analysis of Ly6C and Ly6G expression among CD45+CD11b+ cells in the pancreas of RIP-mOva Rag1-deficient mice that received control, ER-Cre Tgfbr2fl/fl, or Foxp3sf OT-II T cells. Numbers indicate the percentage of cells in the respective gates. (E) The graph shows the percentage of Ly6C+ monocytes among CD11b+ cells in the pancreas of RIP-mOva Rag1-deficient mice that received control, ER-Cre Tgfbr2fl/fl, or Foxp3sf OT-II T cells. Circles represent individual mice. Error bars indicate mean ± SEM. Statistical significance was calculated using a two-tailed unpaired Student’s t test. *P < 0.05.
Fig. 5.
Fig. 5.
Pathogenic role of inflammatory monocytes in diabetes triggered by TβRII-deficient T cells. (A) Flow cytometric analysis of Ly6C+CCR2+ cells in the spleens of untreated and DT-treated Tgfbr2−/− CCR2DTR OT-II RIP-mOva Rag1-deficient mice. Plots are gated on CD11b+ cells, and numbers indicate the percentage of cells in the respective gates. (B) The graph shows the incidence of diabetes with age in DT-treated Tgfbr2−/− OT-II RIP-mOva Rag1-deficient mice with (squares, n = 4) or without (circles, n = 4) the CCR2DTR transgene. (C) RIP-mOva Rag1-deficient mice with (squares, n = 3) or without (circle, n = 4) the CCR2DTR transgene were treated with DT following the adoptive transfer of ER-Cre Tgfbr2fl/fl OT-II T cells and subsequent tamoxifen treatment to induce Tgfbr2 deletion. The graph shows the incidence of diabetes versus time after T cell transfer. (DG) Control RIP-mOva and RIP-mOva CCR2DTRCFP Rag1-deficient mice received ER-Cre Tgfbr2fl/fl T cells and were treated with tamoxifen to induce deletion of the Tgfbr2 allele. Both sets of recipient mice were treated with DT to control for nonspecific effects of DT. For simplicity, DT-treated RIP-mOva Rag1-deficient mice (no depletion of CCR2-expressing cells) are referred to as “Ctrl,” and DT-treated RIP-mOva CCR2DTRCFP Rag1-deficient mice in which CCR2-expressing cells are depleted are designated as “DT-treated.” (D) Flow cytometric analysis of TCRβ+ and CD11b+ cells among total CD45+ cells in the pancreas of DT-treated control RIP-mOva (Ctrl) and RIP-mOva CCR2DTR (+DT) Rag1-deficient mice that received Tgfbr2−/− OT-II cells. Numbers indicate the percentage of cells in the respective gates. (E) The graph shows the frequency of TCRβ+ cells among CD45+ cells in the pancreas of DT-treated control RIP-mOva (Ctrl) and RIP-mOva CCR2DTR (+DT) Rag1-deficient mice that received Tgfbr2−/− OT-II cells. Circles represent individual mice. Error bars indicate mean ± SEM. Statistical significance was calculated using a two-tailed unpaired Student’s t test; ns, not significant. (F) Flow cytometric analysis of Ly6C and Ly6G expression among CD45+CD11b+ cells in the pancreas of DT-treated control RIP-mOva (Ctrl) and RIP-mOva CCR2DTR (+DT) Rag1-deficient mice that received Tgfbr2−/− OT-II cells. Numbers indicate the percentage of cells in the respective gates. (G) The graph shows the frequency of Ly6C+ cells among CD45+CD11b+ cells in the pancreas of DT-treated control RIP-mOva (Ctrl) and RIP-mOva CCR2DTR (DT-treated) Rag1-deficient mice that received Tgfbr2−/− OT-II cells. Circles represent individual mice. Error bars indicate mean ± SEM. Statistical significance was calculated using a two-tailed unpaired Student’s t test. **P ≤ 0.01.
Fig. 6.
Fig. 6.
Pancreas-infiltrating TβRII-deficient T cells produce increased amounts of GM-CSF, which promotes diabetes development. (A) Flow cytometric analysis of IFN-γ and GM-CSF expression by T cells in the pancreatic lymph nodes (Upper) and pancreas (Lower) of diabetic Tgfbr2−/− and Foxp3sf OT-II RIP-mOva Rag1-deficient mice. Numbers indicate the percentage of cells in the gates. (B) The graph shows the percentage of IFN-γ+GM-CSF+ T cells in the pancreatic lymph nodes (Left) and pancreas (Right) of diabetic Tgfbr2−/− and Foxp3sf OT-II RIP-mOva Rag1-deficient mice. Circles represent individual mice. Error bars indicate mean ± SEM. Statistical significance was calculated using a two-tailed unpaired Student’s t test. **P ≤ 0.01; ns, not significant. (C) The graph shows diabetes incidence versus age among Tgfbr2−/− OT-II RIP-mOva Rag1-deficient mice (circles, n = 16), Tgfbr2−/− Csf2r/− OT-II RIP-mOva Rag1-deficient mice (squares, n = 7), and control OT-II RIP-mOva Rag1-deficient mice (triangles, n = 8). (D) The graph shows the frequency of TCRβ+ cells among CD45+ cells in the pancreas of control (Tgfbr2+/+), Tgfbr2−/−, and Tgfbr2−/−Csf2r−/− OT-II RIP-mOva Rag1-deficient mice. (E) The graph shows the frequency of Ly6C-expressing cells among total TCRβ+ cells in the pancreas of control (Tgfbr2+/+), Tgfbr2−/−, and Tgfbr2−/−Csf2r−/− OT-II RIP-mOva Rag1-deficient mice. Circles represent individual mice. Error bars indicate mean ± SEM. Statistical significance was calculated using a two-tailed unpaired Student’s t test; ns, not significant. (F) The graph shows the percentage of Ly6C+ cells among CD45+CD11b+ cells in the pancreas of control (Tgfbr2+/+), Tgfbr2−/−, and Tgfbr2−/− Csf2r−/− OT-II RIP-mOva Rag1-deficient mice. Circles represent individual mice. Error bars indicate mean ± SEM. Statistical significance was calculated using a two-tailed unpaired Student’s t test. *P < 0.05.
Fig. S3.
Fig. S3.
GM-CSF expression is enhanced in TβRII-deficient T cells, but its signaling is nonessential for T cell infiltration or effector differentiation. RIP-mOva Rag1-deficient mice received ER-Cre Tgfbr2fl/fl OT-II cells + tamoxifen treatment to induce Tgfbr2 deletion (Tgfbr2−/− OT-II) or Foxp3sf OT-II cells. Mice that received Tgfbr2−/− OT-II, but not Foxp3sf OT-II, cells were diabetic at the time of analysis. (A) Flow cytometric analysis of IFN-γ and GM-CSF expression among pancreas-infiltrating T cells in RIP-mOva Rag1-deficient mice that received Tgfbr2−/− or Foxp3sf OT-II cells. Numbers indicate the percentage of cells in the respective gates. (B) The graph shows the frequency of IFN-γ+GM-CSF+ cells among TCRβ+ cells in the pancreas of RIP-mOva Rag1-deficient mice that received Tgfbr2−/− or Foxp3sf OT-II cells. Circles represent individual mice. Error bars indicate mean ± SEM. Statistical significance was calculated using a two-tailed unpaired Student’s t test. **P ≤ 0.01.

References

    1. Hogquist KA, Baldwin TA, Jameson SC. Central tolerance: Learning self-control in the thymus. Nat Rev Immunol. 2005;5:772–782. - PubMed
    1. Mueller DL. Mechanisms maintaining peripheral tolerance. Nat Immunol. 2010;11:21–27. - PubMed
    1. Shull MM, et al. Targeted disruption of the mouse transforming growth factor-beta 1 gene results in multifocal inflammatory disease. Nature. 1992;359:693–699. - PMC - PubMed
    1. Kulkarni AB, et al. Transforming growth factor beta 1 null mutation in mice causes excessive inflammatory response and early death. Proc Natl Acad Sci USA. 1993;90:770–774. - PMC - PubMed
    1. Gorelik L, Flavell RA. Abrogation of TGFbeta signaling in T cells leads to spontaneous T cell differentiation and autoimmune disease. Immunity. 2000;12:171–181. - PubMed

Publication types

MeSH terms

Substances

LinkOut - more resources