. 2017 Sep 5;114(36):E7622-E7631.
doi: 10.1073/pnas.1710848114. Epub 2017 Aug 21.

CD146 coordinates brain endothelial cell-pericyte communication for blood-brain barrier development

Affiliations

CD146 coordinates brain endothelial cell-pericyte communication for blood-brain barrier development

Jianan Chen et al. Proc Natl Acad Sci U S A. .

Abstract

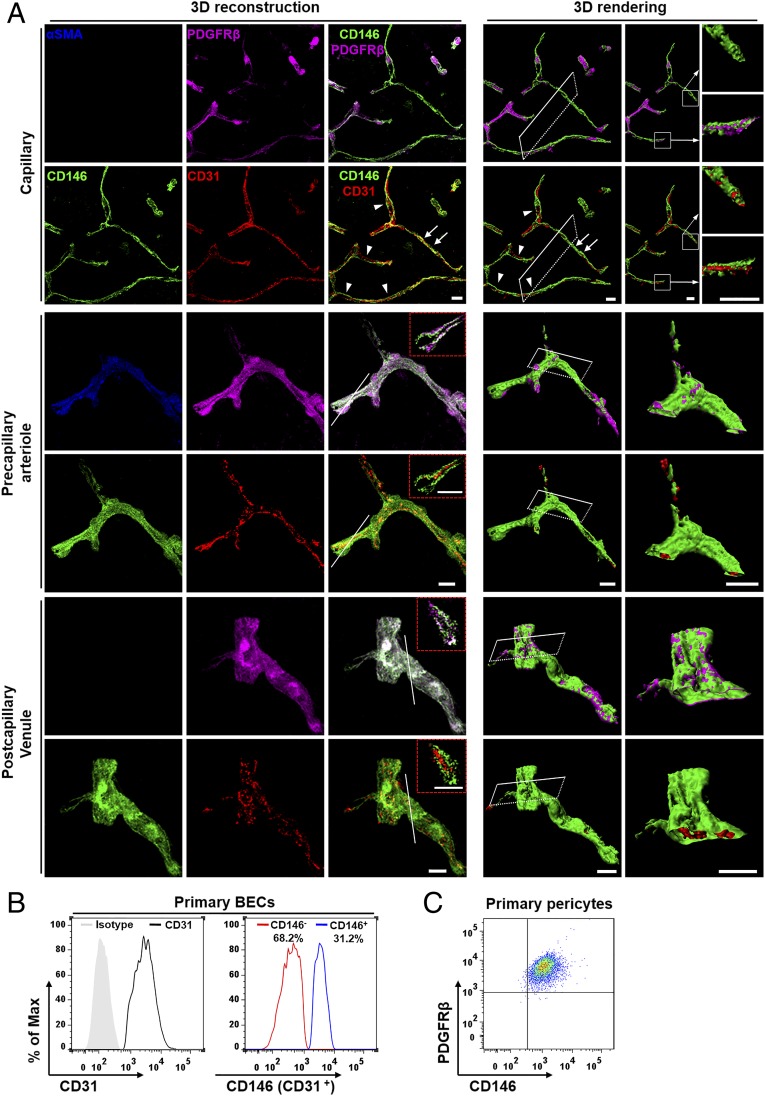
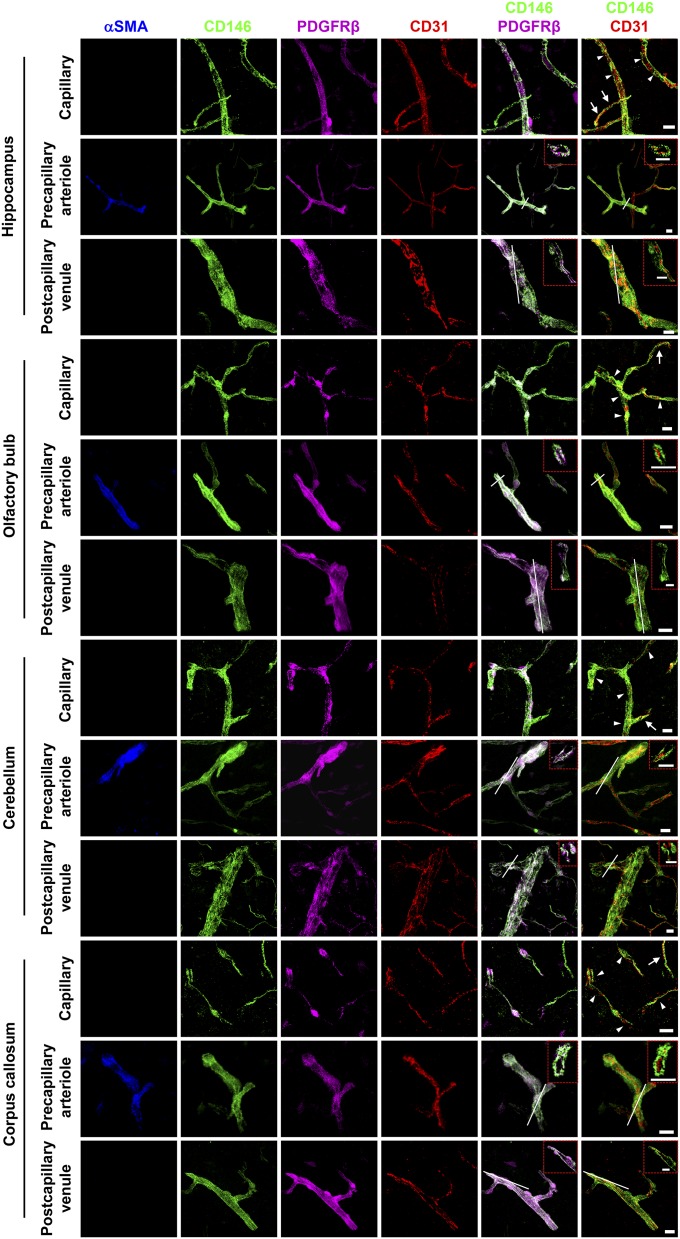
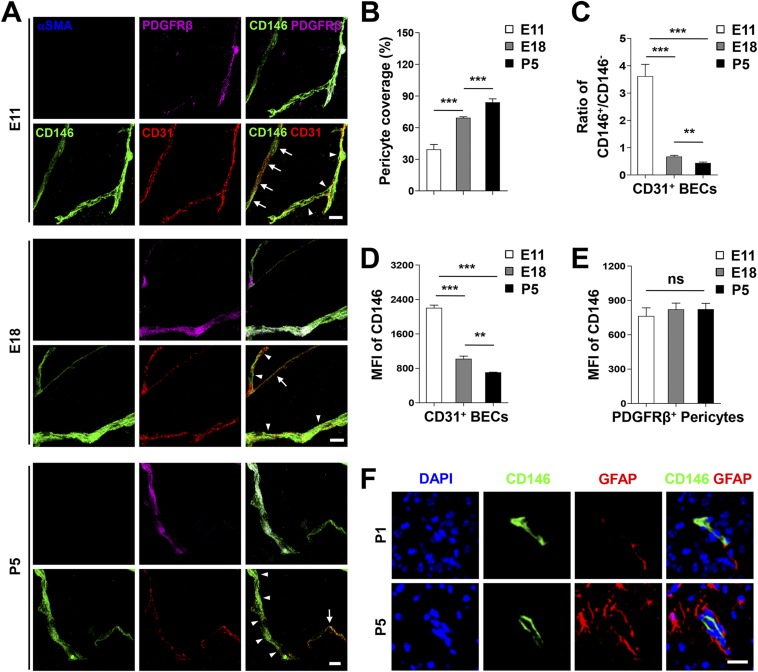
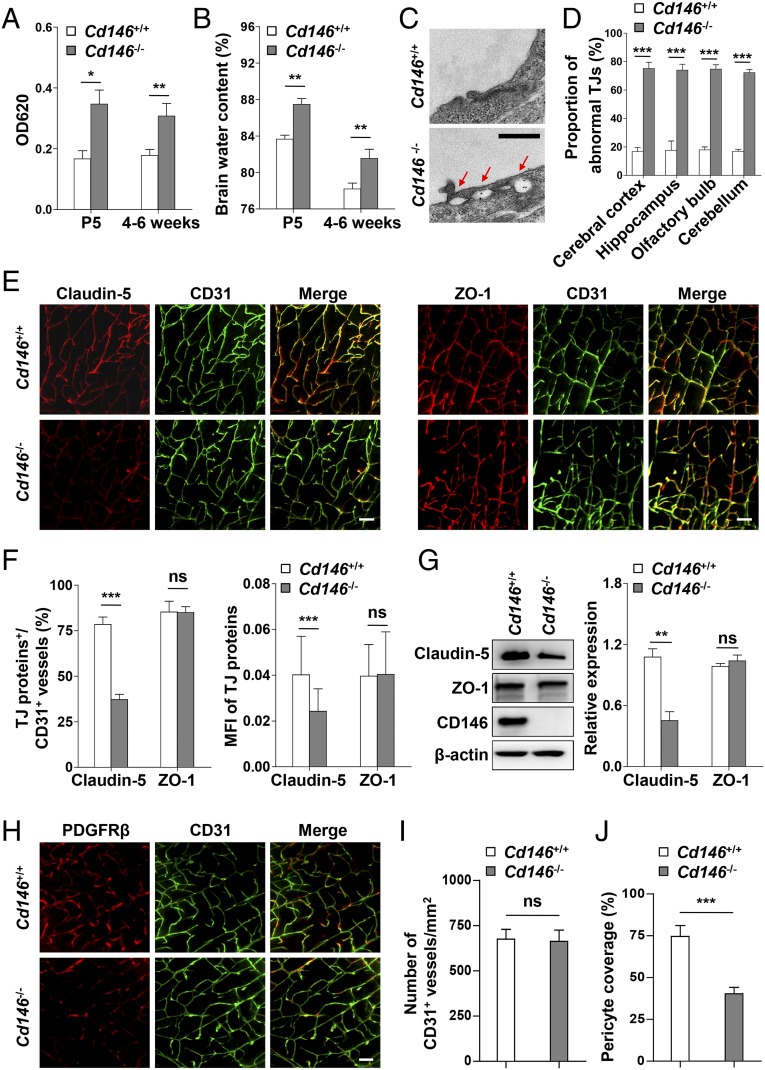
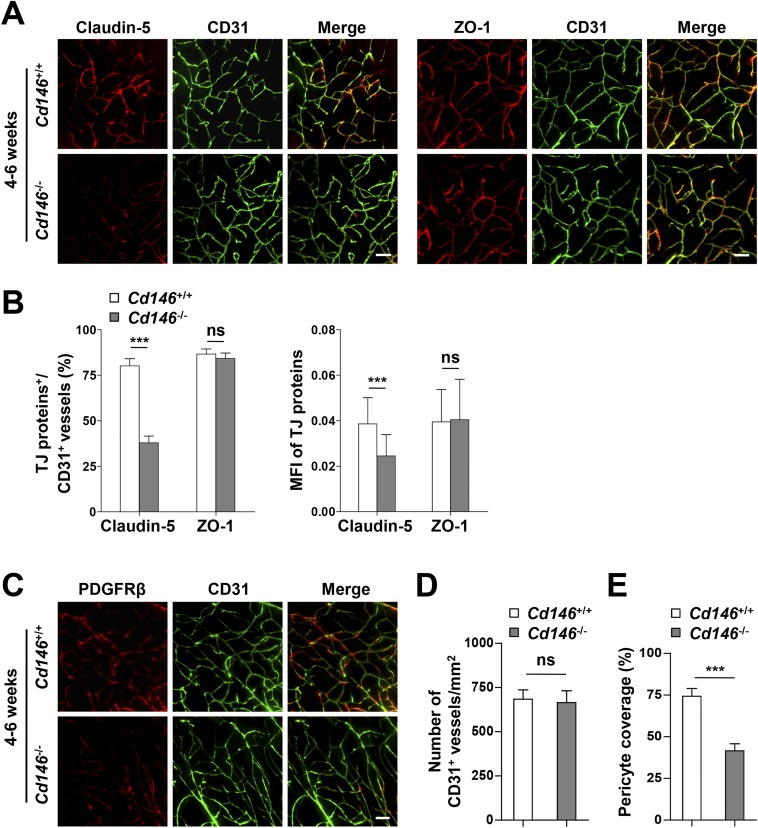
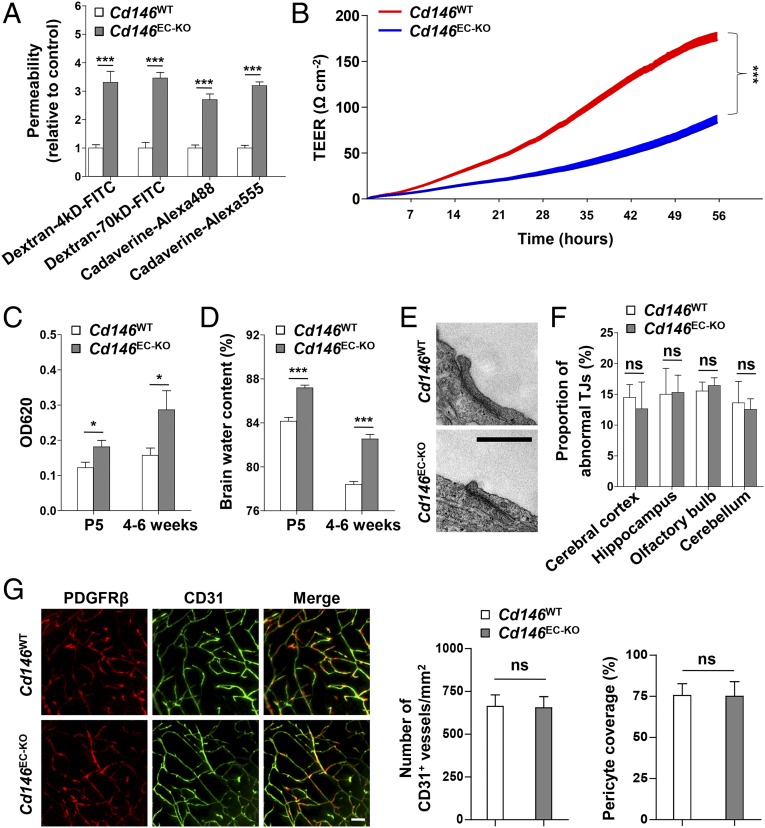
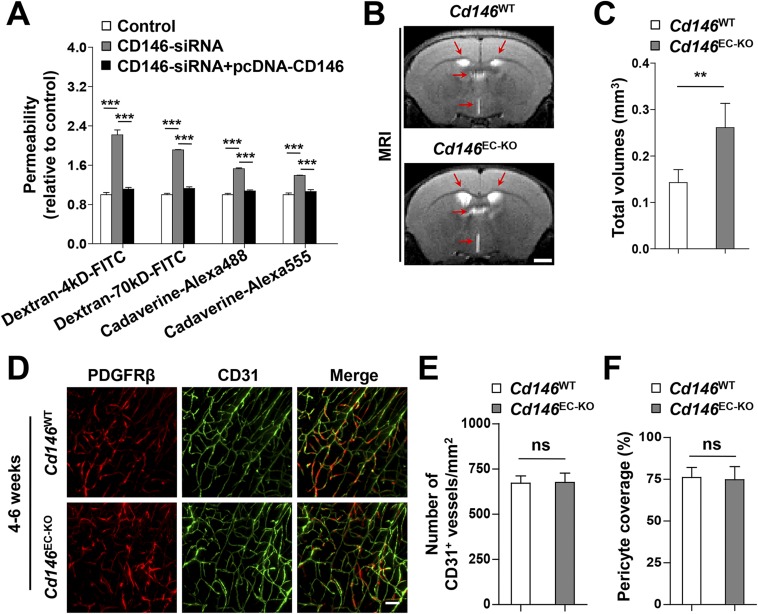
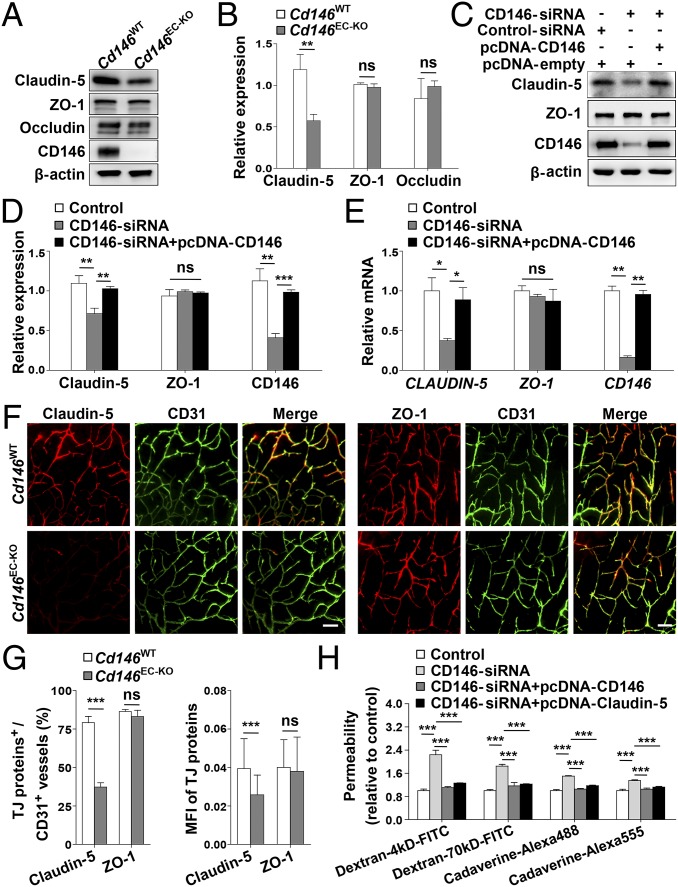
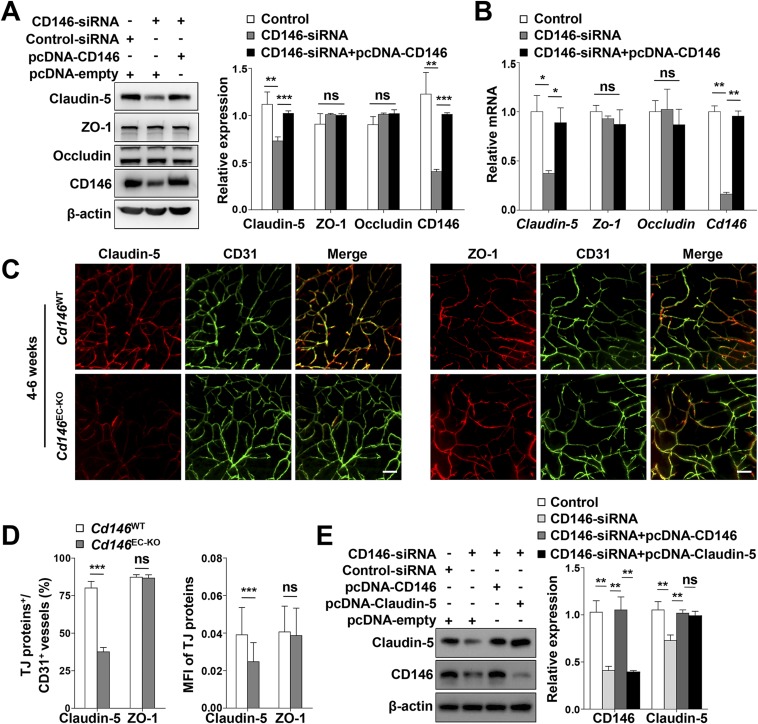
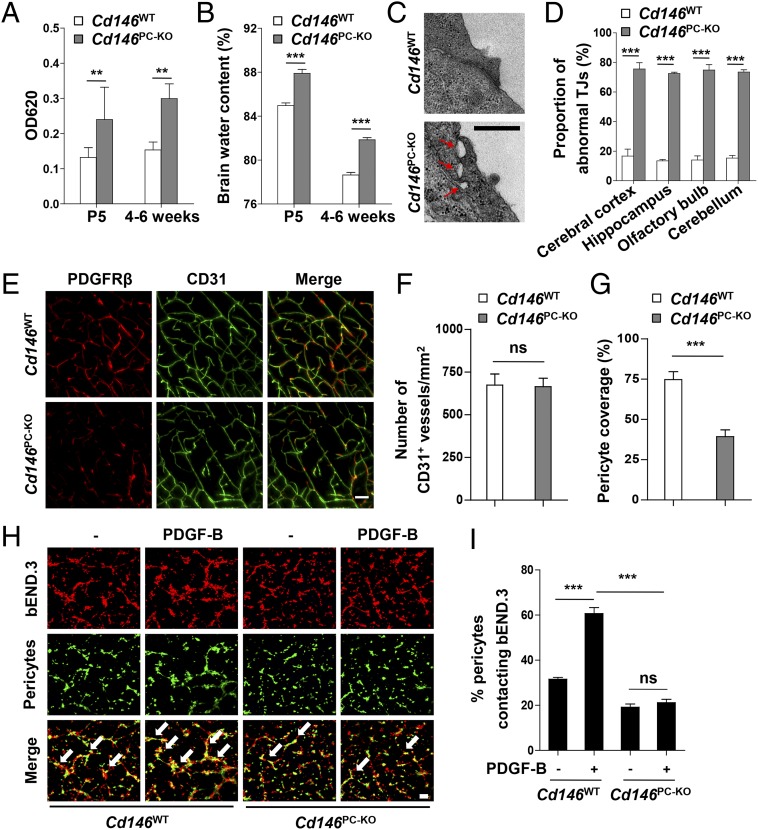
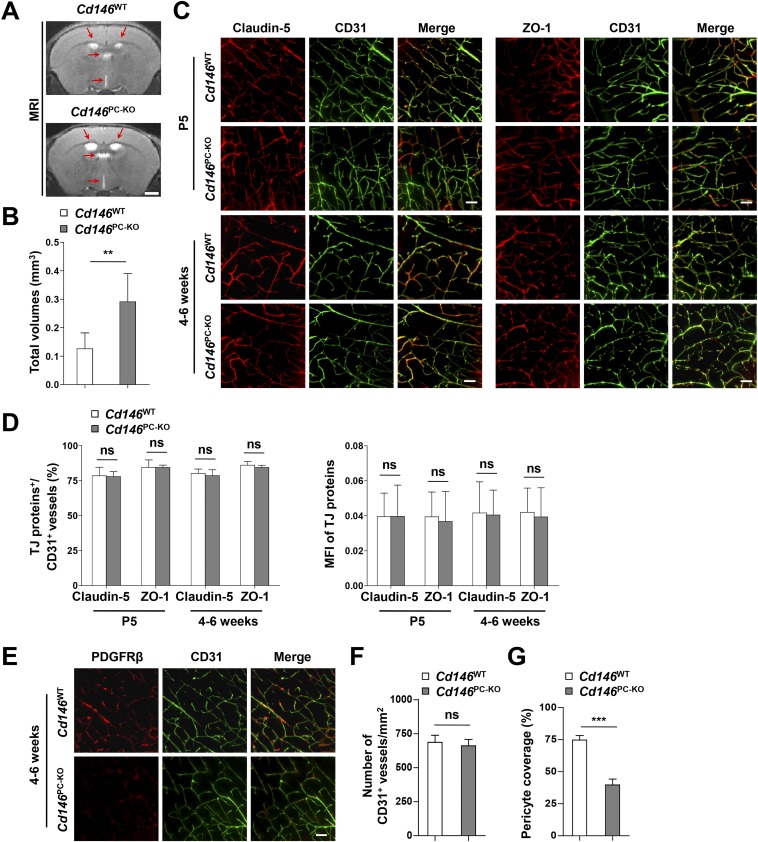
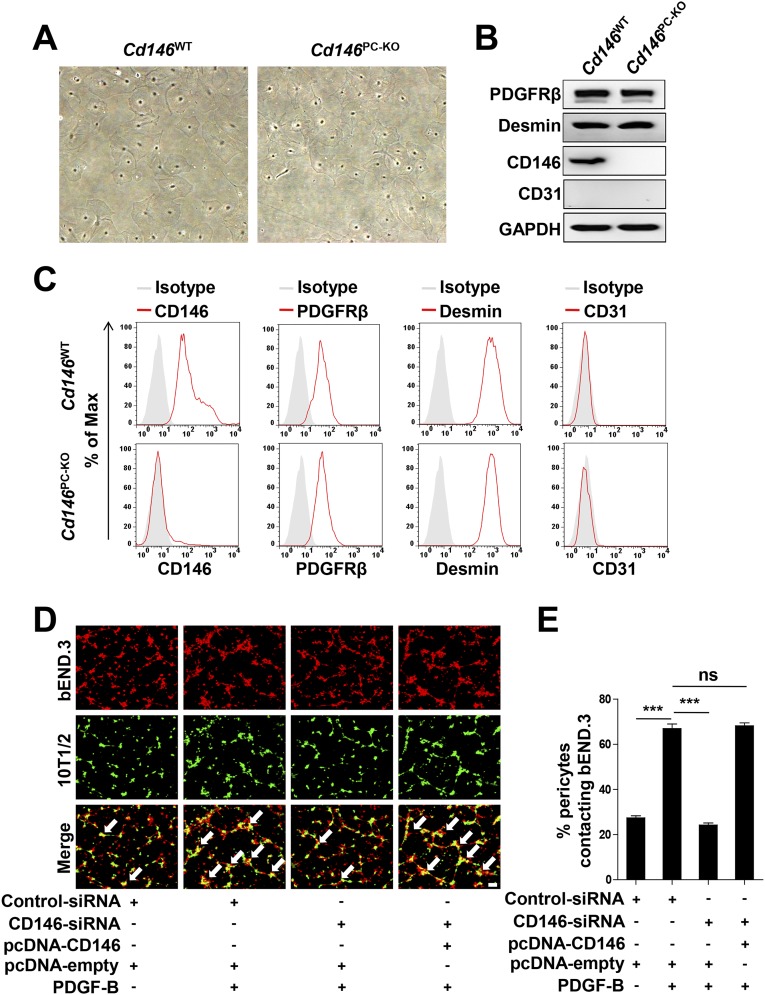
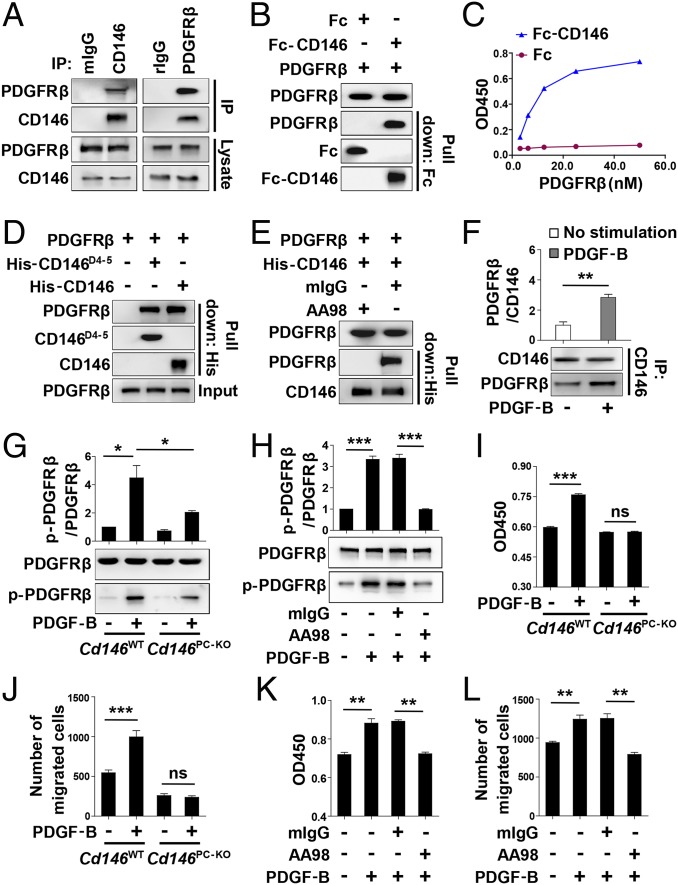
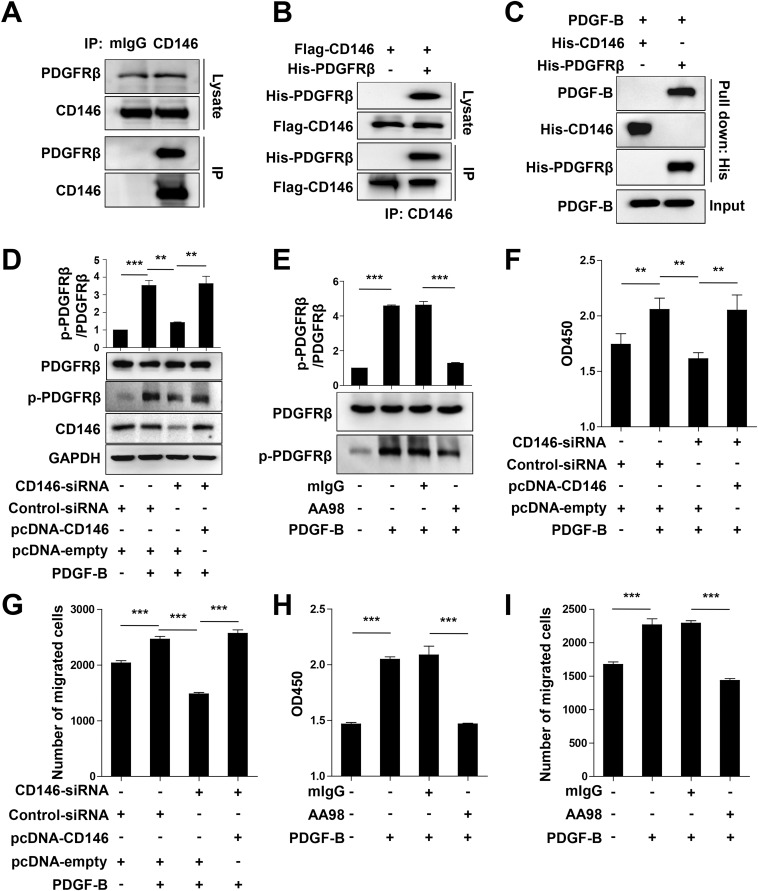
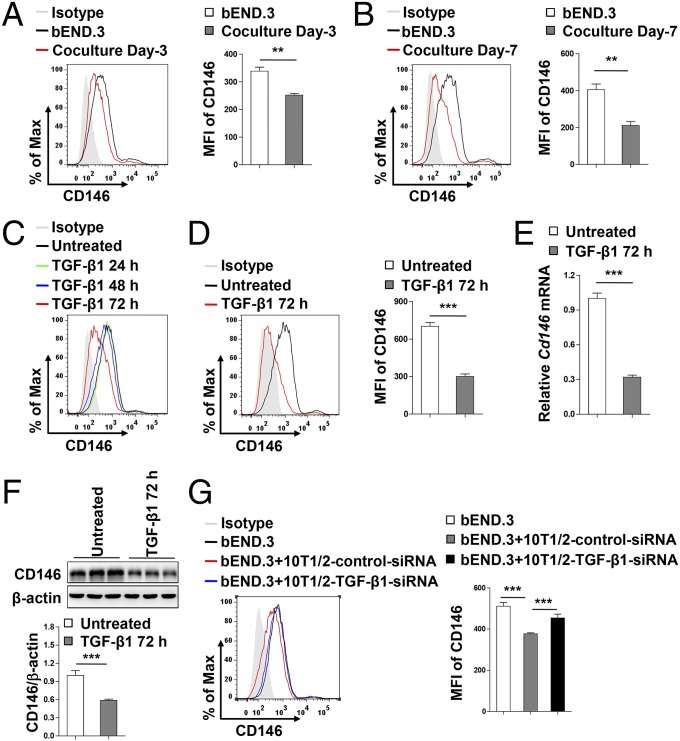
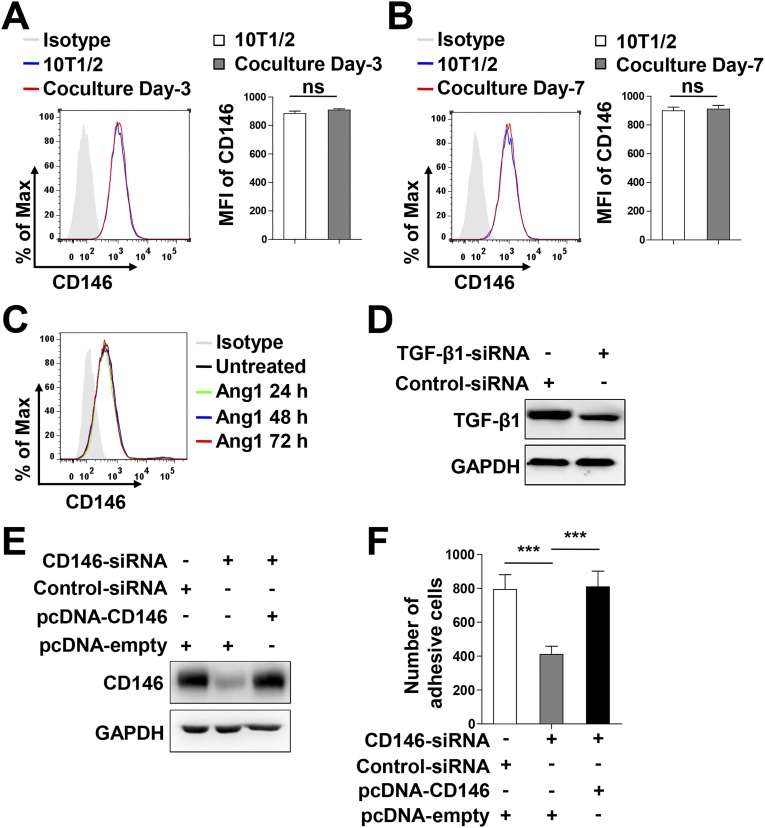
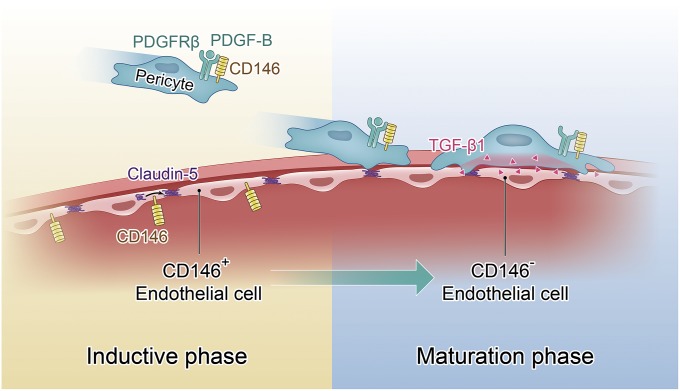
The blood-brain barrier (BBB) establishes a protective interface between the central neuronal system and peripheral blood circulation and is crucial for homeostasis of the CNS. BBB formation starts when the endothelial cells (ECs) invade the CNS and pericytes are recruited to the nascent vessels during embryogenesis. Despite the essential function of pericyte-EC interaction during BBB development, the molecular mechanisms coordinating the pericyte-EC behavior and communication remain incompletely understood. Here, we report a single cell receptor, CD146, that presents dynamic expression patterns in the cerebrovasculature at the stages of BBB induction and maturation, coordinates the interplay of ECs and pericytes, and orchestrates BBB development spatiotemporally. In mouse brain, CD146 is first expressed in the cerebrovascular ECs of immature capillaries without pericyte coverage; with increased coverage of pericytes, CD146 could only be detected in pericytes, but not in cerebrovascular ECs. Specific deletion of Cd146 in mice ECs resulted in reduced brain endothelial claudin-5 expression and BBB breakdown. By analyzing mice with specific deletion of Cd146 in pericytes, which have defects in pericyte coverage and BBB integrity, we demonstrate that CD146 functions as a coreceptor of PDGF receptor-β to mediate pericyte recruitment to cerebrovascular ECs. Moreover, we found that the attached pericytes in turn down-regulate endothelial CD146 by secreting TGF-β1 to promote further BBB maturation. These results reveal that the dynamic expression of CD146 controls the behavior of ECs and pericytes, thereby coordinating the formation of a mature and stable BBB.

Keywords: CD146; PDGFRβ; blood–brain barrier; claudin-5; spatiotemporal expression.


Conflict of interest statement

The authors declare no conflict of interest.

Figures

Fig. 1.
Fig. 1.
Expression of CD146 in BECs and pericytes is dynamic in mice. (A) Brain sections (40 μm thick) from the cortex of mice at 4–6 wk were stained for CD146 (green), CD31 (EC marker; red), PDGFRβ (pericyte marker; purple), and αSMA (artery marker; blue) to indicate CD146 expression in capillaries, precapillary arterioles, and postcapillary venules. Shown are 3D reconstructions of confocal image z-stacks of brain vessels and the 3D surface rendering of epifluorescence images. Cut-open images were then created from the 3D surface rendering of vessels to reveal the inner vessel wall. In capillaries, segments without pericyte coverage showed CD146 expression in the BECs (arrows). However, in the capillaries covered with pericytes (arrowheads), CD146 was expressed in pericytes but not in BECs. White squares indicate areas shown on the right of each panel. In brain precapillary arterioles and postcapillary venules, CD146 expression was exclusively observed in pericytes and not in BECs. The dashed red insets indicate a confocal z-slice located at the white line of each panel, confirming that the expression of CD146 was exclusively observed in pericytes and not in BECs of precapillary arterioles and postcapillary venules. (Scale bars: 10 μm.) At least 20 capillaries, 20 precapillary arterioles, and 20 postcapillary venules from the cortex were analyzed. (B) Flow-cytometry analysis of CD146 expression in murine BECs (stained with antibodies against CD146 and CD31) showed heterogeneity in CD146 expression. The ratio between CD146 and CD146+ BECs was approximately 2:1. (C) Flow-cytometry analysis of CD146 expression in murine brain pericytes (stained with antibodies against CD146 and PDGFRβ). Pericytes constitutively expressed CD146. Data are from one experiment representative of three independent experiments with five mice (A) or six to eight mice per group (B and C).
Fig. S1.
Fig. S1.
The expression of CD146 in brain vessels at 4–6 wk. Brain sections (40-μm thickness) from the hippocampus, olfactory bulb, cerebellum, and corpus callosum (white matter) of mice at 4–6 wk were stained for CD146 (green), CD31 (EC marker; red), PDGFRβ (pericyte marker; purple), and αSMA (artery marker; blue). Shown are 3D reconstructions of confocal image z-stacks of brain capillaries, precapillary arterioles, and postcapillary venules. The same expression pattern of CD146 was observed in different brain regions where CD146 was expressed in the BECs of immature capillaries without pericyte coverage (arrows) and was only expressed in pericytes of brain capillaries covered with pericytes (arrowheads), precapillary arterioles, and postcapillary venules. The dashed red rectangles indicate a confocal z-slice located at the white line of each panel, confirming that the expression of CD146 was exclusively observed in pericytes but not in BECs of precapillary arterioles and postcapillary venules. At least 20 capillaries, 20 precapillary arterioles, and 20 postcapillary venules from the hippocampus, olfactory bulb, cerebellum, and corpus callosum were analyzed. (Scale bars: 10 μm.) Data are from one experiment representative of three independent experiments with five mice.
Fig. S2.
Fig. S2.
Dynamic CD146 expression correlates with pericyte recruitment during BBB development. (A) Three-dimensional reconstructions of confocal-image z-stacks of brain capillaries stained for CD146 (green), PDGFRβ (pericyte marker; purple), CD31 (EC marker; red), and αSMA (artery marker; blue) in cortex from mice at E11, E18, and P5. The dynamic expression pattern of CD146 was observed at different BBB developmental stages. Arrows indicate capillaries without pericyte coverage; arrowheads indicate capillaries with pericyte coverage. (Scale bars: 10 μm.) (B) Quantification of pericyte coverage by analyzing percent length of CD31+ capillaries as opposed to PDGFRβ+ pericytes as shown in A. (C) Quantification of the ratio of CD146+/CD146 BECs from mice was analyzed by flow cytometry (stained with antibodies against CD146 and CD31). The percentage of CD146+ BECs decreased with BBB development. (D) MFI of CD146 in CD31+ murine BECs showed a significant decrease from E11 to P5. (E) MFI of CD146 in PDGFRβ+ murine brain pericytes was relatively stable during BBB development. (F) CD146 is not expressed in astrocytes in mice. Brain sections of mice at ages P1 and P5 were stained for CD146 (green) and GFAP (astrocyte marker; red). Nuclei were stained with DAPI (blue). (Scale bar: 20 μm.) Data are from one experiment representative of three independent experiments with five mice (A, B, and F) or six to eight mice per group (CE) (**P < 0.01 and ***P < 0.001).
Fig. 2.
Fig. 2.
Cd146 deficiency results in impaired BBB integrity in mice. (A) Cd146+/+ and Cd146−/− mice at P5 or 4–6 wk were given an i.p. injection or i.v. injection of Evans blue dye, respectively, and the absorption of Evans blue extracted from the mouse brain was measured by a microplate spectrophotometer at 620 nm. (B) Brain water content of Cd146+/+ and Cd146−/− mice (P5 or 4–6 wk). (C) EM images of TJs of brain capillaries in cortex from Cd146+/+ and Cd146−/− mice (P5). Red arrows indicate altered junctional strands. (Scale bar: 500 nm.) (D) Quantification of the abnormal endothelial TJ structure of brain capillaries in cerebral cortex, hippocampus, olfactory bulb, and cerebellum from Cd146+/+ and Cd146−/− mice (P5; at least 50 TJs were analyzed per group). (E) Brain sections from cortex of mice at P5 were costained for CD31 (green) and claudin-5 or ZO-1 (red) and analyzed by light-sheet fluorescence microscopy (LSFM) after being optically cleared by using organic solvents. Representative maximum-intensity projections (MIPs) of 40 virtual single slices from Cd146+/+ and Cd146−/− mice are shown. (Scale bars: 50 μm.) (F) Quantification of the number of CD31+ capillaries expressing claudin-5 or ZO-1 and the mean fluorescence intensity (MFI) of claudin-5 or ZO-1 in CD31+ capillaries demonstrate reduction of claudin-5 in capillaries from Cd146−/− mice compared with those from Cd146+/+ mice. (G) Western blot analysis of the expression of claudin-5 and ZO-1 in murine BECs purified from Cd146+/+ and Cd146−/− mice. (H) Brain sections from cortex of mice at P5 were costained for CD31 (green) and PDGFRβ (red) and analyzed by LSFM after being optically cleared by using organic solvents. Representative MIPs of 40 virtual single slices from Cd146+/+ and Cd146−/− mice are shown. (Scale bar: 50 μm.) (I) Quantification of the number of CD31+ capillaries in cortex from Cd146+/+ and Cd146−/− mice. No difference was detected. (J) Pericyte coverage was quantified by analyzing percent length of CD31+ capillaries opposed to PDGFRβ+ pericytes. The capillaries of cortex from Cd146−/− mice showed a decrease in pericyte coverage (*P < 0.05, **P < 0.01, and ***P < 0.001). Data are from one experiment representative of three independent experiments with eight mice per genotype (A, B, D and G) or five mice per genotype, at least eight MIPs per mouse, and five random fields per MIP (F, I and J).
Fig. S3.
Fig. S3.
Cd146 deficiency results in reduced claudin-5 expression and impaired pericyte recruitment. (A) Brain sections from cortex of mice at 4–6 wk were costained for CD31 (green) and claudin-5 (red) or ZO-1 (red) and analyzed by LSFM after being optically cleared by using organic solvents. Representative MIPs of 40 virtual single slices from Cd146+/+ and Cd146−/− mice are shown. (Scale bars: 50 μm.) (B) Quantification of the number of CD31+ capillaries expressing claudin-5 or ZO-1 and the MFI of claudin-5 or ZO-1 in CD31+ capillaries showed reduction of claudin-5 in capillaries of cortex from Cd146−/− mice compared with those from Cd146+/+ mice at P5 and 4–6 wk. (C) Brain sections from cortex of mice at 4–6 wk were costained for CD31 (green) and PDGFRβ (red) and analyzed by LSFM after being optically cleared by using organic solvents. Representative MIPs of 40 virtual single slices from Cd146+/+ and Cd146−/− mice are shown. (Scale bar: 50 μm.) (D) Quantification of the number of CD31+ capillaries of brain cortex from Cd146+/+ and Cd146−/− mice. No difference was detected. (E) Pericyte coverage was quantified by analyzing percent length of CD31+ capillaries as opposed to PDGFRβ+pericytes. The capillaries of brain cortex from Cd146−/− mice showed a decrease in pericyte coverage (***P < 0.001). Data are from one experiment representative of three independent experiments with five mice per genotype, at least eight MIPs per mouse, and five random fields per MIP (B, D, and E).
Fig. 3.
Fig. 3.
Endothelial Cd146 deletion leads to reduced claudin-5 expression and BBB breakdown without affecting TJ structures and pericyte coverage. (A) The paracellular permeability of the brain capillary ECs isolated from Cd146WT and Cd146EC-KO mice was assessed by tracers of different sizes, fluorescent dextrans (4 kDa and 70 kDa), and cadaverine (640 Da and 950 Da; n = 10 per group). (B) Measurements of paracellular tightness of the brain capillary ECs isolated from Cd146WT and Cd146EC-KO mice (n = 8 per group). The paracellular tightness was examined by measuring the TEER using an RTCA-SP instrument. (C) Cd146WT and Cd146EC-KO mice at P5 or 4–6 wk were given an i.p. injection or i.v. injection of Evans blue dye, respectively. The absorption of Evans blue was measured by microplate spectrophotometer at 620 nm. (D) Brain water content of Cd146WT and Cd146EC-KO mice (P5 or 4–6 wk). (E) EM images of the endothelial TJs of brain capillaries in cortex from Cd146WT and Cd146EC-KO mice (P5). (Scale bar: 500 nm.) (F) Quantification of the abnormal TJ structure of brain capillaries in cerebral cortex, hippocampus, olfactory bulb, and cerebellum from Cd146WT and Cd146EC-KO mice (P5; at least 50 TJs were analyzed per group). (G) Brain sections from cortex of mice at P5 were costained for CD31 (green) and PDGFRβ (red) and analyzed by LSFM after being optically cleared by using organic solvents. Representative MIPs of 40 virtual single slices from Cd146WT and Cd146EC-KO mice are shown. The number of CD31+ capillaries and pericyte coverage in Cd146WT and Cd146EC-KO mice was quantified. No difference was detected (*P < 0.05 and ***P < 0.001). (Scale bar: 50 μm.) Data are from one experiment representative of three independent experiments with eight mice per genotype (C, D, and F) or five mice per genotype, at least eight MIPs per mouse, and five random fields per MIP (G).
Fig. S4.
Fig. S4.
Deletion of endothelial Cd146 leads to BBB breakdown and enlargement of brain ventricles. (A) hCMEC/D3 cells were transfected with CD146 siRNA or cotransfected with CD146 siRNA and CD146-expressing plasmid. The paracellular permeability was assessed by using fluorescent tracers of different sizes of dextrans (4 kDa and 70 kDa) and cadaverine (640 Da and 950 Da; n = 10 per group). (B) Representative images at the same brain level were chosen from the volumes aligned to the Waxholm space. T2-weighted coronal MRI scans showing enlargement of the ventricles (red arrows) in Cd146EC-KO mice compared with that in Cd146WT mice at 4–6 wk. (Scale bar: 1,000 μm.) (C) Quantification of the total volumes of ventricles, including left lateral ventricle, right lateral ventricle, third ventricle, and fourth ventricle in Cd146EC-KO mice and Cd146WT mice at 4–6 wk. (D) Brain sections from cortex of mice at 4–6 wk were costained for CD31 (green) and PDGFRβ (red) and analyzed by LSFM after being optically cleared by using organic solvents. Representative MIPs of 40 virtual single slices from Cd146WT and Cd146EC-KO mice are shown. (Scale bar: 50 μm.) (E) Quantification of the number of CD31+ capillaries of brain cortex from Cd146WT and Cd146EC-KO mice. No difference was detected. (F) Pericyte coverage was quantified by analyzing percent length of CD31+ capillaries opposed to PDGFRβ+ pericytes. No difference was detected (**P < 0.01 and ***P < 0.001). Data are from one experiment representative of three independent experiments with eight mice per genotype (C) or five mice per genotype, at least eight MIPs per mouse, and five random fields per MIP (E and F).
Fig. 4.
Fig. 4.
CD146 in BECs up-regulates the expression of claudin-5. (A) Western blot analysis of the expression of claudin-5, ZO-1, and occludin in murine BECs purified from Cd146WT and Cd146EC-KO mice. (B) Quantification of the expression level of claudin-5, ZO-1, and occludin in murine BECs purified from Cd146WT and Cd146EC-KO mice. (C–E) hCMEC/D3 cells were transfected with CD146 siRNA or cotransfected with CD146 siRNA and CD146-expressing plasmids. The expression of claudin-5 and ZO-1 was analyzed by Western blotting (C and D) or real-time PCR (E). (F) Brain sections from cortex of mice at P5 were costained for CD31 (green) and claudin-5 or ZO-1 (red) and analyzed by LSFM after being optically cleared by using organic solvents. Representative MIPs of 40 virtual single slices from Cd146WT and Cd146EC-KO mice are shown. (Scale bars: 50 μm.) (G) Quantification of the number of CD31+ capillaries expressing claudin-5 or ZO-1 and the MFI of claudin-5 or ZO-1 in CD31+ capillaries in cortex showed a reduction of claudin-5 in Cd146EC-KO mice compared with Cd146WT mice. (H) hCMEC/D3 cells were transfected with CD146 siRNA or cotransfected with CD146 siRNA and CD146-expressing plasmid or with CD146 siRNA and claudin-5–expressing plasmid, respectively. The paracellular permeability was assessed by tracers of different sizes of fluorescent dextrans (4 kDa and 70 kDa) and cadaverine (640 Da and 950 Da; n = 10 per group; *P < 0.05, **P < 0.01, and ***P < 0.001). Data are from one experiment representative of three independent experiments with eight mice per genotype (B) or five mice per genotype, at least eight MIPs per mouse, and five random fields per MIP (G).
Fig. S5.
Fig. S5.
Down-regulation or deletion of endothelial Cd146 results in reduced claudin-5 expression. (A and B) bEND.3 cells were transfected with CD146 siRNA or cotransfected with CD146 siRNA and CD146-expressing plasmid. The expression of claudin-5, ZO-1, and occludin was analyzed by Western blotting (A) or real-time PCR (B). (C) Brain sections from cortex of mice at 4–6 wk were costained for CD31 (green) and claudin-5 (red) or ZO-1 (red) and analyzed by LSFM after being optically cleared by using organic solvents. Representative MIPs of 40 virtual single slices from Cd146WT and Cd146EC-KO mice are shown. (Scale bars: 50 μm.) (D) Quantification of the number of CD31+ capillaries expressing claudin-5 or ZO-1 and the MFI of claudin-5 or ZO-1 in CD31+ capillaries showed reduction of claudin-5 in capillaries of brain cortex from Cd146EC-KO mice compared with those from Cd146WT mice. (E) hCMEC/D3 cells were transfected with CD146 siRNA, cotransfected with CD146 siRNA and CD146-expressing plasmid, or cotransfected with CD146 siRNA and claudin-5–expressing plasmid. The expression of claudin-5 and CD146 was analyzed by Western blotting (*P < 0.05, **P < 0.01, and ***P < 0.001). Data are from one experiment representative of three independent experiments with five mice per genotype, at least eight MIPs per mouse, and five random fields per MIP (D).
Fig. 5.
Fig. 5.
Pericyte Cd146 deletion results in impaired pericyte recruitment and BBB breakdown. (A) Cd146WT and Cd146PC-KO mice at P5 or 4–6 wk were given an i.p. injection or i.v. injection of Evans blue dye, respectively, and the absorption of Evans blue extracted from the mouse brain was measured by a microplate spectrophotometer at 620 nm. (B) Brain water content of Cd146WT and Cd146PC-KO mice (P5 or 4–6 wk). (C) EM images of TJs of brain capillaries in the cortex from Cd146WT and Cd146PC-KO mice (P5). Red arrows indicate altered TJ alignment. (Scale bar: 500 nm.) (D) Quantification of the abnormal TJ structure of brain capillaries in cerebral cortex, hippocampus, olfactory bulb, and cerebellum from Cd146WT and Cd146PC-KO mice (P5; at least 50 TJs were analyzed per group). (E) Brain sections from the cortex of mice at P5 were costained for CD31 (green) and PDGFRβ (red) and analyzed by LSFM after being optically cleared by using organic solvents. Representative MIPs of 40 virtual single slices from Cd146WT and Cd146PC-KO mice are shown. (Scale bar: 50 μm.) (F) Quantification of the number of CD31+ capillaries in cortex from Cd146WT and Cd146PC-KO mice. No difference was detected. (G) Pericyte coverage was quantified by analyzing percent length of CD31+ capillaries opposed to PDGFRβ+ pericytes. Decreased pericyte coverage in capillaries was observed in the cortex of Cd146PC-KO mice. (H) bEND.3 cells and brain microvessel pericytes isolated from Cd146WT and Cd146PC-KO mice were labeled by PKH26-red and CFSE, respectively, and were cocultured in Matrigel-coated culture slides for 6 h. White arrows indicate pericytes contacting bEND.3 cells. (Scale bar: 100 μm.) (I) Quantification was performed by measuring the merged cells from 15 fields of 3 independent experiments (**P < 0.01 and ***P < 0.001). Data are from one experiment representative of three independent experiments with eight mice per genotype (A–D) or five mice per genotype, at least eight MIPs per mouse, and five random fields per MIP (F and G).
Fig. S6.
Fig. S6.
Generation and characterization of pericyte-specific Cd146-KO mice. (A) Targeting strategy for generation of Cd146floxed/floxed mice; shown are the WT locus of mouse Cd146 gene (Top) and the targeting construct (Bottom). A LoxP site (3′loxp) was cloned upstream of the promoter, and the frt-Neo-frt-loxp cassette was cloned downstream of exon 1. (B) Targeting strategy for generation of Pdgfrbcre/+ mice. (C) Mating scheme to generate pericyte-specific Cd146-KO mice (Pdgfrbcre/+Cd146flox/flox, i.e., Cd146PC-KO) and control WT littermates (Pdgfrb+/+Cd146flox/flox, i.e., Cd146WT). (D) Genotyping of Cd146PC-KO and Cd146WT mice by PCR analysis of genomic DNA. A 595-bp fragment from WT Cre gene, a 550-bp fragment from WT Cd146 gene (WT Cd146), and a 502-bp fragment from floxed Cd146 gene (Mut Cd146) were PCR-amplified with specific primers. Genomic DNA from Pdgfrbcre/+ mice was used as positive control (P.C.) for Cre analysis; genomic DNA from Cd146floxed/floxed mice were used as positive control for Mut Cd146 analysis; genomic DNA from C57BL/6 mice were used as positive control for WT Cd146 analysis. H2O was used as negative control (N.C.) for all three PCR analyses. Data represent three independent experiments.
Fig. S7.
Fig. S7.
Pericyte Cd146 deletion results in the enlargement of brain ventricles and impaired pericyte recruitment. (A) The representative images at the same brain level were chosen from the volumes aligned to the Waxholm space. T2-weighted coronal MRI scans showing enlargement of the ventricles (red arrows) in Cd146PC-KO mice compared with that in Cd146WT mice at 4–6 wk. (Scale bar: 1,000 μm.) (B) Quantification of the total volumes of ventricles, including left lateral ventricle, right lateral ventricle, third ventricle, and fourth ventricle in Cd146PC-KO mice and Cd146WT mice at 4–6 wk. (C) Brain sections from cortex of mice at 4–6 wk were costained for CD31 (green) and claudin-5 (red) or ZO-1(red) and analyzed by LSFM after being optically cleared by using organic solvents. Representative MIPs of 40 virtual single slices from Cd146WT and Cd146PC-KO mice are shown. (Scale bars: 50 μm.) (D) Quantification of the number of CD31+ capillaries expressing claudin-5 or ZO-1 and the MFI of claudin-5 or ZO-1 in CD31+ capillaries. No difference was detected. (E) Brain sections from cortex of mice at age 4–6 wk were costained for CD31 (green) and PDGFRβ (red) and analyzed by LSFM after being optically cleared by using organic solvents. Representative MIPs of 40 virtual single slices from Cd146WT and Cd146PC-KO mice are shown. (Scale bar: 50 μm.) (F) Quantification of the number of CD31+ capillaries in brain cortex from Cd146WT and Cd146PC-KO mice. No difference was detected. (G) Pericyte coverage was quantified by analyzing percent length of CD31+ capillaries as opposed to PDGFRβ+ pericytes. The capillaries of brain cortex from Cd146PC-KO mice showed a decrease in pericyte coverage (**P < 0.01 and ***P < 0.001). Data are from one experiment representative of three independent experiments with eight mice per genotype (B) or five mice per genotype, at least eight MIPs per mouse, and five random fields per MIP (D, F, and G).
Fig. S8.
Fig. S8.
Pericyte Cd146 deletion impairs pericyte recruitment. (A) Morphology of primary murine CNS pericytes isolated from Cd146WT and Cd146PC-KO mice. (B and C) Characterization of primary murine CNS pericytes isolated from Cd146WT and Cd146PC-KO mice by Western blotting (B) or flow-cytometry analysis (C) using specific antibodies as indicated. (D) bEND.3 cells and 10T1/2 cells were labeled by PKH26-red and CFSE, respectively, and were cocultured in Matrigel-coated culture slides for 6 h. White arrows indicate pericytes contacting bEND.3 cells. (Scale bar: 100 μm.) (E) Quantification was performed by measuring the merged cells from 15 fields of three independent experiments (***P < 0.001). Data represent three independent experiments.
Fig. 6.
Fig. 6.
CD146 activates PDGFRβ and promotes pericyte proliferation and migration. (A) Coimmunoprecipitation of endogenous CD146 and PDGFRβ in 10T1/2 cells. (B) Direct interaction between CD146 and PDGFRβ detected by Fc pull-down assay. (C) Fc or Fc-CD146 was added to wells coated with different concentrations of PDGFRβ, and ELISA was performed. (D) PDGFRβ directly binds CD146D4-5. PDGFRβ was first incubated with His-tagged CD146-ECD or CD146D4-5, respectively. The complex was pulled down by anti-His antibody. (E) Anti-CD146 AA98 abrogates CD146 and PDGFRβ interaction. His-CD146-ECD was incubated with PDGFRβ in the presence of mIgG or AA98 (50 μg/mL). (F) PDGF-B stimulation enhances the interaction of CD146 and PDGFRβ. Pericytes were stimulated without or with PDGF-B (20 ng/mL). (G) Cd146 deletion leads to impaired PDGFRβ activation. CNS pericytes isolated from Cd146WT and Cd146PC-KO mice were incubated with PDGF-B (20 ng/mL). The level of p-PDGFRβ was detected by Western blotting. (H) AA98 impairs PDGF-B–induced PDGFRβ activation in CNS pericytes isolated from Cd146WT mice. (I and J) The proliferation and migration of CNS pericytes isolated from Cd146WT and Cd146PC-KO mice in the presence of PDGF-B (20 ng/mL) were determined by CCK-8 assay (I) and transwell Boyden chamber assay (J). (K and L) Proliferation and migration of CNS pericytes from Cd146WT mice during PDGF-B (20 ng/mL) stimulation without or with anti-CD146 AA98 (50 μg/mL) were determined by CCK-8 assay (K) and transwell Boyden chamber assay (L). Data represent three independent experiments (*P < 0.05, **P < 0.01, and ***P < 0.001).
Fig. S9.
Fig. S9.
Targeting CD146 results in impaired PDGFRβ activation and cell proliferation and migration in 10T1/2 cells. (A) Coimmunoprecipitation (IP) assay of endogenous CD146 and PDGFRβ in human smooth muscle cells. CD146 from cell lysates was immunoprecipitated with anti-CD146 AA1. (B) HEK293 cells were transfected with Flag-CD146 and His-PDGFRβ. Cell lysates were immunoprecipitated with anti-CD146 AA1. (C) PDGF-B was incubated with His-PDGFRβ or His-CD146, and then anti-His antibody was used to precipitate the complex. (D) 10T1/2 cells were transfected with CD146-siRNA or cotransfected with CD146-siRNA and CD146-expressing plasmid, and then stimulated with PDGF-B (20 ng/mL). PDGFRβ activation was detected by Western blotting. Quantification of the relative p-PDGFRβ/PDGFRβ index is shown. (E) 10T1/2 cells were stimulated with PDGF-B (20 ng/mL) in the presence of mIgG or AA98 (50 μg/mL). PDGFRβ activation was detected by Western blotting. Quantification of the relative p-PDGFRβ/PDGFRβ index is shown. (F and G) 10T1/2 cells were treated as described in D. Cell proliferation and migration were detected by using a CCK-8 assay (F) and transwell Boyden chamber assay (G), respectively. (H and I) 10T1/2 cells were treated as described in E. The cell proliferation and migration were detected by CCK-8 assay (H) and transwell Boyden chamber assay (I), respectively (**P < 0.01 and ***P < 0.001). Data represent three independent experiments.
Fig. 7.
Fig. 7.
Pericytes down-regulate endothelial CD146 expression through TGF-β1. (A and B) Flow-cytometry analysis of CD146 expression in bEND.3 cells cocultured without or with pericytes for 3 d (A) or 7 d (B). (C) Flow-cytometry analysis of CD146 expression in bEND.3 cells stimulated without or with TGF-β1 (10 ng/mL) for 24 h, 48 h, and 72 h. (D–F) bEND.3 cells were stimulated without or with TGF-β1 (10 ng/mL) for 72 h. Expression of CD146 in bEND.3 was determined by flow cytometry (D), real-time PCR (E), or Western blotting (F). (G) 10T1/2 cells transfected with control siRNA or TGF-β1 siRNA were cocultured with bEND.3 cells. The expression of CD146 in bEND.3 was determined by flow cytometry. (Right) Quantification of the MFI of CD146 (**P < 0.01 and ***P < 0.001). Data represent three independent experiments.
Fig. S10.
Fig. S10.
Pericytes down-regulate endothelial CD146 expression through TGF-β1 signal, but not Ang1. (A and B) Flow-cytometry analysis of CD146 expression in 10T1/2 cell coculture without or with bEND.3 cells for 3 d (A) or 7 d (B). (C) Flow-cytometry analysis of CD146 expression in bEND.3 cells stimulated without or with Ang1 (10 ng/mL) for 24 h, 48 h, and 72 h. (D) TGF-β1 expression in 10T1/2 cells transfected with control siRNA or TGF-β1 siRNA was detected by Western blotting. (E) hCMEC/D3 cells were transfected with CD146 siRNA or cotransfected with CD146 siRNA and CD146-expressing plasmid. CD146 expression levels were measured by using Western blotting. (F) hCMEC/D3 cells were transfected as described in E. Adhesion of human leukocytes to hCMEC/D3 cell monolayer was detected by flow cytometry analysis (***P < 0.001). Data represent three independent experiments.
Fig. 8.
Fig. 8.
Dynamic coordination of BEC–pericyte communication by CD146 controls BBB formation during embryogenesis. At the initial stage of BBB development, CD146 expression in the cerebrovascular ECs promotes barrier induction by up-regulating claudin-5. Subsequently, pericyte-expressed CD146 functions as a coreceptor of PDGFRβ to recruit pericytes to BECs. Following the pericyte recruitment and attachment, endothelial CD146 is finally down-regulated by pericyte-derived TGF-β1, contributing to further BBB maturation.

References

    1. Zhao Z, Nelson AR, Betsholtz C, Zlokovic BV. Establishment and Dysfunction of the blood-brain barrier. Cell. 2015;163:1064–1078. - PMC - PubMed
    1. Greene C, Campbell M. Tight junction modulation of the blood brain barrier: CNS delivery of small molecules. Tissue Barriers. 2016;4:e1138017. - PMC - PubMed
    1. Abdelilah-Seyfried S. Claudin-5a in developing zebrafish brain barriers: Another brick in the wall. BioEssays. 2010;32:768–776. - PubMed
    1. Haseloff RF, Dithmer S, Winkler L, Wolburg H, Blasig IE. Transmembrane proteins of the tight junctions at the blood-brain barrier: Structural and functional aspects. Semin Cell Dev Biol. 2015;38:16–25. - PubMed
    1. Paul D, Cowan AE, Ge S, Pachter JS. Novel 3D analysis of Claudin-5 reveals significant endothelial heterogeneity among CNS microvessels. Microvasc Res. 2013;86:1–10. - PMC - PubMed

Publication types

MeSH terms

Substances