. 2017 Oct;70(4):813-821.
doi: 10.1161/HYPERTENSIONAHA.117.09456. Epub 2017 Aug 21.

Inhibition of Mammalian Target of Rapamycin Complex 1 Attenuates Salt-Induced Hypertension and Kidney Injury in Dahl Salt-Sensitive Rats

Affiliations

Inhibition of Mammalian Target of Rapamycin Complex 1 Attenuates Salt-Induced Hypertension and Kidney Injury in Dahl Salt-Sensitive Rats

Vikash Kumar et al. Hypertension. 2017 Oct.

Abstract

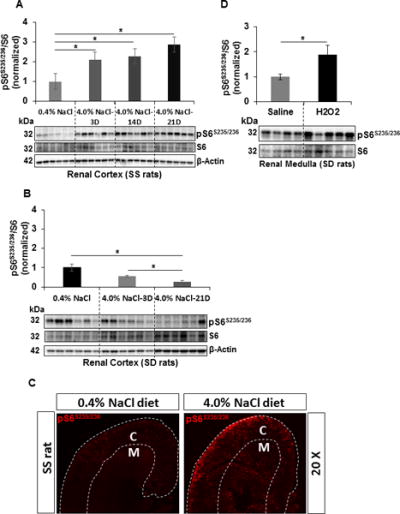
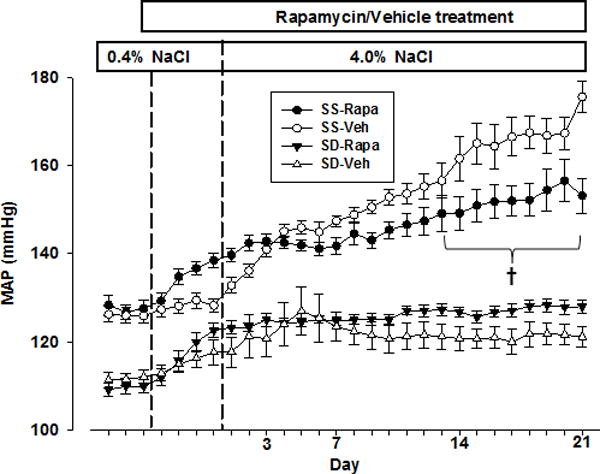
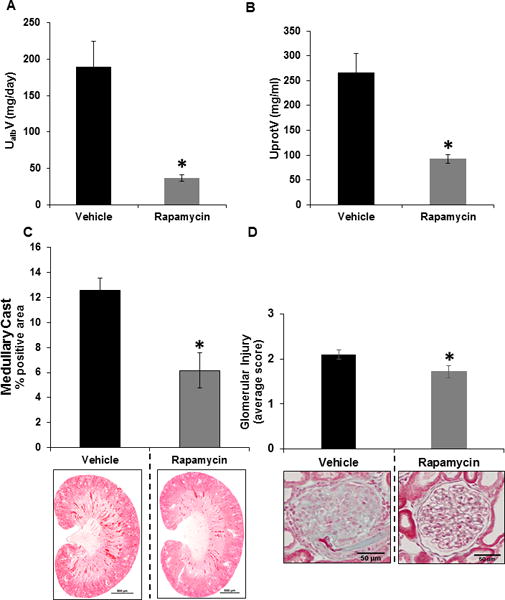
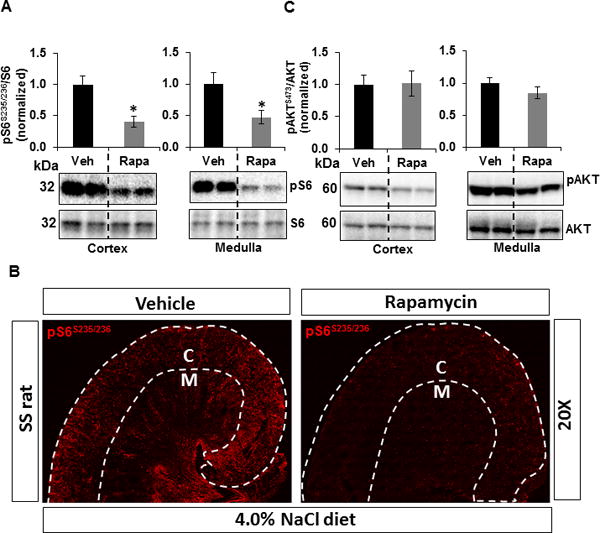
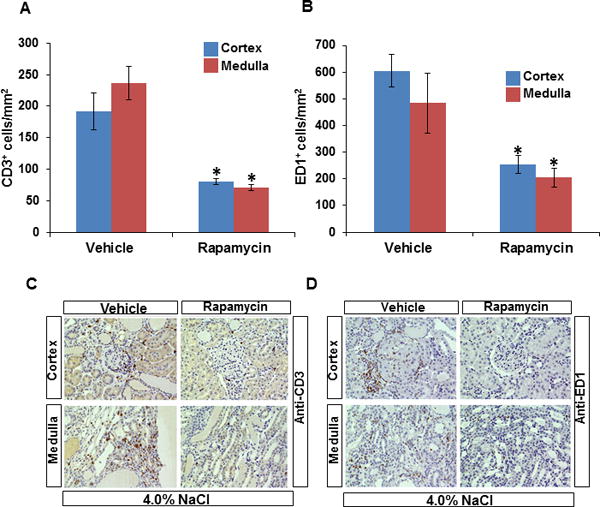
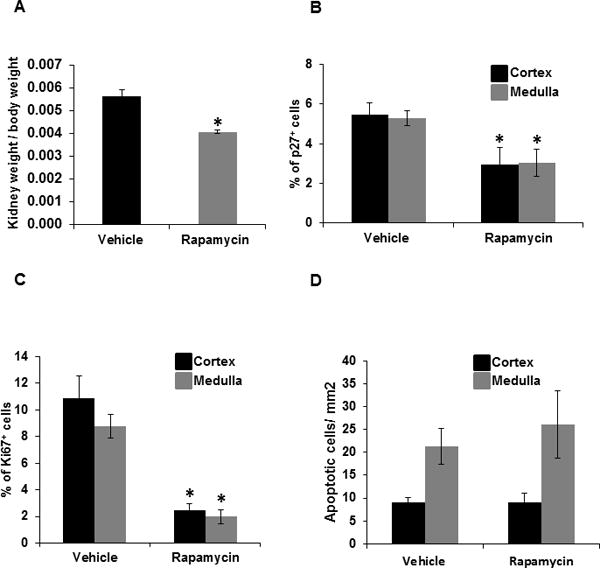
The goal of the present study was to explore the protective effects of mTORC1 (mammalian target of rapamycin complex 1) inhibition by rapamycin on salt-induced hypertension and kidney injury in Dahl salt-sensitive (SS) rats. We have previously demonstrated that H2O2 is elevated in the kidneys of SS rats. The present study showed a significant upregulation of renal mTORC1 activity in the SS rats fed a 4.0% NaCl for 3 days. In addition, renal interstitial infusion of H2O2 into salt-resistant Sprague Dawley rats for 3 days was also found to stimulate mTORC1 activity independent of a rise of arterial blood pressure. Together, these data indicate that the salt-induced increases of renal H2O2 in SS rats activated the mTORC1 pathway. Daily administration of rapamycin (IP, 1.5 mg/kg per day) for 21 days reduced salt-induced hypertension from 176.0±9.0 to 153.0±12.0 mm Hg in SS rats but had no effect on blood pressure salt sensitivity in Sprague Dawley treated rats. Compared with vehicle, rapamycin reduced albumin excretion rate in SS rats from 190.0±35.0 to 37.0±5.0 mg/d and reduced the renal infiltration of T lymphocytes (CD3+) and macrophages (ED1+) in the cortex and medulla. Renal hypertrophy and cell proliferation were also reduced in rapamycin-treated SS rats. We conclude that enhancement of intrarenal H2O2 with a 4.0% NaCl diet stimulates the mTORC1 pathway that is necessary for the full development of the salt-induced hypertension and kidney injury in the SS rat.

Keywords: arterial pressure; blood pressure; hypertension; rats, Sprague-Dawley.


Figures

Figure 1
Figure 1
A&B, Western blot analysis of pS6S235/236 and S6 protein level in the renal cortex tissue homogenates prepared from SS and SD rats fed on a 0.4% NaCl diet (n=6) or 4.0% NaCl diet (n=6) for 3, 14 and 21 days. Densitometry was used to determine the mTORC1 activity by measuring the ratio of pS6S235/236 and S6. Values represent pS6S235/236/S6 normalized to the 0.4% NaCl fed SS or SD rats. C, Representative photomicrograph of the immunohistochemical profile of pS6 level in the renal cortex and medulla of SS rats fed a 0.4% NaCl or 4.0% NaCl diet. White discontinuous lines designate the boundaries of the cortex (C) and medulla (M) D, pS6S235/236/S6 was measured in the outer medulla of SD rats with renal interstitial infusion of H2O2 for 3 days. Values represent pS6S235/236/S6 normalized to the saline-treated SD rats. Saline (n=4) and H2O2 (n=5). * p<0.05
Figure 2
Figure 2
Mean arterial pressure (MAP) was measured with rats fed a 0.4% NaCl diet for 7 days the final 4 days of which rats were treated with rapamycin or vehicle prior to switching to 4.0% NaCl diet for 21 days. Close circles represent rapamycin (n=9) and open circles represent vehicle (n=7) treated SS rats. Close triangles represent rapamycin (n=6) and open triangles represent vehicle (n=6) treated SD rats. Significant difference between vehicle and rapamycin treated SS rats (p<0.05) as determined using a two-way analysis of variance (ANOVA) for repeated measures; Holm-Sidak post hoc.
Figure 3
Figure 3
A&B, Albumin and protein were measured in urine samples collected for 24 hours on the last day of the 4.0 % NaCl for the determination of urinary excretion rates. Albumin (UalbV) and protein excretion (UprotV) rates were measured in SS rats treated with vehicle (n=7) or rapamycin (n=9). C, Summary of the outer medullary tubular injury (percentage of tubular cast positive region) and below graph shown here are the representative sections of trichrome-stained kidney from vehicle (n=7) or rapamycin (n=9) treated rats. D, Quantification of glomeruli injury in the cortex of vehicle (n=6) or rapamycin (n=6) treated SS rats. * p<0.05 Vs vehicle.
Figure 4
Figure 4
Western blots of pS6S235/236 and pAKTS473 were normalized with total endogenous S6 and AKT proteins, respectively. Graphs represent pS6S235/236/S6 or pAKTS473/AKT normalized to the vehicle treated SS rats. Corresponding representative immunoblots are shown below each graph. A, The level of pS6S235/236/S6 and B, Representative photomicrograph of the immunohistochemical profile of pS6S235/236 level in the renal cortex and medulla of SS rats treated with vehicle (n=7) or rapamycin (n=9) fed a 4.0% NaCl diet. White discontinuous lines designate the boundaries of the cortex (C) and medulla (M) C, pAKTS473/AKT in the cortex and outer medulla was measured in these rats kidney. * p<0.05 Vs vehicle.
Figure 5
Figure 5
Quantification of T lymphocytes (CD3+) and macrophages (ED1+) cells per mm2 of kidneys of SS rats treated with vehicle (n=7) or rapamycin (n=9) after 21 days of the 4.0% NaCl diet. A, CD3+ cells/mm2 in the renal cortex and outer medulla B, ED1+ cells/mm2 in the renal cortex and outer medulla C, representative kidney sections illustrating the immunohistochemical localization of T cells and macrophage cells (D) in the renal cortex and outer medulla. Blue and brown column on bar graph represent cortex and outer medulla, respectively. * p<0.05 Vs vehicle.
Figure 6
Figure 6
A, hypertrophic index was determined by measuring the ratio of right kidney weight (gm) and total body weight (gm) of the SS rats treated with vehicle (n=7) or rapamycin (n=9) maintained on the 4.0% NaCl diet. B, graph represents the percentage of p27+ cells (hypertrophy), C, percentage of Ki67+ cells (cell proliferation) D, quantification of apoptotic cells/mm2 (TUNEL assay) in the renal cortex and outer medulla of SS rats treated with vehicle (n=6) or rapamycin (n=6) maintained on the 4.0% NaCl diet. Blue and brown column on bar graph represent cortex and outer medulla, respectively. * p<0.05 Vs vehicle.

References

    1. Sommers SC, Relman AS, Smithwick RH. Histologic studies of kidney biopsy specimens from patients with hypertension. Am J Pathol. 1958;34:685–715. - PMC - PubMed
    1. Ebringer A, Doyle AE. Raised serum IgG levels in hypertension. Br Med J. 1970;2:146–148. - PMC - PubMed
    1. Hashmat S, Rudemiller N, Lund H, Abais-Battad JM, Van Why S, Mattson DL. Interleukin-6 inhibition attenuates hypertension and associated renal damage in Dahl salt-sensitive rats. Am J Physiol Renal Physiol. 2016;311:F555–561. - PMC - PubMed
    1. De Miguel C, Guo C, Lund H, Feng D, Mattson DL. Infiltrating T lymphocytes in the kidney increase oxidative stress and participate in the development of hypertension and renal disease. Am J Physiol Renal Physiol. 2011;300:F734–742. - PMC - PubMed
    1. Mattson DL. Infiltrating immune cells in the kidney in salt-sensitive hypertension and renal injury. Am J Physiol Renal Physiol. 2014;307:F499–508. - PMC - PubMed

MeSH terms