Multicenter Study
. 2017 Aug 21;8(1):291.
doi: 10.1038/s41467-017-00249-5.

Multi-laboratory assessment of reproducibility, qualitative and quantitative performance of SWATH-mass spectrometry

Affiliations
Multicenter Study

Multi-laboratory assessment of reproducibility, qualitative and quantitative performance of SWATH-mass spectrometry

Ben C Collins et al. Nat Commun. .

Abstract

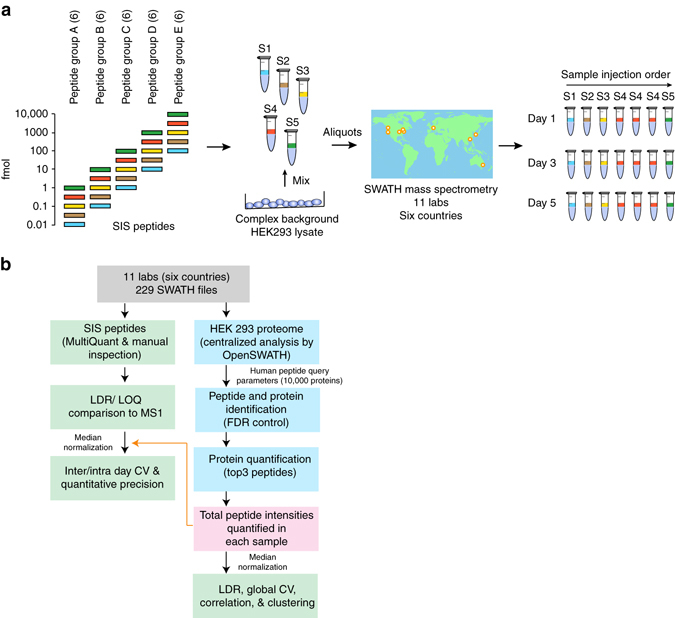
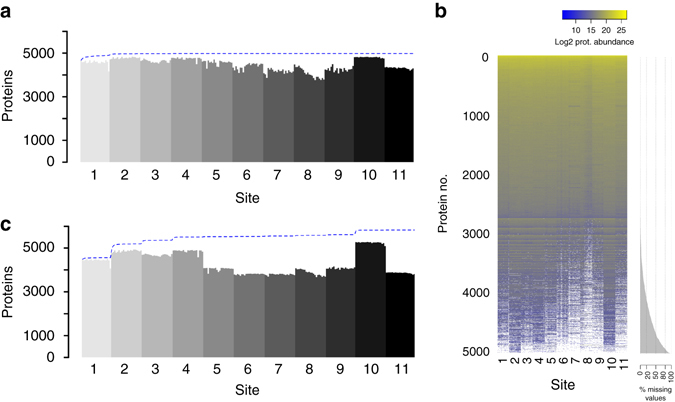
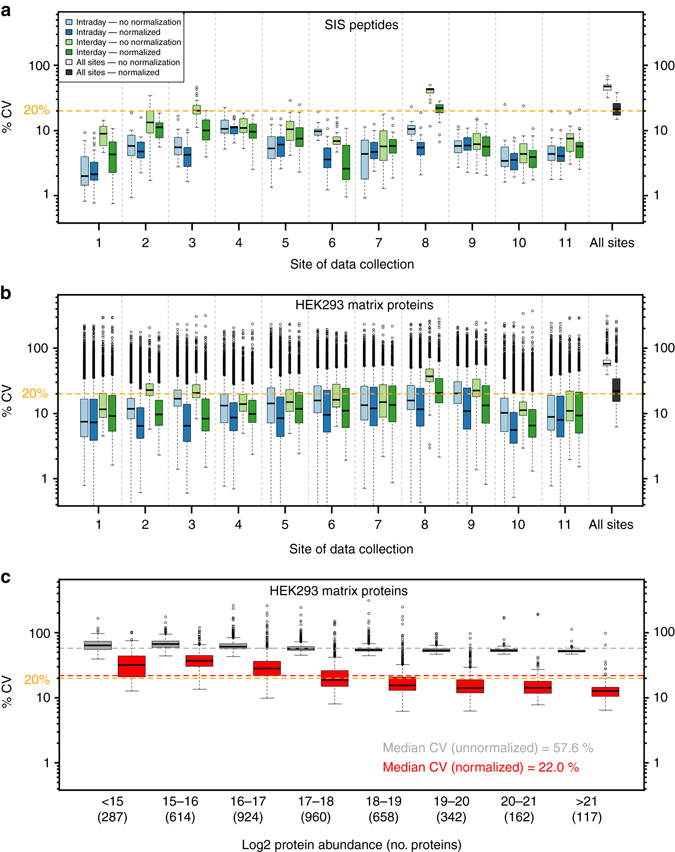
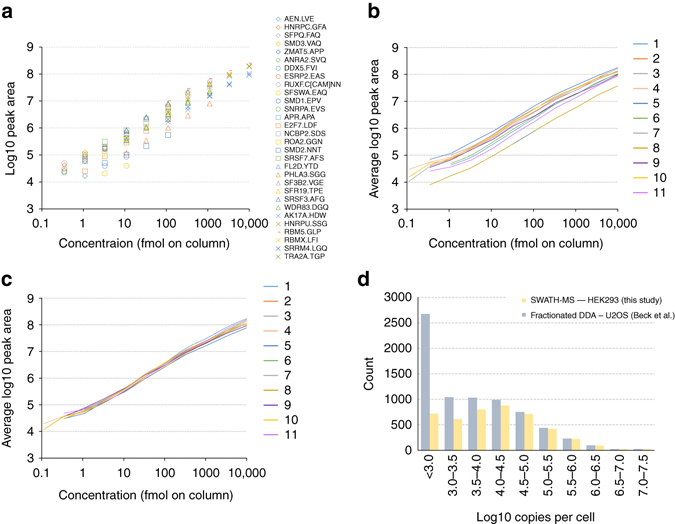
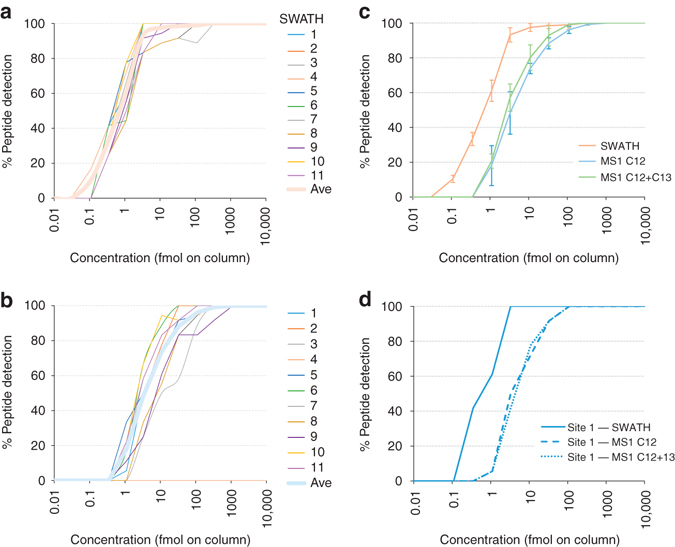
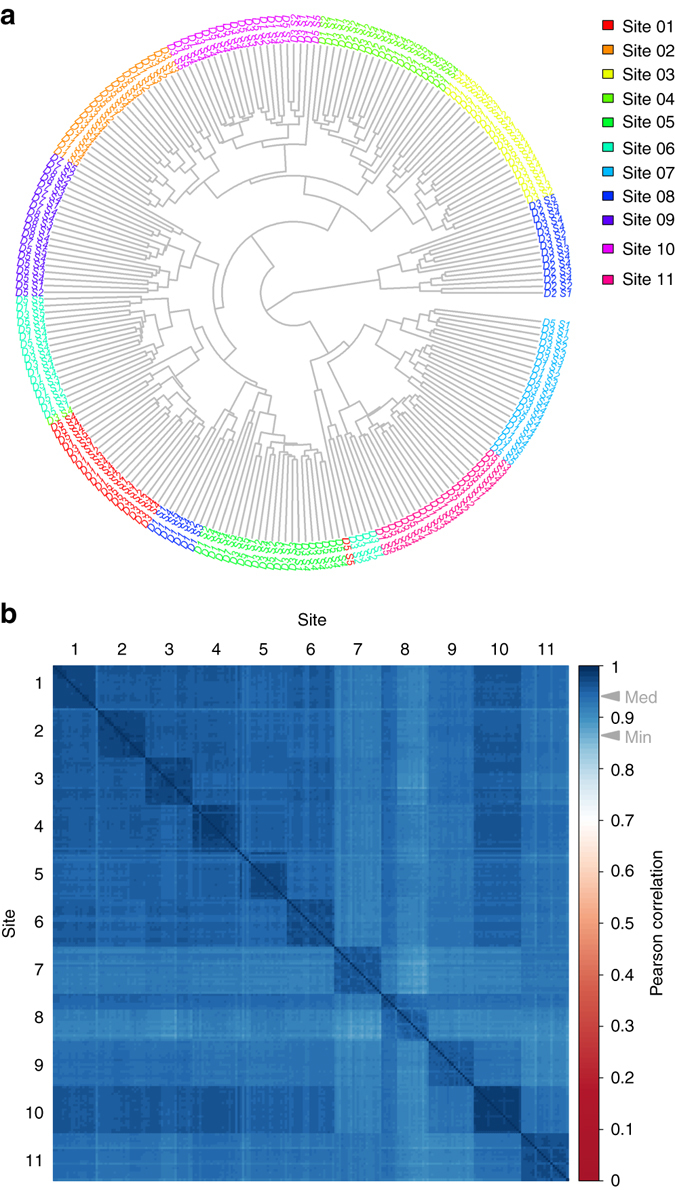
Quantitative proteomics employing mass spectrometry is an indispensable tool in life science research. Targeted proteomics has emerged as a powerful approach for reproducible quantification but is limited in the number of proteins quantified. SWATH-mass spectrometry consists of data-independent acquisition and a targeted data analysis strategy that aims to maintain the favorable quantitative characteristics (accuracy, sensitivity, and selectivity) of targeted proteomics at large scale. While previous SWATH-mass spectrometry studies have shown high intra-lab reproducibility, this has not been evaluated between labs. In this multi-laboratory evaluation study including 11 sites worldwide, we demonstrate that using SWATH-mass spectrometry data acquisition we can consistently detect and reproducibly quantify >4000 proteins from HEK293 cells. Using synthetic peptide dilution series, we show that the sensitivity, dynamic range and reproducibility established with SWATH-mass spectrometry are uniformly achieved. This study demonstrates that the acquisition of reproducible quantitative proteomics data by multiple labs is achievable, and broadly serves to increase confidence in SWATH-mass spectrometry data acquisition as a reproducible method for large-scale protein quantification.SWATH-mass spectrometry consists of a data-independent acquisition and a targeted data analysis strategy that aims to maintain the favorable quantitative characteristics on the scale of thousands of proteins. Here, using data generated by eleven groups worldwide, the authors show that SWATH-MS is capable of generating highly reproducible data across different laboratories.


Conflict of interest statement

C.H. is an employee of SCIEX, which operates in the field covered by the article. R.A. holds shares of Biognosys AG which operates in the field covered by the article. The remaining authors declare no competing financial interests.

Figures

Fig. 1
Fig. 1
Study design and implementation. a A set of 30 SIS peptides partitioned into five groups (A–E, six peptides in each) were diluted into a HEK293 cell lysate to span a large dynamic range. Starting at a different upper concentration for each group, they were threefold diluted into the matrix to cover a concentration range from 12 amol to 10 pmol in 1 µg of cell lysate. This created a set of five samples to be run by SWATH-MS on the TripleTOF 5600/5600+ system at each site. Each sample was run once per day on day 1, 3, and 5, with the exception of sample 4 which was run 3× on each day. b After data acquisition, the 229 SWATH-MS files were assembled centrally and processed using two strategies. The SIS peptide concentration curves were assessed using MultiQuant Software, allowing for the determination of linear dynamic range (LDR), and LLOQs for each peptide. In addition, the intra- and inter-day CVs were determined before and after normalization. The HEK293 proteome matrix data was analyzed using the OpenSWATH pipeline and the Combined Human Assay Library consisting of ~10,000 proteins. The false discovery rate was controlled at the peptide query and protein level using PyProphet. Protein abundances were inferred by summing the top five most abundant fragment ions from the three most abundant peak groups using the aLFQ software. We then used protein abundances to cluster, and compute Pearson correlation coefficients, for all samples from all sites
Fig. 2
Fig. 2
A consistent set of proteins is detected across sites. a The number of proteins detected in each of the 229 SWATH-MS analyses is shown ordered by site of data collection and then chronologically by time of acquisition. After filtering the data set in a global fashion at 1% FDR at the peptide query and protein levels, a protein was considered detected in a given sample when a peak group for that protein was detected at 1% FDR in the context of that sample (see Supplementary Note 2 for a detailed discussion of FDR). The blue line indicates the cumulate set of proteins detected with each new sample moving from left to right. The maximum of the blue line indicates the set of proteins detected at 1% FDR in the global context. The saturation of the number of proteins detected after a few samples indicates that the set of proteins observed by all sites is highly uniform. b A protein abundance matrix on the log2 scale is shown for 229 SWATH-MS analyses from all sites corresponding to the set of proteins shown in a. White indicates a missing protein abundance value where a given protein was not confidently detected in a given sample. The proteins are ordered from top to bottom first by row completeness and then by protein abundance. c Equivalent to a except that the analysis and FDR control is carried independently out on a site-by-site basis instead of aggregated across all sites before analysis and FDR control
Fig. 3
Fig. 3
Reproducibility of SWATH-MS measurements. a The CVs of peak areas for each of the 30 SIS peptides for S4 sample, depicted on the y-axis using logarithmic scaling, were determined at the intra-day level within the site (light blue—without normalization, dark blue with normalization), inter-day level within site (light green—without normalization, dark green with normalization), and inter-site level (i.e., over all S4 samples in the study; light gray—without normalization, dark gray—with normalization). The orange line indicates 20% CV for visual reference. b Similarly, the CV of protein abundances for the 4077 proteins that were detected in >80% all samples were computed at the intra-day level within the site, inter-day with site, and inter-site (i.e., all 229 samples in the study). c The inter-site CVs were binned based on log2 protein abundance to visualize the dependence of CV on protein abundance
Fig. 4
Fig. 4
Dynamic range and linearity. a The response curves for each of the 30 SIS peptides for Site 1 were determined and plotted together (corresponding plots for all other sites are shown in Supplementary Fig. 13). b From this data, an average response curve for each site was constructed by averaging (mean) the responses of peptides at the same concentration point. This visualization facilitates comparison of both the dynamic range and average response between sites. c The average response curves from b replotted after the normalization has been applied. d The proteins detected in the SWATH-MS analysis of the HEK293 proteome matrix were mapped onto a previous in-depth DDA analysis of the U2OS cell line that employed multi-level fractionation to achieve deep proteome coverage. To demonstrate the dynamic range achieved by the single-shot SWATH-MS analysis we plotted the proteins detected by SWATH-MS binned by the protein copies per cell value (log10 scale) determined from the in-depth U2OS DDA study. In the range 105−107 copies per cell the proteome coverage is essentially complete and decreases with lower copies per cell bins
Fig. 5
Fig. 5
Lower limit of quantification in SWATH-MS and MS1. The percentage of the 30 SIS peptides detected at each concentration in the dilution series from each site of data collection was plotted at the SWATH-MS level a and the MS1 level b. Lower limit of quantification was defined as <20% CV, S/N > 20, 80–120% accuracy using linear fit with 1/x weighting in the response curve. Spectral peak widths for XIC generation were 0.02 m/z for MS1 and 0.05 m/z for SWATH-MS2, and the nominal resolving power was 30,000 and 15,000, respectively. c The average % detection at each concentration for all sites was determined (bold line in a and b) and overlaid to summarize detection differences between SWATH-MS and MS1 data. For the MS1 data, the C12 and C13 XIC data was also summed for comparison. Error bars are ± 1 standard deviation. d The data from a single site (site 1) is also shown for comparison
Fig. 6
Fig. 6
Clustering and correlation of SWATH-MS quantitative proteomes. a The dendrogram for the 229 samples from all sites resulting from hierarchical clustering based on the log2 protein abundances generated from the SWATH-MS data is shown. The sites are color coded as per the legend. The “D” and “S” notation refers to the day and sample number respectively (Fig 1a). The samples primarily cluster by site of data acquisition whereas the day of data acquisition with one site is generally not clustered. b A correlation matrix showing Pearson coefficients between the 229 samples (all vs. all) is shown. The samples are ordered first by site and then chronologically. The color-scale indicates the magnitude of the Pearson correlation coefficient and the gray arrowheads on the color-scale indicate the median and minimum Pearson correlation across all binary comparisons

References

    1. Freedman LP, Cockburn IM, Simcoe TS. The economics of reproducibility in preclinical research. PLoS Biol. 2015;13:e1002165. doi: 10.1371/journal.pbio.1002165. - DOI - PMC - PubMed
    1. Begley CG, Ellis LM. Drug development: raise standards for preclinical cancer research. Nature. 2012;483:531–533. doi: 10.1038/483531a. - DOI - PubMed
    1. Prinz F, Schlange T, Asadullah K. Believe it or not: how much can we rely on published data on potential drug targets? Nat. Rev. Drug Discov. 2011;10:712–712. doi: 10.1038/nrd3439-c1. - DOI - PubMed
    1. Irizarry RA, et al. Multiple-laboratory comparison of microarray platforms. Nat. Methods. 2005;2:345–350. doi: 10.1038/nmeth756. - DOI - PubMed
    1. Seqc/Maqc-Iii Consortium. A comprehensive assessment of RNA-seq accuracy, reproducibility and information content by the sequencing quality control consortium. Nat. Biotechnol. 2014;32:903–914. doi: 10.1038/nbt.2957. - DOI - PMC - PubMed

Publication types

LinkOut - more resources