

Ecological effects of full and partial protection in the crowded Mediterranean Sea: a regional meta-analysis
- PMID: 28827603
- PMCID: PMC5566470
- DOI: 10.1038/s41598-017-08850-w
Ecological effects of full and partial protection in the crowded Mediterranean Sea: a regional meta-analysis
Erratum in
-
Author Correction: Ecological effects of full and partial protection in the crowded Mediterranean Sea: a regional meta-analysis.Sci Rep. 2018 Nov 30;8(1):17644. doi: 10.1038/s41598-018-36021-y. Sci Rep. 2018. PMID: 30498213 Free PMC article.
Abstract
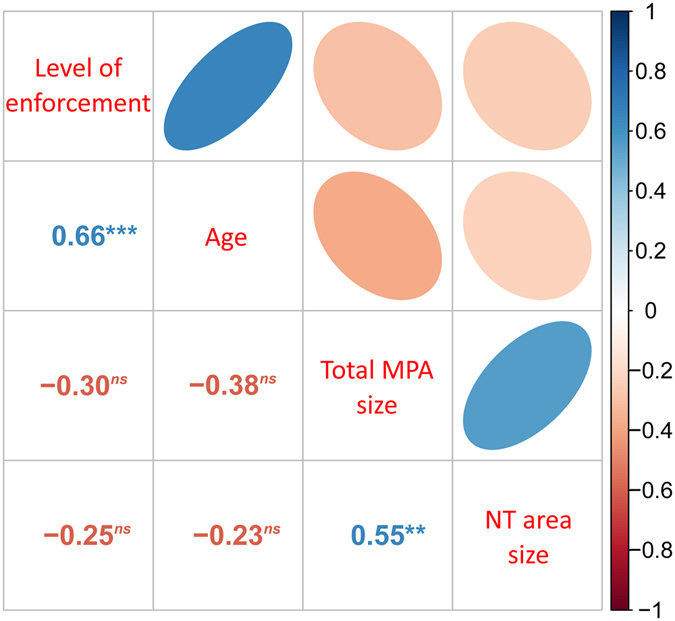
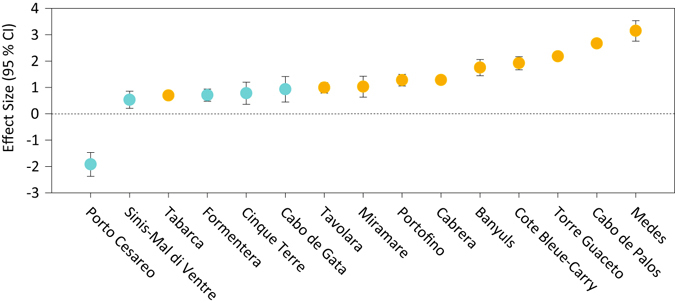
Marine protected areas (MPAs) are a cornerstone of marine conservation. Globally, the number and coverage of MPAs are increasing, but MPA implementation lags in many human-dominated regions. In areas with intense competition for space and resources, evaluation of the effects of MPAs is crucial to inform decisions. In the human-dominated Mediterranean Sea, fully protected areas occupy only 0.04% of its surface. We evaluated the impacts of full and partial protection on biomass and density of fish assemblages, some commercially important fishes, and sea urchins in 24 Mediterranean MPAs. We explored the relationships between the level of protection and MPA size, age, and enforcement. Results revealed significant positive effects of protection for fisheries target species and negative effects for urchins as their predators benefited from protection. Full protection provided stronger effects than partial protection. Benefits of full protection for fish biomass were only correlated with the level of MPA enforcement; fish density was higher in older, better enforced, and -interestingly- smaller MPAs. Our finding that even small, well-enforced, fully protected areas can have significant ecological effects is encouraging for "crowded" marine environments. However, more data are needed to evaluate sufficient MPA sizes for protecting populations of species with varying mobility levels.
Conflict of interest statement
The authors declare that they have no competing interests.
Figures


References
-
- Leenhardt, P., Low, N., Pascal, N., Micheli, F. & Claudet, J. The role of marine protected areas in providing ecosystem services. in Aquatic functional biodiversity: An ecological and evolutionary perspective (eds. Belgrano, A., Woodward, G. & Jacob, U.) (Elsevier, 2015).
-
- Sala E, et al. Fish banks: An economic model to scale marine conservation. Mar. Policy. 2016;73:154–161. doi: 10.1016/j.marpol.2016.07.032. - DOI
-
- Horta e Costa B, et al. A regulation-based classification system for marine protected areas (MPAs) Mar. Policy. 2016;72:192–198. doi: 10.1016/j.marpol.2016.06.021. - DOI
-
- Devillers R, et al. Reinventing residual reserves in the sea: are we favouring ease of establishment over need for protection? Aquat. Conserv. Mar. Freshw. Ecosyst. 2015;25:480–504. doi: 10.1002/aqc.2445. - DOI
Publication types
MeSH terms
LinkOut - more resources
Full Text Sources
Other Literature Sources
Miscellaneous
