. 2017 Aug 21;7(1):8352.
doi: 10.1038/s41598-017-08873-3.

Macroalgal browsing on a heavily degraded, urbanized equatorial reef system

Affiliations

Macroalgal browsing on a heavily degraded, urbanized equatorial reef system

Andrew G Bauman et al. Sci Rep. .

Abstract

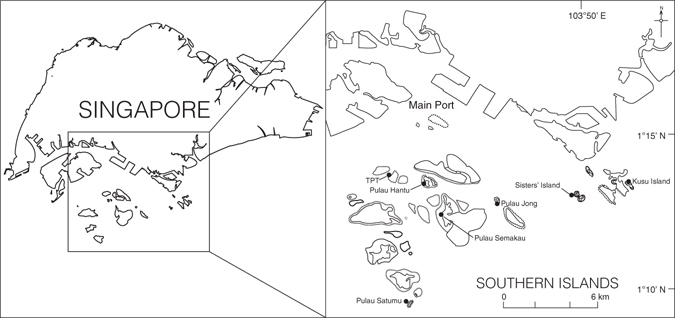
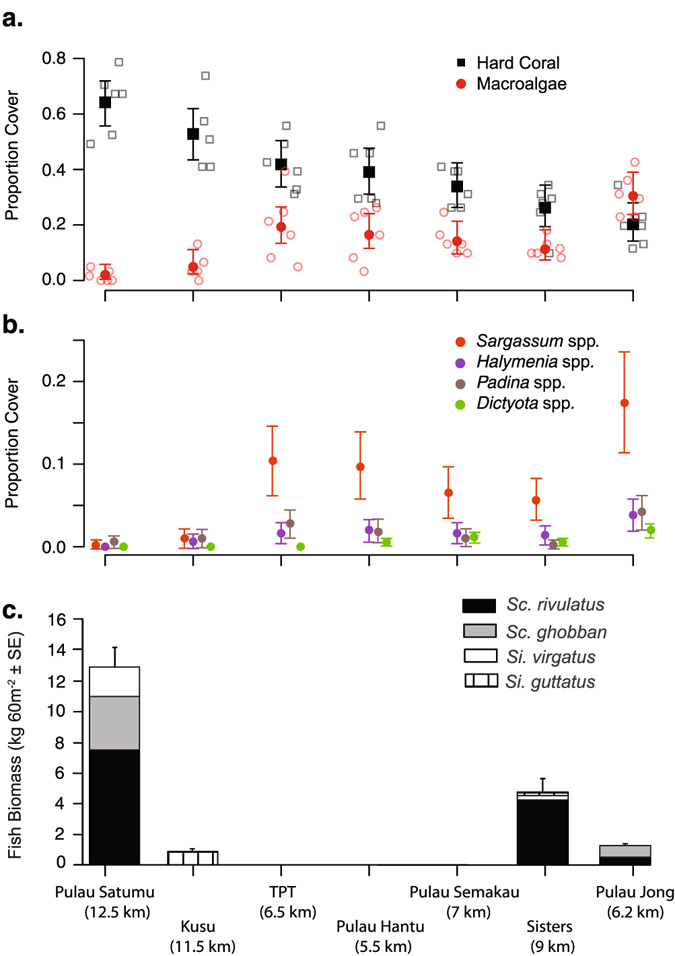
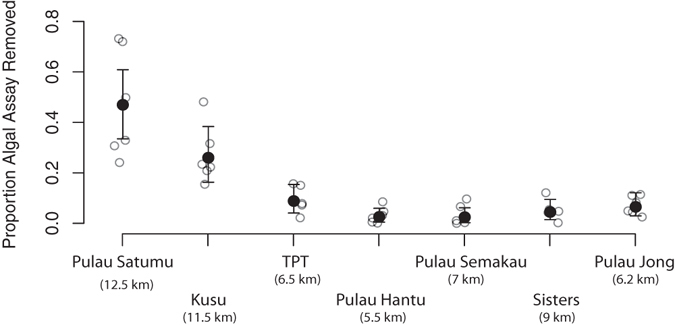
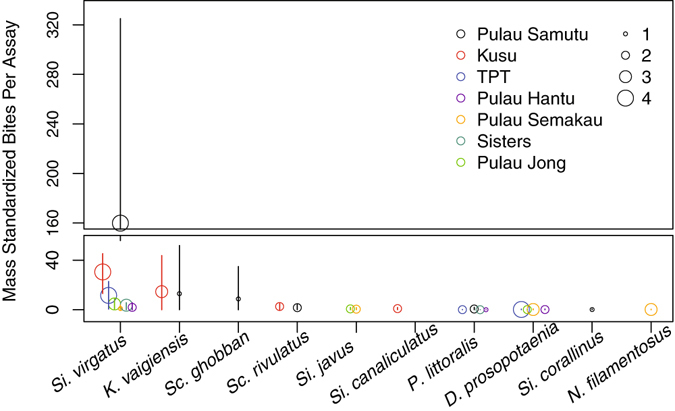
The removal of macroalgal biomass is critical to the health of coral reef ecosystems. Previous studies on relatively intact reefs with diverse and abundant fish communities have quantified rapid removal of macroalgae by herbivorous fishes, yet how these findings relate to degraded reef systems where fish diversity and abundance are markedly lower and algal biomass substantially higher, is unclear. We surveyed roving herbivorous fish communities and quantified their capacity to remove the dominant macroalga Sargassum ilicifolium on seven reefs in Singapore; a heavily degraded urbanized reef system. The diversity and abundance of herbivorous fishes was extremely low, with eight species and a mean abundance ~1.1 individuals 60 m-2 recorded across reefs. Consumption of S. ilicifolium varied with distance from Singapore's main port with consumption being 3- to 17-fold higher on reefs furthest from the port (Pulau Satumu: 4.18 g h-1; Kusu Island: 2.38 g h-1) than reefs closer to the port (0.35-0.78 g h-1). Video observations revealed a single species, Siganus virgatus, was almost solely responsible for removing S. ilicifolium biomass, accounting for 83% of the mass-standardized bites. Despite low herbivore diversity and intense urbanization, macroalgal removal by fishes on some Singaporean reefs was directly comparable to rates reported for other inshore Indo-Pacific reefs.


Conflict of interest statement

The authors declare that they have no competing interests.

Figures

Figure 1
Figure 1
Map showing seven reefs in the southern islands of Singapore. Reefs organized from west to east: Terumbu Pempang Tengah (TPT), Pulau Satumu, Pulau Hantu, Pulau Semakau, Pulau Jong, Sisters’ Island and Kusu. Dotted lines represent fringing reef areas. The map is modified from Bauman et al. and used with permission of the author (https://creativecommons.org/licenses/by/4.0/).
Figure 2
Figure 2
Variation in the proportion of hard coral and macroalgal benthic cover at each reef, ranked by proportion of hard coral cover along the x-axis (decreasing left to right), and browsing fish biomass among reefs in Singapore. (a) Raw data (open symbols) and model fits (filled symbols ± 95% CI) from separate binomial GLM’s for hard coral and macroalgae cover. (b) Model fit ( ±95% CI) from multivariate model of macroalgae genera point-intercept counts per transect, presented as proportion cover. Estimates from macoalgae genera with significant differences between reefs are presented. (c) Macroalgal browser biomass estimates for each reef based on six 30 × 2-m belt transects. Distance (km) from the main port is presented in parentheses.
Figure 3
Figure 3
Proportion of algal assay mass removed on each reef (n = 5–6). Raw data (open symbols) and back-transformed model fits (filled symbols ± 95% CI) from linear model of logit-transformed proportion mass removed from each assay. Reefs are ranked by proportion of hard coral cover along the x-axis (decreasing left to right) and distance from the main port presented in parentheses (km).
Figure 4
Figure 4
Mean number of mass standardized bites recorded per assay (n = 4) for each fish species at each reef. Symbol size indicates the number of video assays the species was observed feeding on at each reef, and whiskers represent the data range. Species are ranked by total mass standardized bites along the x-axis (decreasing left to right).

References

    1. Gardner TA, Côté IM, Gill JA, Grant A, Watkinson AR. Long-term region-wide declines in Caribbean corals. Science. 2003;301:958–960. doi: 10.1126/science.1086050. - DOI - PubMed
    1. Hughes TP, et al. Global warming and recurrent mass bleaching of corals. Nature. 2017;543:373–377. doi: 10.1038/nature21707. - DOI - PubMed
    1. Hughes TP. Catastrophes, phase shifts and large-scale degradation of a Caribbean coral reef. Science. 1994;265:1–23. doi: 10.1126/science.265.5178.1547. - DOI - PubMed
    1. McClanahan TR, Muthiga NA, Mangi S. Coral and algal changes after the 1998 coral bleaching: Interaction with reef management and herbivores on Kenyan reefs. Coral Reefs. 2001;19:380–391. doi: 10.1007/s003380000133. - DOI
    1. Cheal AJ, et al. Coral-macroalgal phase shifts or reef resilience: links with diversity and functional roles of herbivorous fishes on the Great Barrier Reef. Coral Reefs. 2010;29:1005–1015. doi: 10.1007/s00338-010-0661-y. - DOI

Publication types