. 2017 Aug 21;13(8):e1005711.
doi: 10.1371/journal.pcbi.1005711. eCollection 2017 Aug.

Polymodal allosteric regulation of Type 1 Serine/Threonine Kinase Receptors via a conserved electrostatic lock

Affiliations

Polymodal allosteric regulation of Type 1 Serine/Threonine Kinase Receptors via a conserved electrostatic lock

Wesley M Botello-Smith et al. PLoS Comput Biol. .

Abstract

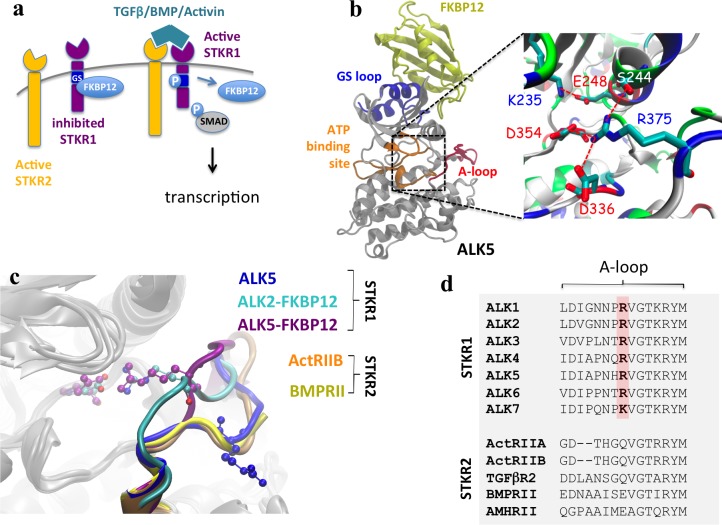
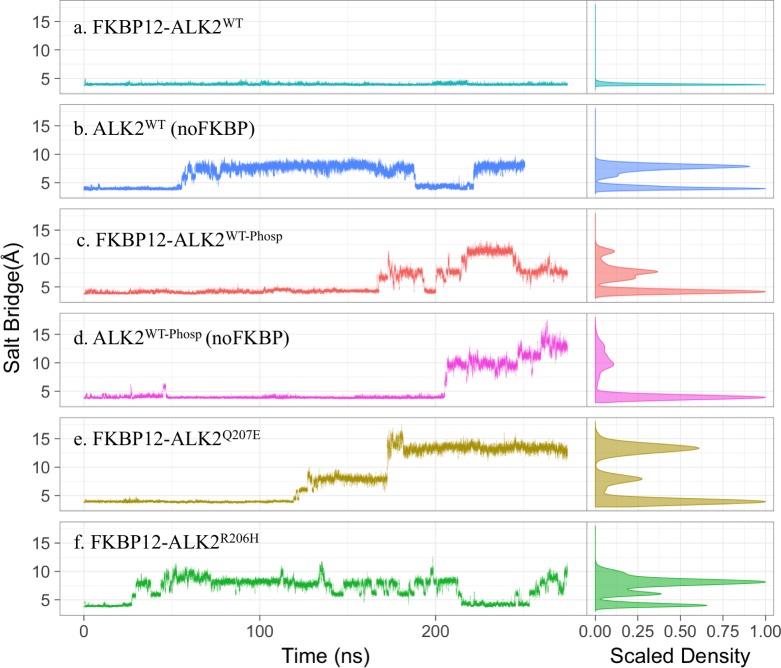
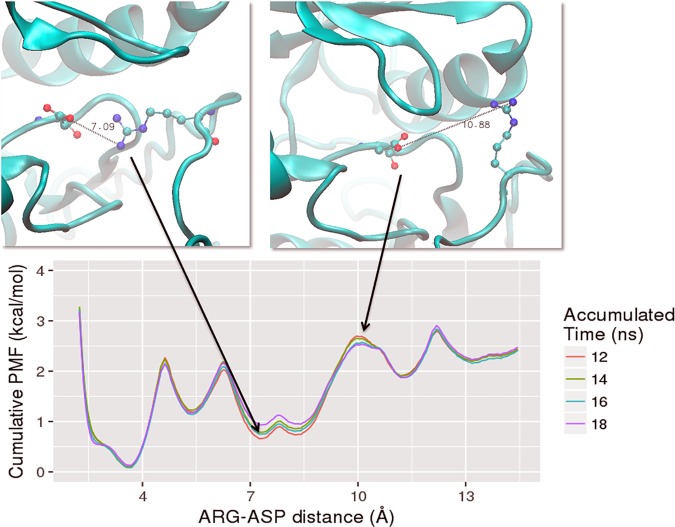
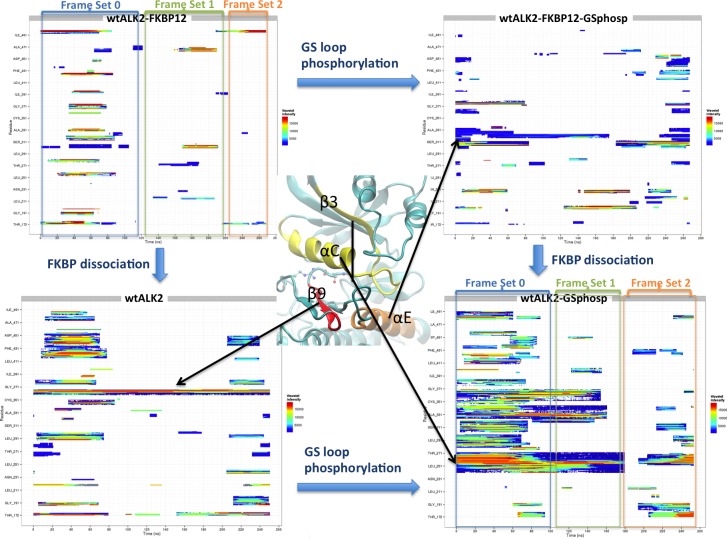
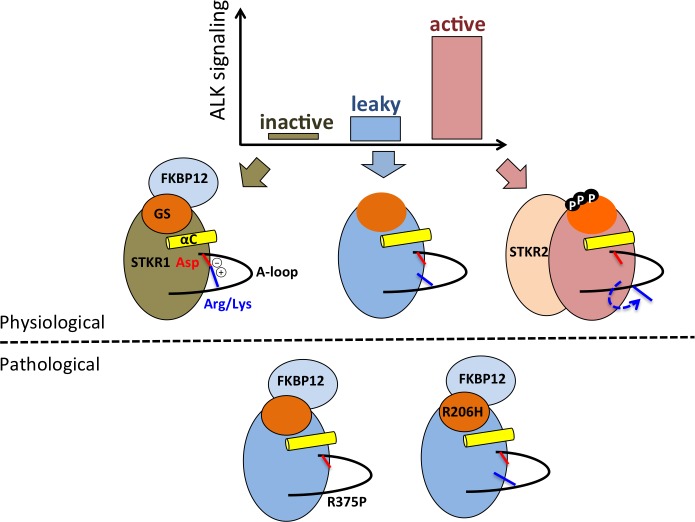
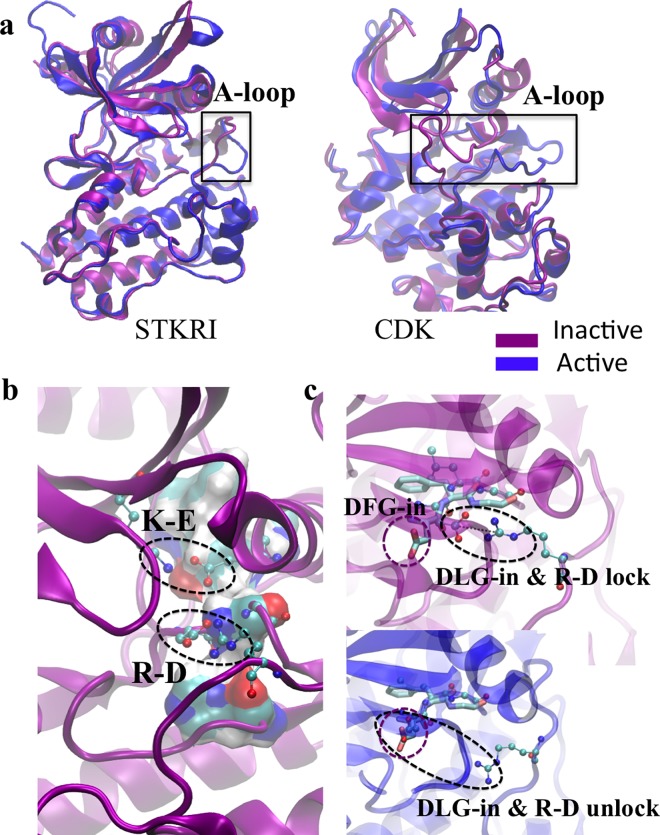
Type 1 Serine/Threonine Kinase Receptors (STKR1) transduce a wide spectrum of biological signals mediated by TGF-β superfamily members. The STKR1 activity is tightly controlled by their regulatory glycine-serine rich (GS) domain adjacent to the kinase domain. Despite decades of studies, it remains unknown how physiological or pathological GS domain modifications are coupled to STKR1 kinase activity. Here, by performing molecular dynamics simulations and free energy calculation of Activin-Like Kinase 2 (ALK2), we found that GS domain phosphorylation, FKBP12 dissociation, and disease mutations all destabilize a D354-R375 salt-bridge, which normally acts as an electrostatic lock to prevent coordination of adenosine triphosphate (ATP) to the catalytic site. We developed a WAFEX-guided principal analysis and unraveled how phosphorylation destabilizes this highly conserved salt-bridge in temporal and physical space. Using current-flow betweenness scores, we identified an allosteric network of residue-residue contacts between the GS domain and the catalytic site that controls the formation and disruption of this salt bridge. Importantly, our novel network analysis approach revealed how certain disease-causing mutations bypass FKBP12-mediated kinase inhibition to produce leaky signaling. We further provide experimental evidence that this salt-bridge lock exists in other STKR1s, and acts as a general safety mechanism in STKR1 to prevent pathological leaky signaling. In summary, our study provides a compelling and unifying allosteric activation mechanism in STKR1 kinases that reconciles a large number of experimental studies and sheds light on a novel therapeutic avenue to target disease-related STKR1 mutants.


Conflict of interest statement

The authors have declared that no competing interests exist.

Figures

Fig 1
Fig 1. A conserved electrostatic lock in the kinase domain prevents STKR1 activation.
(a) Scheme of TGFβ/BMP/Activin induced signaling. (b) Structure of FKBP12-ALK2 complex and a close view of the R375-D354 salt bridge, as well as other salt bridges and hydrogen bonds involving R375 in ALK2 are illustrated. A conserved Lys-Glu pair (K235-E248) between β3 sheet and αC helix is also shown here. (c) Structural alignment of the kinase domain from nine crystal structures. R-D salt bridge residues are shown in CPK mode. Five ALK5 crystal structures without FKBP12 bound are taken from PDB 1IAS, 2WOT, 3TZM, 4X2N, and 5E8S. The overlapped A-loop is shown in blue. ALK2 with FKBP12 bound is shown in cyan (PDB 3H9R) and ALK5 with FKBP12 bound is in purple (PDB 1B6C). For STKR2, ActRIIB is shown in orange (PDB 2QLU) and BMPRII in yellow (PDB 3G2F). The missing A-loop in ALK2 crystal structure (residues 362–374) was transplanted from the crystal structure of inactive ALK2 structure PDB 3Q4U. Small molecular inhibitors in ATP binding site of the crystal structures are not shown. (d) Partial sequence alignment of human STKR1 (ALK1-7) and STKR2 isoforms (ActRIIA and B, TGFβR2, BMPRII and AMHRII) showing strict conservation of the positively-charged electrostatic lock in all SKTR1 isoforms while being absent in all constitutively active SKTR2 isoforms.
Fig 2
Fig 2. Salt bridge distance between R375(Cζ) and D354 (Cγ) in six simulated systems: FKBP12-ALK2WT; ALK2WT; FKBP12-ALK2WT-Phosp; ALK2WT-Phosp; FKBP12-ALKQ207E; and FKBP12-ALK2R206H.
The right panels are the distribution of the distances over the whole trajectories. R375(Cζ)-D354 (Cγ) distance below 5 Å represents salt bridge forming.
Fig 3
Fig 3. Potential of mean force (PMF) along the R-D distance calculated from Hamiltonian replica-exchange umbrella sampling (H-REUS) molecular dynamics simulations.
The system used is the ALK2WT and representative snapshots are shown above. A total of 30 ns per window (window width is 1.5 Å) were sampled. To check convergence, PMFs were generated for cumulative windows of the last 18 ns of trajectory. These corresponded to 12–24 ns (labeled as 12 ns in length), 12–26 ns (labeled as 14 ns in length), 12–28 ns (labeled as 16 ns in length), and 12–30 (labeled as 18 ns in length).
Fig 4
Fig 4. WAFEX (clustered wavelet transform) analysis diagram for trajectories from four systems: FKBP12-ALK2WT, ALK2WT, FKBP12-ALK2WT-Phosp, and ALK2WT-Phosp.
The simulation time is shown on x-axis and residue numbers are shown on y-axis. Three-dimensional representation of regions of interest is shown in the middle to indicate corresponding regions in the WAFEX plots. Color code indicates the wavelet intensity, with red representing the most intensive and blue the least intensive. Frame sets 0 to 2 were used to guide subsequent principal component analysis.
Fig 5
Fig 5. Separation between R375 and αC helix described by principal component analysis.
Top: Three-dimensional projections of the second principal component of FKBP12-ALK2WT (left) and ALK2WT-Phosp (right) using frame set 2 trajectories. Projections of the R-Component vectors onto the alpha carbons of each residue are shown as yellow conical tipped arrows. Backbone fluctuation is displayed as red transparent ribbon overlays. The region of αC helix responsible for the steric barrier to Arg flipping is highlighted with red glowing rectangles. Bottom: Natural log of R375 to αC helix separation for first 15 principal components of FKBP12-ALK2WT (teal) and ALK2WT-Phosp (orange), taken over trajectory subsets indicated in the previous wavelet analysis figure. The diagram of the R375 and αC helix separation calculation is shown on the right.
Fig 6
Fig 6. BRE-luciferase reporter assay for different STKR1 receptor mutants.
(a) C2C12/BRE-luc cells were either untreated (grey bars), treated with 1μM FK506 (red bars) or 50 ng/ml BMP6 (blue bars) overnight, followed by a dual-Luciferase reporter assay. Renilla luciferase reporter pRL-TK plasmid was used as an internal control. (b) The relative luciferase unit difference between FK506 treatment and untreatment for the STKR1 receptor mutants. Data are presented as the mean ± S.E.M. (standard error), each performed in triplicate. ns., no significant difference; *p< 0.05, **p< 0.01, ***p< 0.001.
Fig 7
Fig 7. Network analysis shows the communication between R/H206 and R375 in FKBP12-ALKWT (left) and FKBP12-ALKR206H (right).
(a). 2D depiction of atomic motion transmission networks from residue 206 to residue R375. Edge color depicts current flow-betweenness scores, representing the relative importance of each contact pair with respect to transmission of motion between the residue 206 and R375. Line thickness represents atomic fluctuation correlation between nodes (Cα of residues) Top: full transmission network. Bottom: Sub-networks corresponding to optimum flow-betweenness path plus additional edges of suboptimal paths which exceeded optimal path length by no more than 20%. (b) 3D depiction of high transmission networks between residue 206 and R375. Nodes participating in sub-network, along with the relevant salt bridge lock residue D354 are marked with purple spheres. Nodes present in R206H mutant and not in wild type are marked with yellow spheres in the R206H sub-panel.
Fig 8
Fig 8. Cartoon showing structure-function relationships in STKR1s.
Various kinase activity levels (inactive, leaky and active) are determined by two inhibitory mechanisms (FKBP12 binding and the endogenous R-D lock) and one activation mechanism (phosphorylation) that promotes FKBP12 dissociation, R-D lock disruption and also promotes substrate binding to the kinase domain.
Fig 9
Fig 9. Inactive STKR1 adopts a conformation similar to that of the fully active kinases.
(a). Comparison between active and inactive A-loop conformation between STKR1 (ALK5), cyclin-dependent kinase (CDK). (b). Representative inactive FKBP12-ALK2WT catalytic site conformation from MD simulations, with K-E and R-D salt bridge highlighted. R-spine is shown in vdW surface mode colored by atom type. (c). Comparison of DLG-in with DFG-in conformation. DFG motif from Src is shown in licorice mode and GLG motif and R375 are shown in CPK mode.

References

    1. Miyazono K., ten Dijke P., Yamashita H. & Heldin C. H. Signal transduction via serine/threonine kinase receptors. Semin Cell Biol 5, 389–398 (1994). - PubMed
    1. Massague J. TGFbeta signalling in context. Nat Rev Mol Cell Biol 13, 616–630, doi: 10.1038/nrm3434 (2012). - DOI - PMC - PubMed
    1. Nohe A. et al. The mode of bone morphogenetic protein (BMP) receptor oligomerization determines different BMP-2 signaling pathways. J Biol Chem 277, 5330–5338, doi: 10.1074/jbc.M102750200 (2002). - DOI - PubMed
    1. Shi Y. & Massague J. Mechanisms of TGF-beta signaling from cell membrane to the nucleus. Cell 113, 685–700 (2003). - PubMed
    1. Mathews L. S. & Vale W. W. Characterization of type II activin receptors. Binding, processing, and phosphorylation. J Biol Chem 268, 19013–19018 (1993). - PubMed

MeSH terms