. 2017 Aug 21;13(8):e1006963.
doi: 10.1371/journal.pgen.1006963. eCollection 2017 Aug.

Composite likelihood method for inferring local pedigrees

Affiliations

Composite likelihood method for inferring local pedigrees

Amy Ko et al. PLoS Genet. .

Abstract

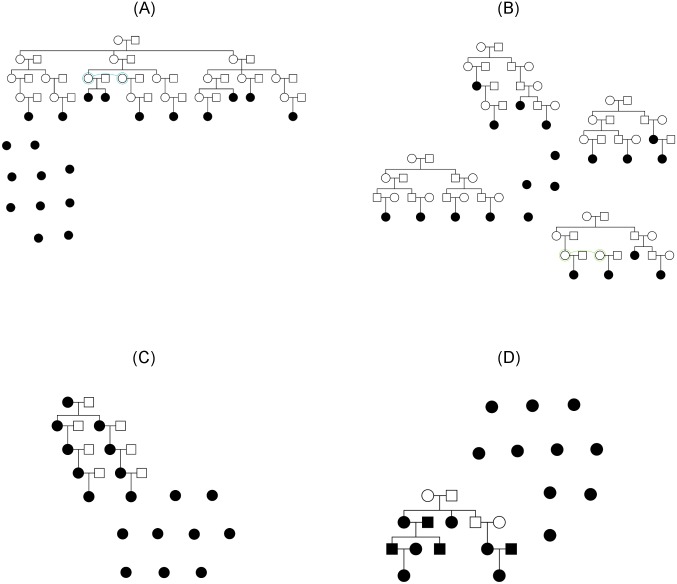
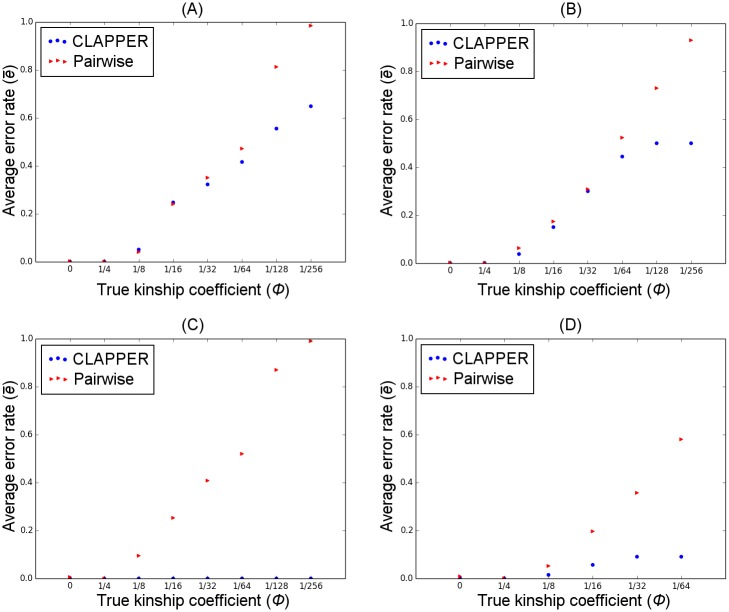
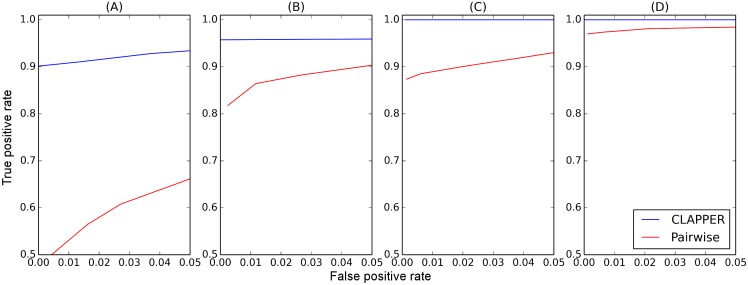
Pedigrees contain information about the genealogical relationships among individuals and are of fundamental importance in many areas of genetic studies. However, pedigrees are often unknown and must be inferred from genetic data. Despite the importance of pedigree inference, existing methods are limited to inferring only close relationships or analyzing a small number of individuals or loci. We present a simulated annealing method for estimating pedigrees in large samples of otherwise seemingly unrelated individuals using genome-wide SNP data. The method supports complex pedigree structures such as polygamous families, multi-generational families, and pedigrees in which many of the member individuals are missing. Computational speed is greatly enhanced by the use of a composite likelihood function which approximates the full likelihood. We validate our method on simulated data and show that it can infer distant relatives more accurately than existing methods. Furthermore, we illustrate the utility of the method on a sample of Greenlandic Inuit.


Conflict of interest statement

The authors have declared that no competing interests exist.

Figures

Fig 1
Fig 1. Simulated pedigrees.
Shaded nodes indicate sampled individuals for which we have genotype data and unshaded nodes indicate unsampled individuals. (A) simulation A; (B) simulation B; (C) simulation C; (D) simulation D.
Fig 2
Fig 2. Effects of LD-pruning on pairwise prediction accuracy.
The three panels show different true pairwise relationships: unrelated, third cousins, and second cousins. Each square in a panel corresponds to the relationship prediction accuracy for a particular genome length and LD-prune threshold. The color indicates the accuracy rate between 0 and 1.
Fig 3
Fig 3. Comparison of prediction error rates.
Each panel compares the average error rate between CLAPPER and competing methods for a particular simulation scenario: (A) simulation A; (B) simulation B; (C) simulation C; (D) simulation D. The x-axis shows different relationship categories measured by the kinship coefficient; the y-axis is the average error rate e¯ (See Measuring the Error Rate). Analysis excludes all experiments that did not finish successfully or did not produce any outbred pedigrees.
Fig 4
Fig 4. Absolute between the expected kinship coefficient under true and inferred relationships, normalized by the true kinship coefficient.
(A) simulation A; (B) simulation B; (C) simulation C; (D) simulation D. The x-axis is the relationship category measured by the kinship coefficient; the y-axis is the distance d between the true relationship and the relationship estimated by our method (See Measuring the Error Rate in Materials and methods section). The magenta line indicates the median value for each box plot. Analysis excludes all experiments that did not finish successfully or did not produce any outbred pedigrees.
Fig 5
Fig 5. Comparison of prediction error rates between CLAPPER and pairwise inference.
Each panel compares the average error rate between the pairwise method and CLAPPER for a particular simulation scenario: (A) simulation A; (B) simulation B; (C) simulation C; (D) simulation D.
Fig 6
Fig 6. ROC curve for detecting relatives in a sample: Pairwise vs. CLAPPER.
(A) simulation A; (B) simulation B; (C) simulation C; (D) simulation D.

References

    1. Ott J, Kamatani Y, Lathrop M. Family-based designs for genome-wide association studies. Nat Rev Genet. 2011;12(7):465–474. 10.1038/nrg2989 - DOI - PubMed
    1. Livne OE, Han L, Alkorta-Aranburu G, Wentworth-Sheilds W, Abney M, Ober C, et al. PRIMAL: Fast and Accurate Pedigree-based Imputation from Sequence Data in a Founder Population. PLoS Comput Biol. 2015;11(3). 10.1371/journal.pcbi.1004139 - DOI - PMC - PubMed
    1. Vinkhuyzen AAE, Wray NR, Yang J, Goddard ME, Visscher PM. Estimation and partition of heritability in human populations using whole-genome analysis methods. Annu Rev Genet. 2013;47:75–95. 10.1146/annurev-genet-111212-133258 - DOI - PMC - PubMed
    1. Blouin MS. DNA-based methods for pedigree reconstruction and kinship analysis in natural populations. Trends Ecol Evol. 2003;18(10):503–511. 10.1016/S0169-5347(03)00225-8 - DOI
    1. Kingman JFC. The coalescent. Stochastic processes and their applications. 1982;13(3):235–248. 10.1016/0304-4149(82)90011-4 - DOI