

Calcium Circadian Rhythmicity in the Suprachiasmatic Nucleus: Cell Autonomy and Network Modulation
- PMID: 28828400
- PMCID: PMC5562299
- DOI: 10.1523/ENEURO.0160-17.2017
Calcium Circadian Rhythmicity in the Suprachiasmatic Nucleus: Cell Autonomy and Network Modulation
Abstract
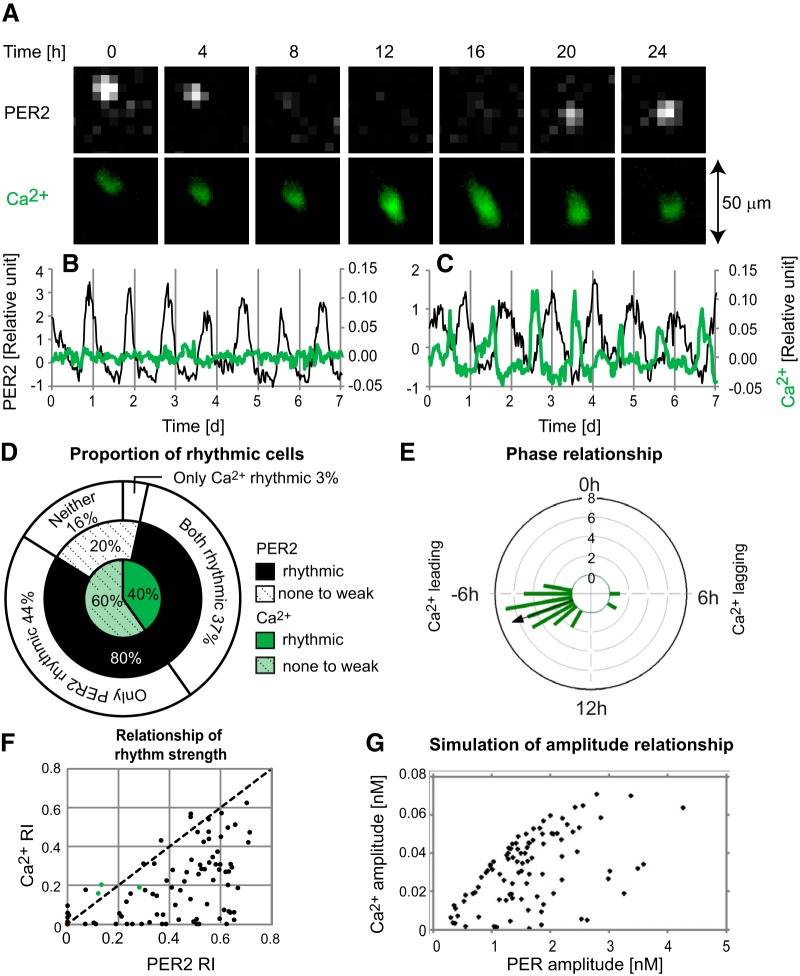
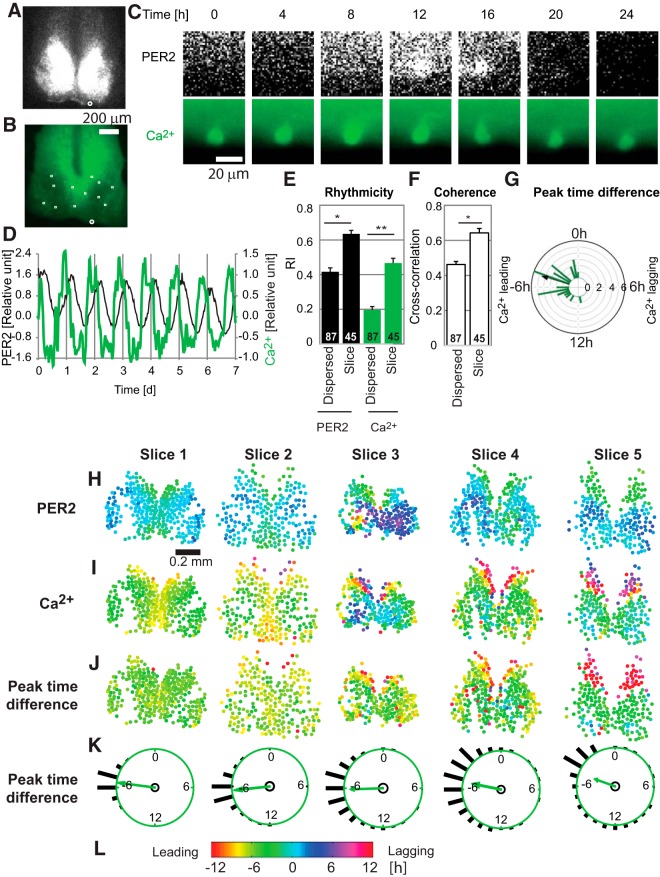
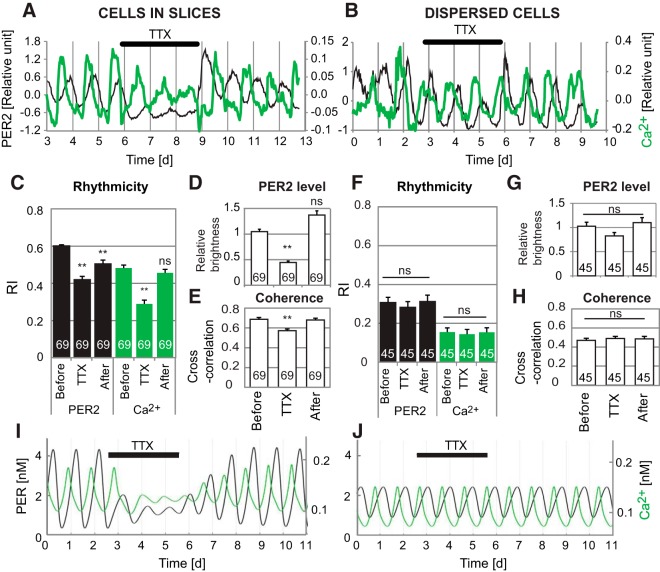
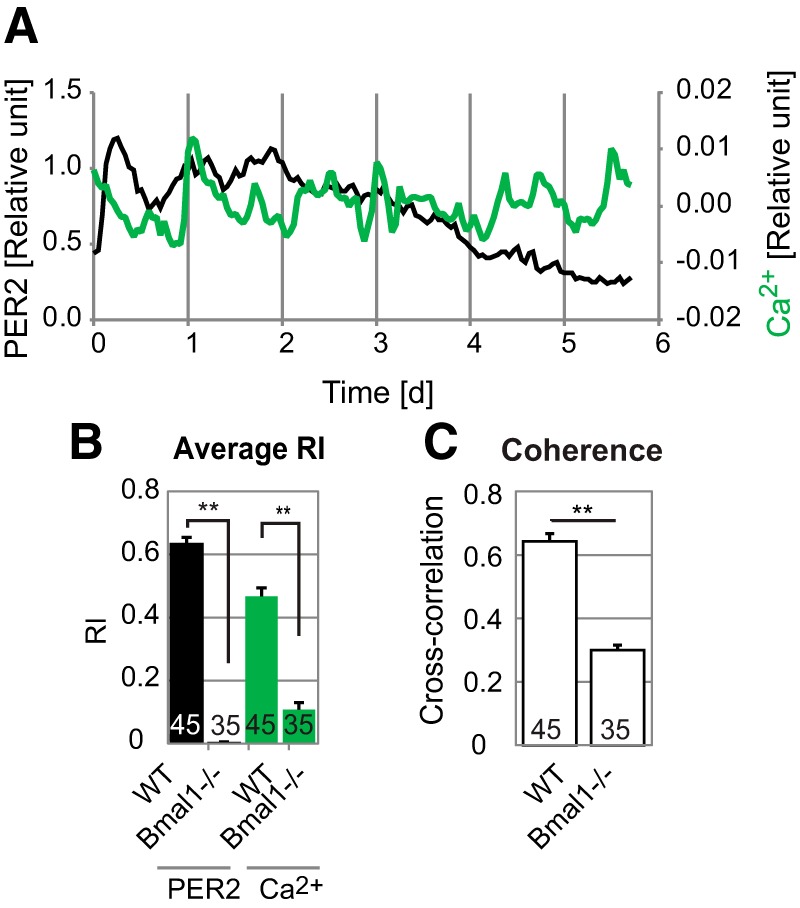
Circadian rhythms of mammalian physiology and behavior are coordinated by the suprachiasmatic nucleus (SCN) in the hypothalamus. Within SCN neurons, various aspects of cell physiology exhibit circadian oscillations, including circadian clock gene expression, levels of intracellular Ca2+ ([Ca2+]i), and neuronal firing rate. [Ca2+]i oscillates in SCN neurons even in the absence of neuronal firing. To determine the causal relationship between circadian clock gene expression and [Ca2+]i rhythms in the SCN, as well as the SCN neuronal network dependence of [Ca2+]i rhythms, we introduced GCaMP3, a genetically encoded fluorescent Ca2+ indicator, into SCN neurons from PER2::LUC knock-in reporter mice. Then, PER2 and [Ca2+]i were imaged in SCN dispersed and organotypic slice cultures. In dispersed cells, PER2 and [Ca2+]i both exhibited cell autonomous circadian rhythms, but [Ca2+]i rhythms were typically weaker than PER2 rhythms. This result matches the predictions of a detailed mathematical model in which clock gene rhythms drive [Ca2+]i rhythms. As predicted by the model, PER2 and [Ca2+]i rhythms were both stronger in SCN slices than in dispersed cells and were weakened by blocking neuronal firing in slices but not in dispersed cells. The phase relationship between [Ca2+]i and PER2 rhythms was more variable in cells within slices than in dispersed cells. Both PER2 and [Ca2+]i rhythms were abolished in SCN cells deficient in the essential clock gene Bmal1. These results suggest that the circadian rhythm of [Ca2+]i in SCN neurons is cell autonomous and dependent on clock gene rhythms, but reinforced and modulated by a synchronized SCN neuronal network.
Keywords: Calcium imaging; PER2; circadian rhythm; luciferase imaging; suprachiasmatic nucleus.
Conflict of interest statement
Authors report no conflict of interest.
Figures
Similar articles
-
IA Channels Encoded by Kv1.4 and Kv4.2 Regulate Circadian Period of PER2 Expression in the Suprachiasmatic Nucleus.J Biol Rhythms. 2015 Oct;30(5):396-407. doi: 10.1177/0748730415593377. Epub 2015 Jul 6. J Biol Rhythms. 2015. PMID: 26152125 Free PMC article.
-
Two coupled circadian oscillations regulate Bmal1-ELuc and Per2-SLR2 expression in the mouse suprachiasmatic nucleus.Sci Rep. 2018 Oct 3;8(1):14765. doi: 10.1038/s41598-018-32516-w. Sci Rep. 2018. PMID: 30283092 Free PMC article.
-
Harmine lengthens circadian period of the mammalian molecular clock in the suprachiasmatic nucleus.Biol Pharm Bull. 2014;37(8):1422-7. doi: 10.1248/bpb.b14-00229. Biol Pharm Bull. 2014. PMID: 25087965
-
Suprachiasmatic nucleus: cell autonomy and network properties.Annu Rev Physiol. 2010;72:551-77. doi: 10.1146/annurev-physiol-021909-135919. Annu Rev Physiol. 2010. PMID: 20148688 Free PMC article. Review.
-
In synch but not in step: Circadian clock circuits regulating plasticity in daily rhythms.Neuroscience. 2016 Apr 21;320:259-80. doi: 10.1016/j.neuroscience.2016.01.072. Epub 2016 Feb 6. Neuroscience. 2016. PMID: 26861419 Free PMC article. Review.
Cited by
-
Calcium Sets the Clock in Ameloblasts.Front Physiol. 2020 Jul 31;11:920. doi: 10.3389/fphys.2020.00920. eCollection 2020. Front Physiol. 2020. PMID: 32848861 Free PMC article.
-
Circadian pacemaker neurons display cophasic rhythms in basal calcium level and in fast calcium fluctuations.Proc Natl Acad Sci U S A. 2022 Apr 26;119(17):e2109969119. doi: 10.1073/pnas.2109969119. Epub 2022 Apr 21. Proc Natl Acad Sci U S A. 2022. PMID: 35446620 Free PMC article.
-
The NRON complex controls circadian clock function through regulated PER and CRY nuclear translocation.Sci Rep. 2019 Aug 15;9(1):11883. doi: 10.1038/s41598-019-48341-8. Sci Rep. 2019. PMID: 31417156 Free PMC article.
-
The Intertwined Roles of Circadian Rhythms and Neuronal Metabolism Fueling Drug Reward and Addiction.Curr Opin Physiol. 2018 Oct;5:80-89. doi: 10.1016/j.cophys.2018.08.004. Epub 2018 Sep 5. Curr Opin Physiol. 2018. PMID: 30631826 Free PMC article.
-
Evolutionary Constraints on Connectivity Patterns in the Mammalian Suprachiasmatic Nucleus.Front Netw Physiol. 2021 Aug 19;1:716883. doi: 10.3389/fnetp.2021.716883. eCollection 2021. Front Netw Physiol. 2021. PMID: 36925572 Free PMC article.
References
-
- Abrahamson EE, Moore RY (2001) Suprachiasmatic nucleus in the mouse: retinal innervation, intrinsic organization and efferent projections. Brain Res 916:172–191. - PubMed
-
- Bates D, Mächler M, Bolker BM, Walker SC (2015) Fitting linear mixed-effects models using lme4. J Stat Softw 67:1–48. 10.18637/jss.v067.i01 - DOI
-
- Berens P (2009) CircStat: a MATLAB toolbox for circular statistics. J Stat Softw 31:1–21. 10.18637/jss.v031.i10 - DOI
Publication types
MeSH terms
Substances
Grants and funding
LinkOut - more resources
Full Text Sources
Other Literature Sources
Molecular Biology Databases
Research Materials
Miscellaneous