Comparative Study
. 2017 Aug 22;62(18):7300-7320.
doi: 10.1088/1361-6560/aa807a.

A comparison of resampling schemes for estimating model observer performance with small ensembles

Affiliations
Comparative Study

A comparison of resampling schemes for estimating model observer performance with small ensembles

Fatma E A Elshahaby et al. Phys Med Biol. .

Abstract

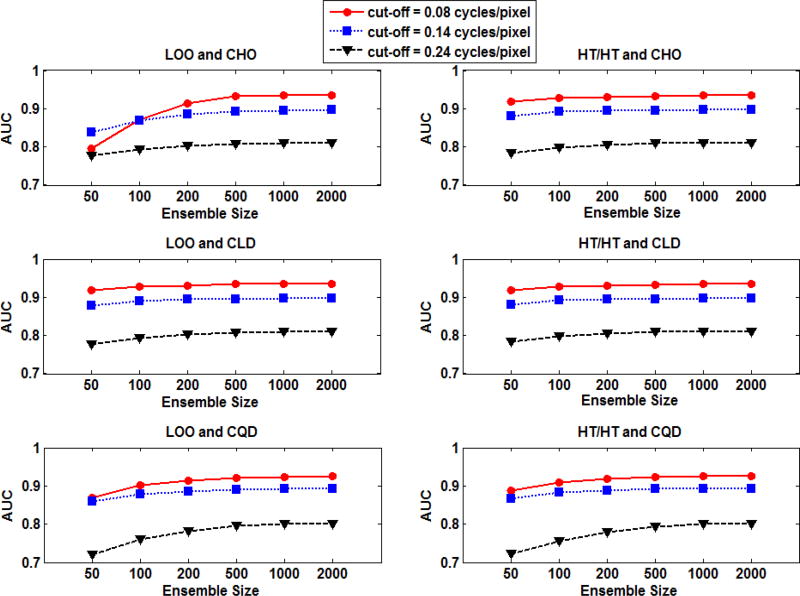
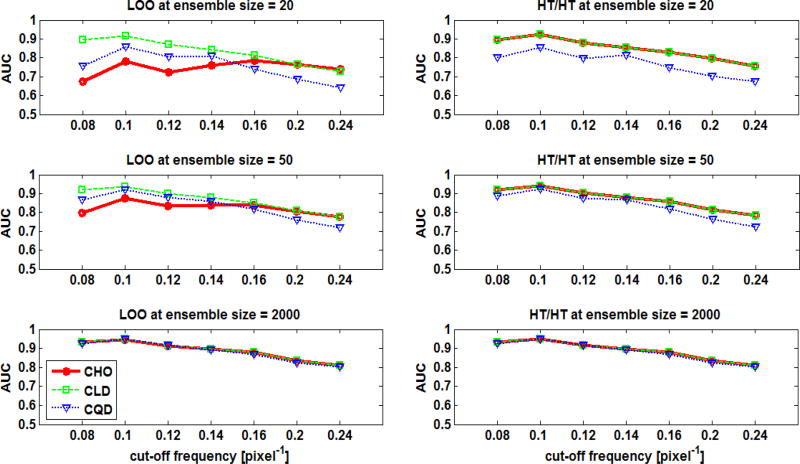
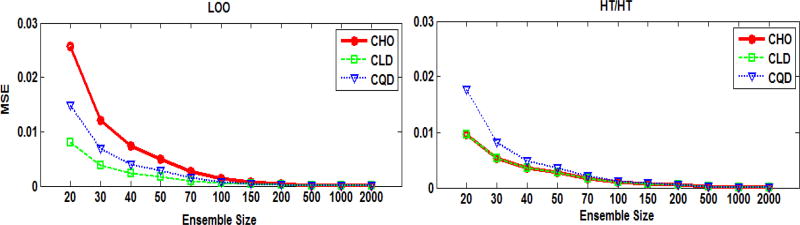
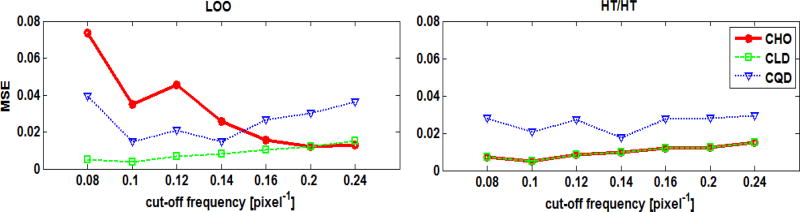
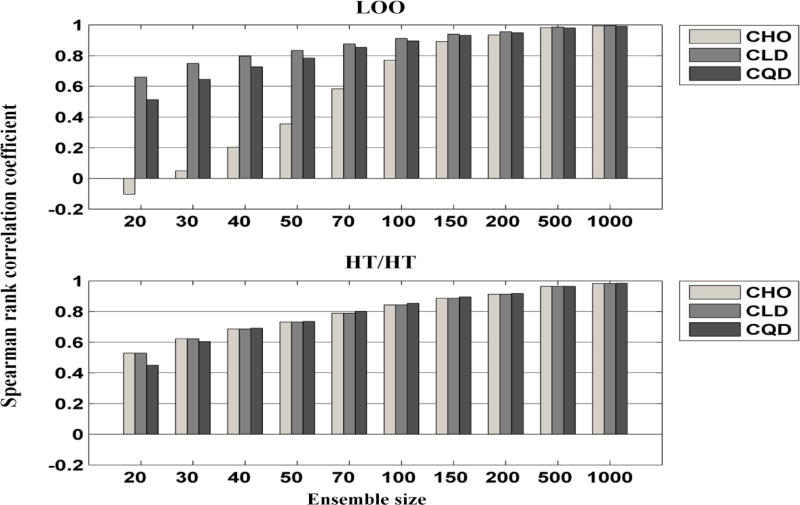
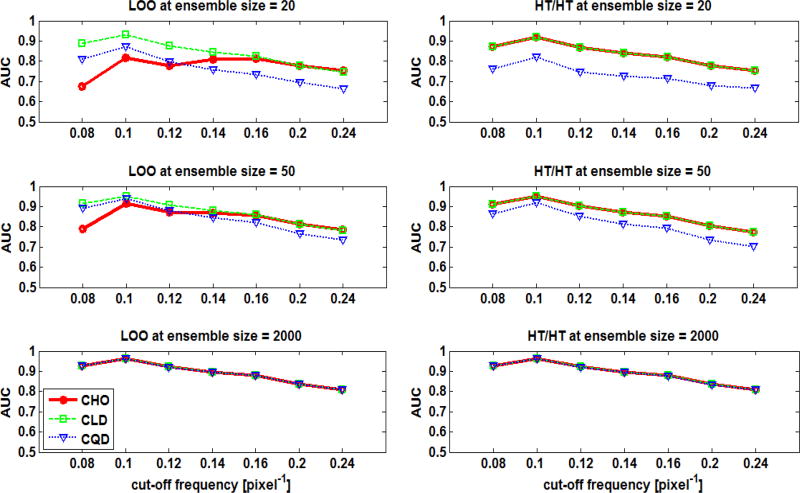
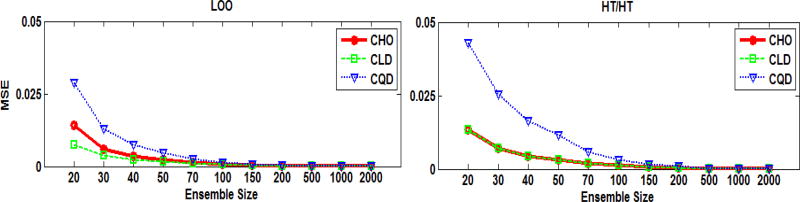
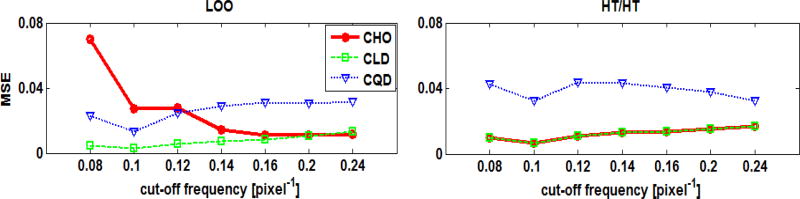
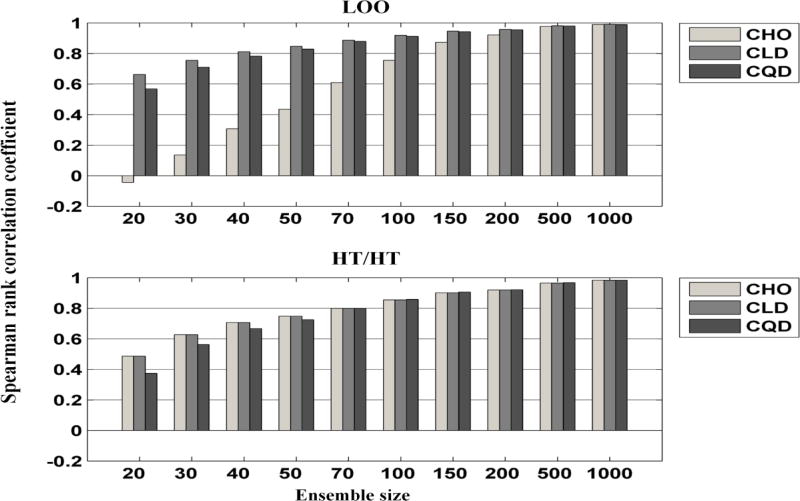
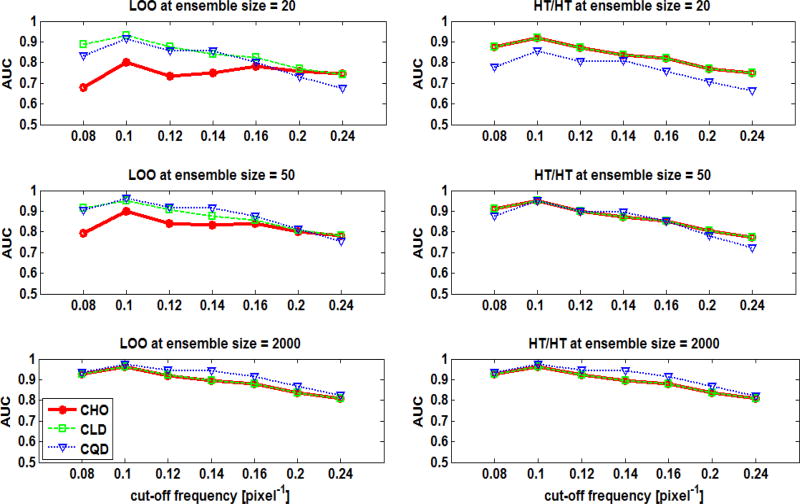
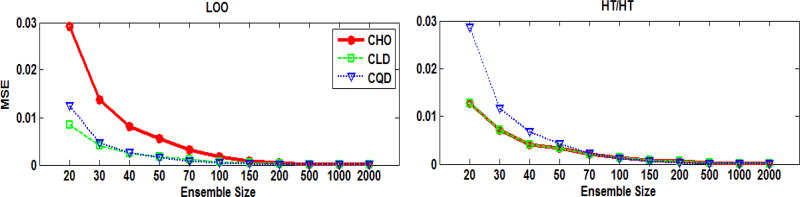
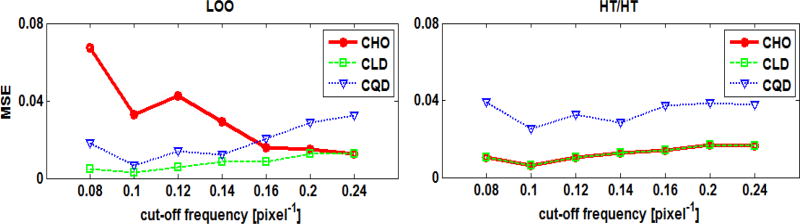
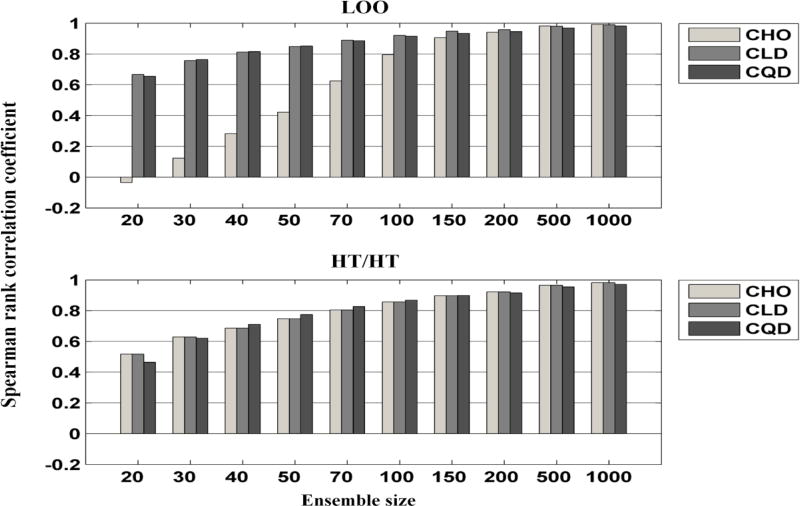
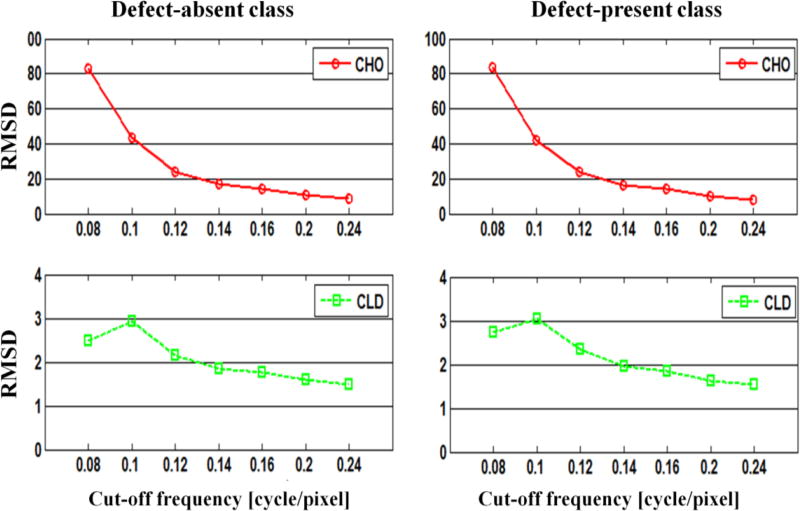
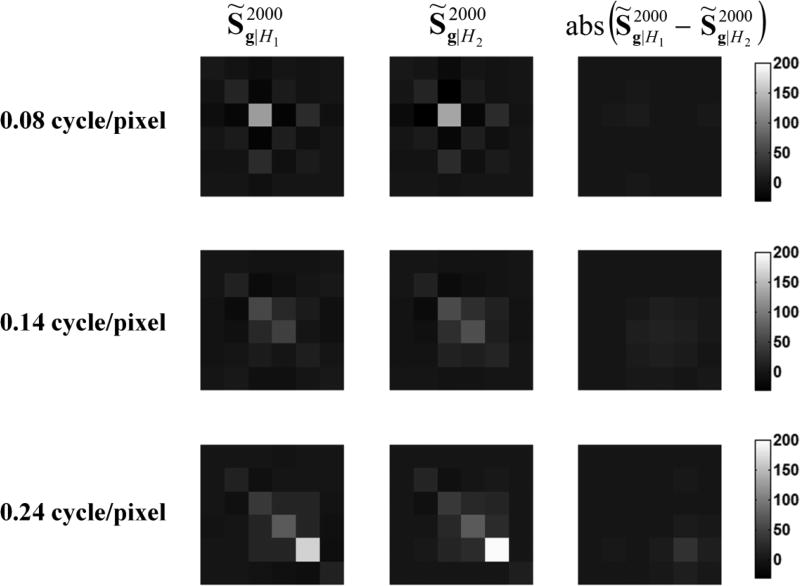
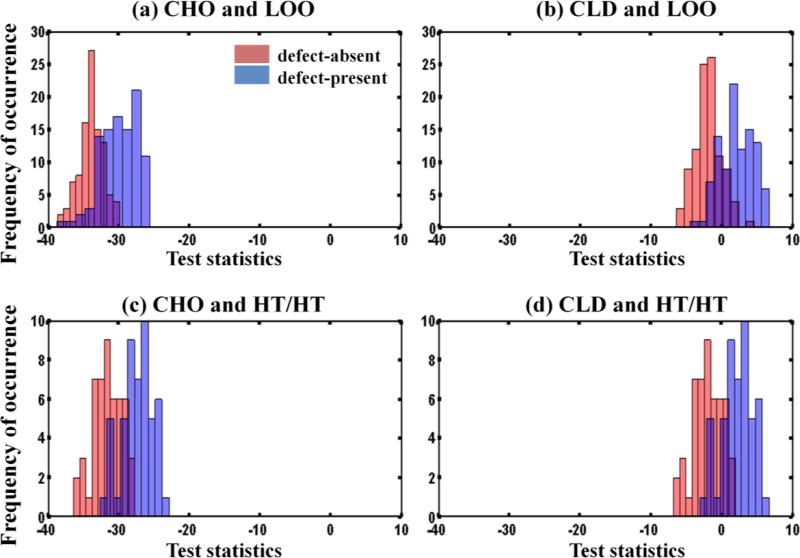
In objective assessment of image quality, an ensemble of images is used to compute the 1st and 2nd order statistics of the data. Often, only a finite number of images is available, leading to the issue of statistical variability in numerical observer performance. Resampling-based strategies can help overcome this issue. In this paper, we compared different combinations of resampling schemes (the leave-one-out (LOO) and the half-train/half-test (HT/HT)) and model observers (the conventional channelized Hotelling observer (CHO), channelized linear discriminant (CLD) and channelized quadratic discriminant). Observer performance was quantified by the area under the ROC curve (AUC). For a binary classification task and for each observer, the AUC value for an ensemble size of 2000 samples per class served as a gold standard for that observer. Results indicated that each observer yielded a different performance depending on the ensemble size and the resampling scheme. For a small ensemble size, the combination [CHO, HT/HT] had more accurate rankings than the combination [CHO, LOO]. Using the LOO scheme, the CLD and CHO had similar performance for large ensembles. However, the CLD outperformed the CHO and gave more accurate rankings for smaller ensembles. As the ensemble size decreased, the performance of the [CHO, LOO] combination seriously deteriorated as opposed to the [CLD, LOO] combination. Thus, it might be desirable to use the CLD with the LOO scheme when smaller ensemble size is available.


Figures

Fig. 1
Fig. 1
Noise-free short-axis images with the image on the left represents the defect-absent case and on the right represents the defect-present case. The arrow points to the defect, where the defect shown has severity of 100% for visualization purpose.
Fig.2
Fig.2
Images of the six rotationally symmetric frequency-domain channels (left) and the corresponding spatial-domain templates (right).
Fig. 3
Fig. 3
AUC values obtained for different combinations of observers and resampling schemes as functions of ensemble size (i.e., number of samples/class). The AUC plots represent the mean of 1000 bootstrap repetitions using the F-MPS ensemble.
Fig. 4
Fig. 4
The estimated mean AUC values as functions of the cut-off frequency of the post-reconstruction filter using the F-MPS ensemble. The plots are for the different six combinations of observers and resampling schemes using various ensemble sizes.
Fig. 5
Fig. 5
The MSE of the estimated AUC values using the F-MPS ensemble as functions of the ensemble size for a cut-off of 0.14 cycle/pixel.
Fig. 6
Fig. 6
The MSE of the estimated AUC values using the F-MPS ensemble as functions of the cut-off frequency for an ensemble size of 20 samples/class.
Fig. 7
Fig. 7
The Spearman’s rank correlation coefficients of the AUCs as functions of the ensemble size using the F-MPS ensemble. The plots represent the mean of the 1000 bootstrap repetitions. The standard error was approximately in the order of 10−4 to 10−2 and is thus not displayed.
Fig. 8
Fig. 8
The estimated mean AUC values as functions of the cut-off frequency of the post-reconstruction filter using the F-MVNEQ ensemble. The plots are for the different six combinations of observers and resampling schemes using various ensemble sizes.
Fig. 9
Fig. 9
The MSE of the estimated AUC values using the F-MVNEQ ensemble as functions of the ensemble size for a cut-off of 0.14 cycle/pixel.
Fig. 10
Fig. 10
The MSE of the estimated AUC values using the F-MVNEQ ensemble as functions of the cut-off frequency for an ensemble size of 20 samples/class.
Fig. 11
Fig. 11
The Spearman’s rank correlation coefficients of the AUCs as functions of the ensemble size using the F-MVNEQ ensemble. The plots represent the mean of the 1000 bootstrap repetitions. The standard error was approximately in the order of 10−4 to 10−2 and is thus not displayed.
Fig. 12
Fig. 12
The estimated mean AUC values as functions of the cut-off frequency of the post-reconstruction filter using the F-MVNUNEQ ensemble. The plots are for the different six combinations of observers and resampling schemes using various ensemble sizes.
Fig. 13
Fig. 13
The MSE of the estimated AUC values using the F-MVNUNEQ ensemble as functions of the ensemble size for a cut-off of 0.14 cycle/pixel.
Fig. 14
Fig. 14
The MSE of the estimated AUC values using the F-MVNUNEQ ensemble as functions of the cut-off frequency for an ensemble size of 20 samples/class.
Fig. 15
Fig. 15
The Spearman’s rank correlation coefficients of the AUCs as functions of the ensemble size using the F-MVNUNEQ ensemble. The plots represent the mean of the 1000 bootstrap repetitions. The standard error was approximately in the order of 10−4 to 10−2 and is thus not displayed.
Fig. 16
Fig. 16
The RMSD of the estimated test statistics using the F-MPS ensemble. Note that the vertical scale is smaller by a factor of 25 for the CLD compared to the CHO.
Fig. 17
Fig. 17
Images of the covariance matrices for the defect-absent (left column) and the defect-present (middle column) classes, and images of the absolute difference between the covariance matrices (right column).
Fig. 18
Fig. 18
Histograms of the test statistics of the CHO and the CLD using both resampling schemes for the F-MPS ensemble using 100 samples/class.

References

    1. Barrett HH, Myers KJ. Foudations of Image Science. New York: Wiley; 2004.
    1. Barrett HH, Yao J, Rolland JP, Myers KJ. Model observers for assessment of image quality. Proc. Natl. Acad. Sci. USA. 1993;90:9758–9765. - PMC - PubMed
    1. Brankov JG. Evaluation of the channelized Hotelling observer with an internal-noise model in a train-test paradigm for cardiac SPECT defect detection. J. Phys. Med. Biol. 2013;58:7159–82. - PMC - PubMed
    1. Chan HP, Sahiner B, Wagner RF, Petrick N. Classifier design for computer-aided diagnosis: effects of finite sample size on the mean performance of classical and neural network classifiers. Med Phys. 1999;26:2654–68. - PubMed
    1. Daniel WW. Applied nonparametric statistics. Cengage Learning; 1990.

Publication types