. 2017 Aug 21;42(4):416-434.e11.
doi: 10.1016/j.devcel.2017.07.024.

A Single-Cell Biochemistry Approach Reveals PAR Complex Dynamics during Cell Polarization

Affiliations

A Single-Cell Biochemistry Approach Reveals PAR Complex Dynamics during Cell Polarization

Daniel J Dickinson et al. Dev Cell. .

Abstract

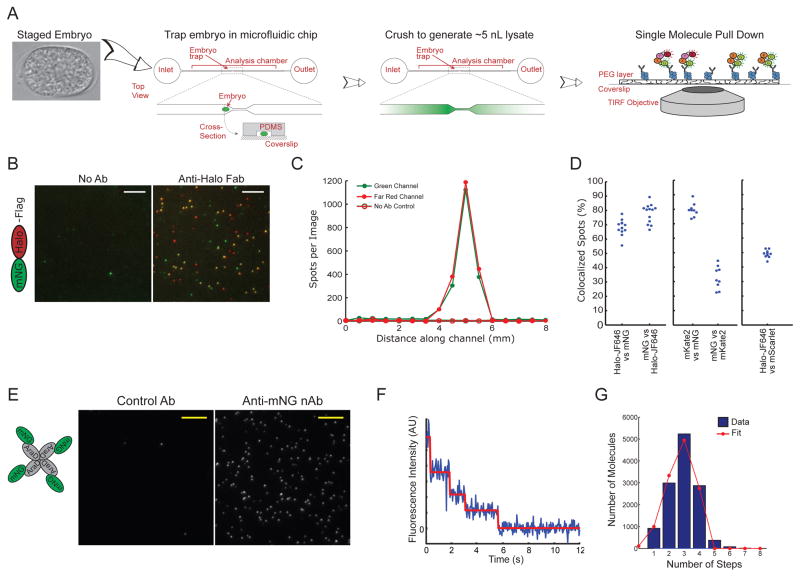
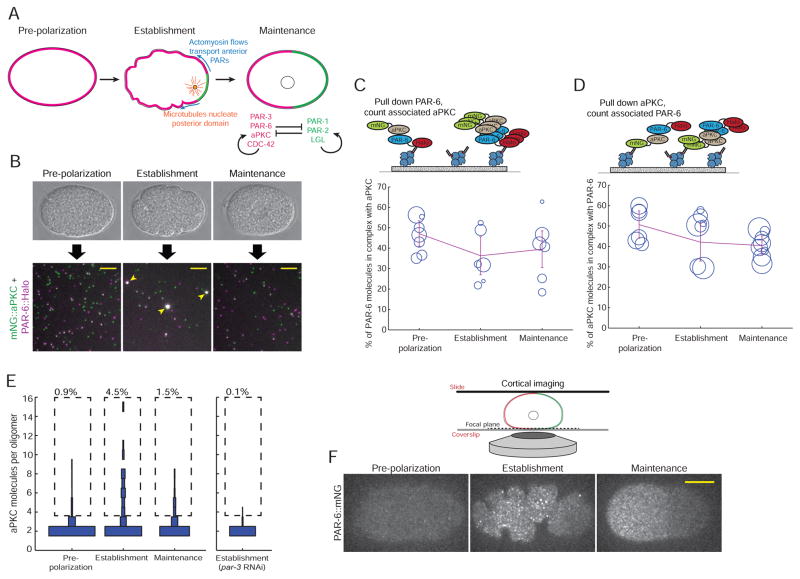
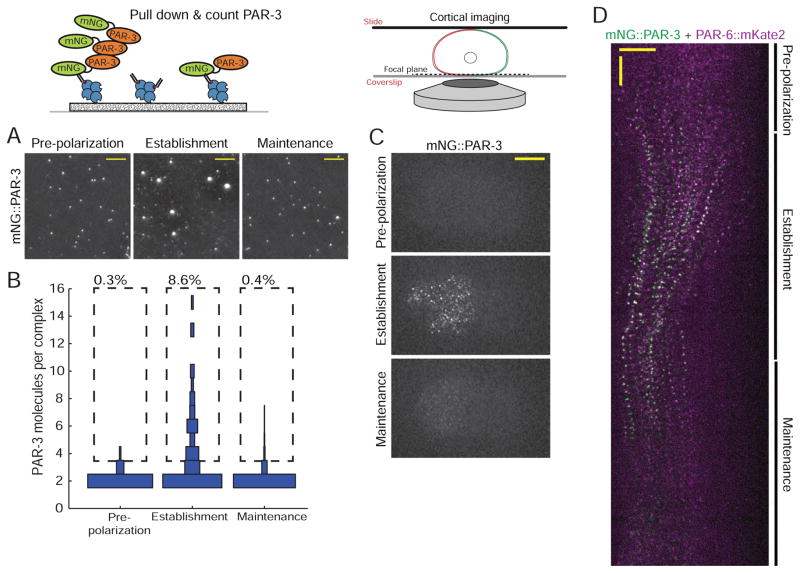
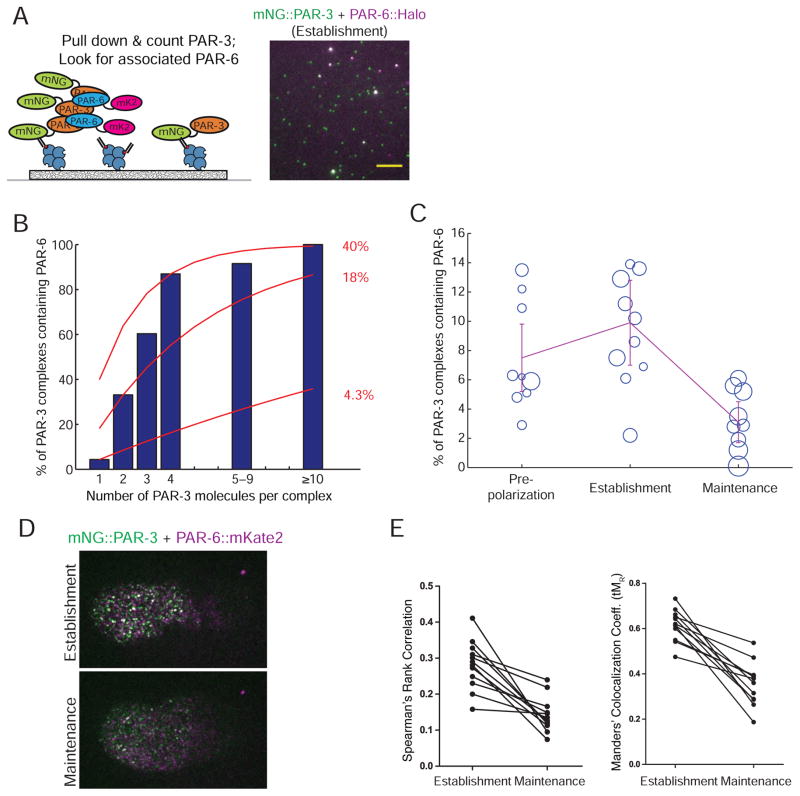
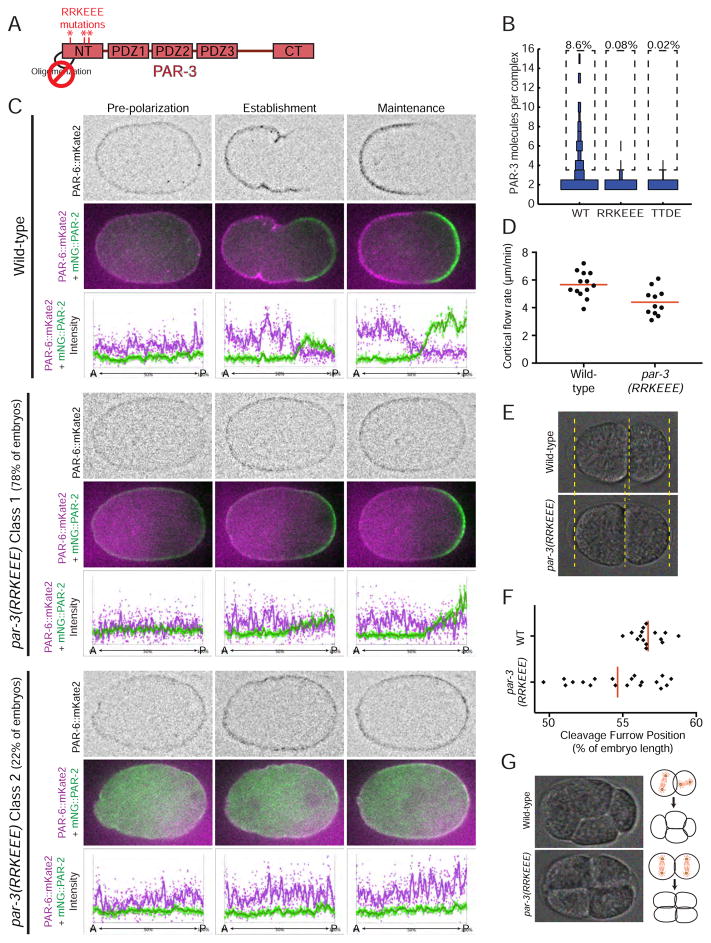
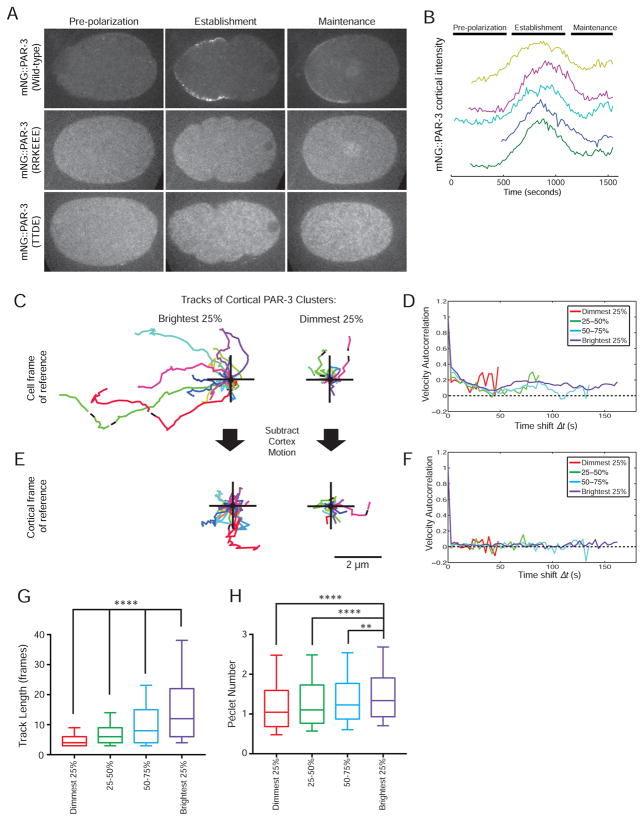
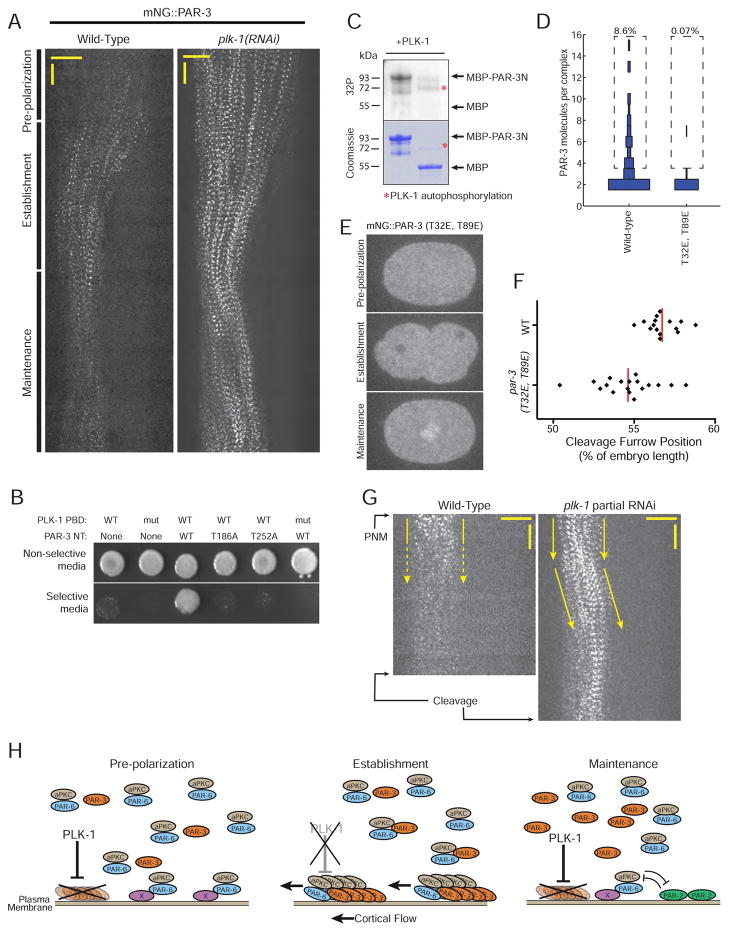
Regulated protein-protein interactions are critical for cell signaling, differentiation, and development. For the study of dynamic regulation of protein interactions in vivo, there is a need for techniques that can yield time-resolved information and probe multiple protein binding partners simultaneously, using small amounts of starting material. Here we describe a single-cell protein interaction assay. Single-cell lysates are generated at defined time points and analyzed using single-molecule pull-down, yielding information about dynamic protein complex regulation in vivo. We established the utility of this approach by studying PAR polarity proteins, which mediate polarization of many animal cell types. We uncovered striking regulation of PAR complex composition and stoichiometry during Caenorhabditis elegans zygote polarization, which takes place in less than 20 min. PAR complex dynamics are linked to the cell cycle by Polo-like kinase 1 and govern the movement of PAR proteins to establish polarity. Our results demonstrate an approach to study dynamic biochemical events in vivo.

Keywords: C. elegans; PAR proteins; PAR-3; PLK-1; SiMPull; cell polarity; cortical flow; sc-SiMPull; single-cell biochemistry.


Figures

Figure 1
Figure 1. A single-cell biochemistry assay for the C. elegans zygote
A) Illustration of the approach. A C. elegans embryo, staged based on morphology, is placed into a flow chamber and trapped in the center by a small constriction. The embryo is crushed to generate a lysate, and proteins of interest are captured using antibodies bound to the coverglass floor of the chamber. The device is placed directly on a TIRF microscope to interrogate molecular complexes via single-molecule imaging. B) Images of mNG::HaloTag molecules pulled down from a single embryo labeled with JF646 HaloTag ligand. The mNG channel is shown in green and the JF646 (far red) channel is shown in red. Scale bars represent 5 μm. C) Quantification of the number of green and far-red spots per image as a function of position along the length of the chamber. D) Quantification of the fraction of colocalized spots for an mNG::HaloTag fusion protein labeled with JF646 (left graph), an mNG::mKate2 fusion protein (center graph) or an mScarlet-I::HaloTag fusion protein labeled with JF646 (right graph). E) Images of mNG::AraD tetramers pulled down from a single embryo. Scale bars represent 5 μm. F) Example of a photobleaching trace from a single mNG::AraD complex, showing four photobleaching steps. G) Blue bars: histogram showing the distribution of photobleaching step counts in a population of molecules (data from four single-embryo experiments are combined). Red line: fit of the data to the binomial distribution PN=4!N!(4-N)!dN(1-d)4-N, where PN is the probability of detecting N photobleaching steps given the fraction d of mNG molecules detected in this assay. See also Figures S1, S2 and S3.
Figure 2
Figure 2. aPKC and PAR-6 are constitutively associated but dynamically oligomerize
A) Illustration of the events that lead to zygote polarization. See text for a detailed description. B) Schematic of a SiMPull experiment to analyze the PAR-6/aPKC interaction. Individual embryos were staged based on morphology, and endogenously tagged PAR-6::HaloTag was pulled down. The single-molecule images shown are actual data from pull-downs at the indicated stages. Scale bars represent 5 μm. Note that the oligomeric complexes (arrowheads) are not macroscopic; they are diffraction-limited objects, but appear larger because the images were scaled so that monomers would be visible. C, D) Measurements of the fraction of PAR-6 molecules in complex with aPKC (C) or the fraction of aPKC molecules in complex with PAR-6 (D) at the indicated stages. Each circle in the plots shows the result of one single-cell experiment, with the size of the circle representing the number of molecules that were counted in that experiment. The lines show the weighted mean, and error bars represent 95% confidence intervals. E) Measurement of the fraction of PAR-6/aPKC heterodimers found in oligomers of different sizes. The experiment was conducted by pulling down PAR-6::HaloTag and counting the number of co-precipitated mNG::aPKC molecules in each complex. For each stage, the distribution of numbers of molecules found in oligomers of different sizes is shown as a vertical histogram. For clarity, the monomer fraction (80–90% of total molecules) is not shown. n = 10,138 molecules counted from 7 embryos for pre-polarization phase, n = 5,698 molecules counted from 6 embryos for establishment phase, n = 5,550 molecules counted from 6 embryos for maintenance phase and n = 6,944 molecules counted from 7 embryos for establishment embryos derived from mothers treated with par-3 RNAi. F) Images of cortical PAR-6::mNG in live embryos at the indicated stages. Anterior is to the left. Scale bar represents 10 μm.
Figure 3
Figure 3. PAR-3 forms large oligomers during polarity establishment
A) Images of mNG::PAR-3 pulled down from embryos of the indicated stages. Scale bars represent 5 μm. B) Measurement of the abundance of mNG::PAR-3 oligomers of different sizes as a function of embryonic stage. For each stage, the distribution of numbers of molecules found in oligomers of different sizes is shown as a vertical histogram. For clarity, the monomer fraction (80–90% of total molecules) is not shown. n = 5,914 molecules counted from 7 embryos for pre-polarization phase, n = 4,741 molecules counted from 9 embryos for establishment phase and n = 17,201 molecules counted from 9 embryos for maintenance phase. C) Images of cortical mNG:PAR-3 in live embryos at the indicated stages. Anterior is to the left. Scale bar represents 10 μm. D) Kymograph of cortical mNG::PAR-3 (green) and PAR-6::mKate2 (magenta) during the first cell cycle. Anterior is to the left. Horizontal scale bar represents 10 μm and vertical scale bar represents 1 min.
Figure 4
Figure 4. PAR-3 oligomerization and PAR complex assembly occur in concert
A) Image of mNG::PAR-3 (green) and PAR-6::HaloTag (magenta) pulled down from an establishment-phase embryo using an anti-mNG nanobody. Note that the bright mNG::PAR-3 spots (oligomers) colocalize with PAR-6::HaloTag, but the dimmer mNG::PAR-3 spots (monomers) do not. Scale bar represents 5 μm. B) Blue bars: Fraction of PAR-3 oligomers of different sizes that were found associated with PAR-6::HaloTag. Red curves: predicted results from a simple model in which all PAR-3 monomers have an equal probability of being bound to PAR-6, regardless of whether they are part of a larger oligomer. The numbers at right show the bound fraction used to calculate each curve. C) Measurements of the fraction of PAR-3 molecules in complex with PAR-6 at the indicated stages. Each circle in the plots shows the result of one single-cell experiment, with the size of the circle representing the number of molecules that were counted in that experiment. The line shows the weighted mean, and error bars represent 95% confidence intervals. D) Images of cortical mNG::PAR-3 (green) and PAR-6::mKate2 (magenta) in establishment and maintenance phases. E) Quantification of the extent of colocalization between PAR-6::mKate2 and mNG::PAR-3 using two different colocalization metrics. Each pair of data points from the same embryo is connected by a line.
Figure 5
Figure 5. PAR-3 oligomerization is essential for proper polarity establishment
A) PAR-3 domain structure illustrating the location of RRKEEE point mutations that were introduced into endogenous PAR-3 to block oligomerization. B) Distribution of oligomer sizes for PAR-3 WT, RRKEEE and TTDE during establishment phase. The WT data from Figure 3B are presented again here to facilitate comparison. n = 4,741 molecules counted from 9 embryos for WT, n = 11,843 molecules counted from 10 embryos for RRKEEE and n = 18,401 molecules counted from 8 embryos for TTDE. C) Localization of endogenously-tagged PAR-6::mKate2 and mNG::PAR-2 in wild-type and par-3(RRKEEE) zygotes. For each example, the top row shows PAR-6::mKate2 localization in inverted contrast; the middle row shows PAR-6::mKate2 (magenta) and mNG::PAR-2 (green); and the bottom row shows measurements of fluorescence intensity as a function embryo length. D) Cortical flow rates measured during establishment phase in wild-type and par-3(RRKEEE) zygotes. The wild-type rate is similar to previous reports (Cheeks et al., 2004; Hird and White, 1993). E) Example of the shift in cleavage furrow position toward the center of the cell in a par-3(RRKEEE) embryo. These two examples were chosen because they had cleavage furrow positions as close as possible to the mean of each population. F) Quantification of cleavage furrow position in wild-type and par-3(RRKEEE) zygotes. G) Example of cell mis-positioning at the 4-cell stage in the par-3(RRKEEE) mutant. 36% (9/25) of par-3(RRKEEE) mutants showed this phenotype; the remaining embryos had normal cell positioning at the 4-cell stage. See also Figures S4 and S5 and Table S1.
Figure 6
Figure 6. PAR-3 oligomerization facilitates polarity establishment by coupling PAR-3 to cortical flows
A) Localization of mNG::PAR-3, mNG::PAR-3(RRKEEE) and mNG::PAR-3(TTDE) at the indicated embryonic stages. B) Quantification of the total amount of cortical mNG::PAR-3 fluorescence in wild-type embryos as a function of time. Each curve is a measurement from a single embryo. The curves were aligned in time based on cytokinesis onset and were offset in the Y direction for better visibility. C) Tracks of cortical PAR-3 clusters from among the brightest 25% or dimmest 25% of all particles tracked. For each panel, 25 tracks were selected at random from the total pool of 468 tracks and superimposed with the origin indicated by the cross. Anterior is to the left. D) Velocity autocorrelation as a function of time step (Δt) for PAR-3 particles of different intensity. Vcorr > 0 indicates directed motion. E) The same 25 PAR-3 tracks as in (C), after transformation to a cortical frame of reference by subtracting cortical flow (see text for a detailed explanation). F) Velocity autocorrelation as a function of time for PAR-3 particles in the cortical frame of reference. G) Distributions of track lengths for four populations of cortical PAR-3 particles binned based on intensity, and H) Distributions of the Péclet number (the ratio of advective to diffusive transport rates) for PAR-3 particles of different intensities. For each plot, the whiskers show the 10th and 90th percentiles, and the center line shows the median. n = 4,256 particles tracked from 3 embryos. ** indicates p < 0.01 and **** indicates p < 0.0001 (Kruksal-Wallis test with Dunn’s post-test). See also Figures S4 and S6.
Figure 7
Figure 7. PAR-3 oligomerization is negatively regulated by PLK-1
A) Kymographs of cortical mNG::PAR-3 in wild-type and plk-1(RNAi) embryos. Anterior is to the left. Horizontal scale bar represents 10 μm and vertical scale bar represents 1 min. B) Yeast two hybrid assays examining the interaction between PAR-3N (amino acids 1–394) and the PBD of PLK-1. Colonies transformed with the indicated plasmids were grown on non-selective or selective medium. Growth on selective medium indicates an interaction. C) Autoradiograph (top) and comassie stained gel (bottom) showing phosphorylation of PAR-3N by PLK-1. The red asterisks at around 72 kDa indicate PLK-1 autophosphorylation in the autioradiograph and PLK-1 loading in the Comassie stained gel. D) Distribution of oligomer sizes for PAR-3 WT and T32E, T89E during establishment phase. The WT data from Figure 3B are presented again here to facilitate comparison. n = 4,741 molecules counted from 9 embryos for WT and n = 9,658 molecules counted from 4 embryos for T32E, T89E. E) Localization of mNG::PAR-3(T32E, T89E) at the indicated embryonic stages. F) Quantification of cleavage furrow position in wild-type and the par-3(T32E, T89E) mutant. The wild-type data from Figure 5E are presented again here to facilitate comparison. G) Kymographs of cortical mNG::PAR-3 during maintenance phase in a wild-type embryo and an embryo partially depleted of PLK-1 using feeding RNAi. Anterior is to the left. Horizontal scale bar represents 10 μm and vertical scale bar represents 1 min. The timing of cellular events that define the beginning and end of maintenance phase are labeled; PNM, pronuclear meeting. Note that maintenance phase is slightly longer after treatment with plk-1 RNAi, most likely because depletion of PLK-1 results in a cell cycle delay. H) Model for regulation of polarity establishment by PAR-3 oligomerization. PAR-3 oligomers recruit PAR-6 and aPKC during polarity establishment, forming functional units that couple to cortical flow and are transported to the anterior to establish polarity. By negatively regulating PAR-3 oligomerization, PLK-1 links PAR-3 oligomerization to the cell cycle and restricts PAR complex transport to the correct developmental time. See also Figures S4, S5 and S7.

Comment in

References

    1. Aceto D, Beers M, Kemphues KJ. Interaction of PAR-6 with CDC-42 is required for maintenance but not establishment of PAR asymmetry in C. elegans. Developmental Biology. 2006;299:386–397. - PMC - PubMed
    1. Altschuler SJ, Wu LF. Cellular Heterogeneity: Do Differences Make a Difference? Cell. 2010;141:559–563. - PMC - PubMed
    1. Assémat E, Bazellières E, Pallesi-Pocachard E, Le Bivic A, Massey-Harroche D. Polarity complex proteins. Biochim Biophys Acta. 2008;1778:614–630. - PubMed
    1. Beers M, Kemphues K. Depletion of the co-chaperone CDC-37 reveals two modes of PAR-6 cortical association in C. elegans embryos. Development. 2006;133:3745–3754. - PubMed
    1. Benton R, St Johnston D. A conserved oligomerization domain in drosophila Bazooka/PAR-3 is important for apical localization and epithelial polarity. Curr Biol. 2003a;13:1330–1334. - PubMed

MeSH terms

Substances