. 2017 Sep;19(9):716-733.
doi: 10.1016/j.neo.2017.07.001. Epub 2017 Aug 19.

Humanization of JAA-F11, a Highly Specific Anti-Thomsen-Friedenreich Pancarcinoma Antibody and InVitro Efficacy Analysis

Affiliations

Humanization of JAA-F11, a Highly Specific Anti-Thomsen-Friedenreich Pancarcinoma Antibody and InVitro Efficacy Analysis

Swetha Tati et al. Neoplasia. 2017 Sep.

Erratum in

Abstract

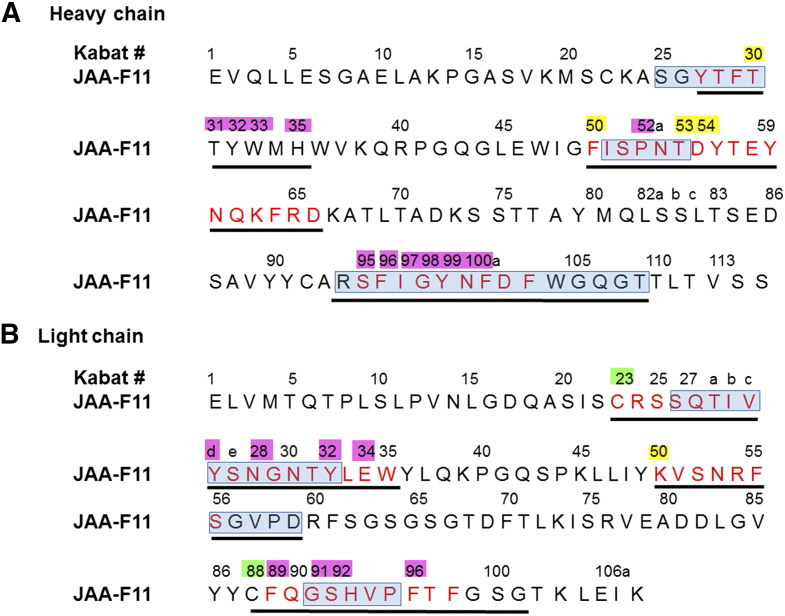
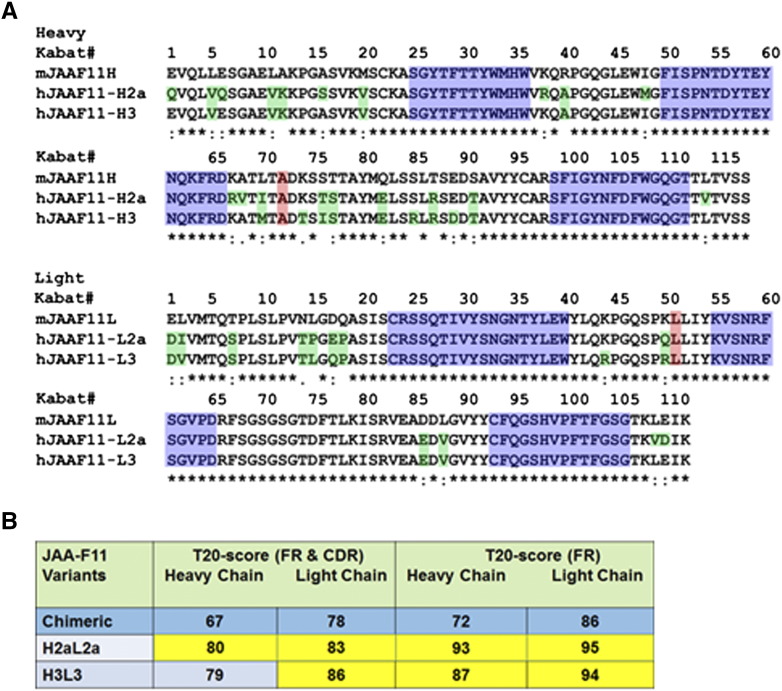
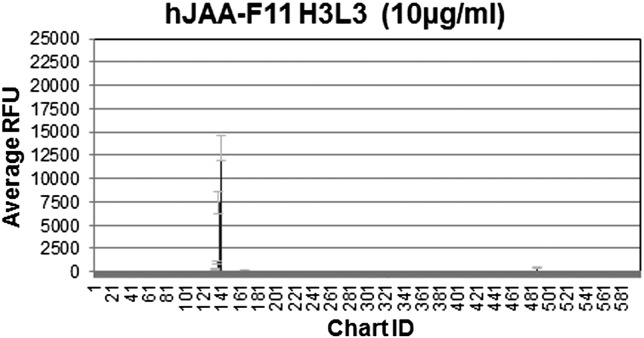
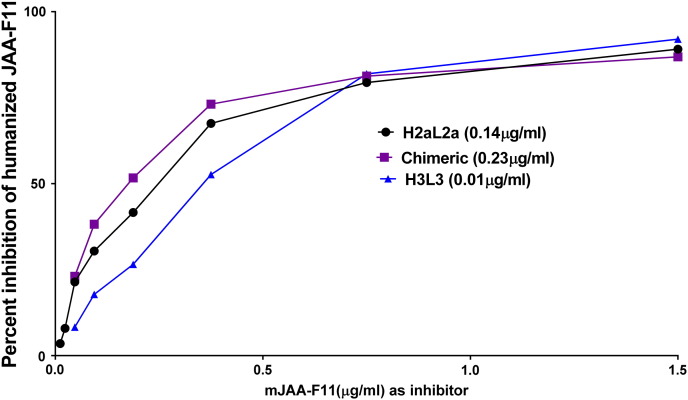
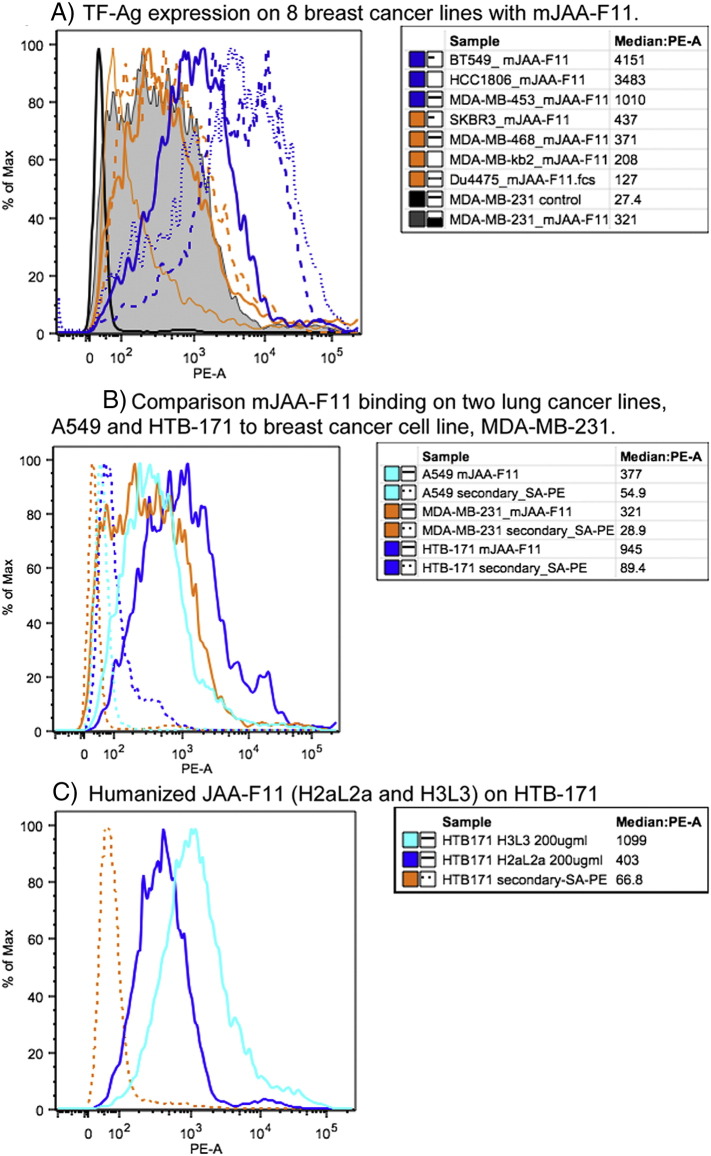
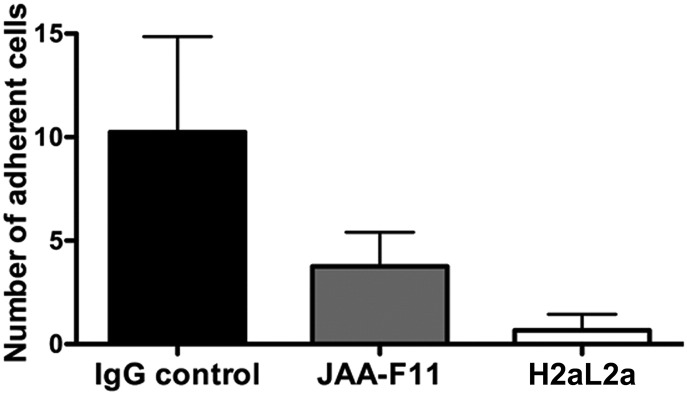
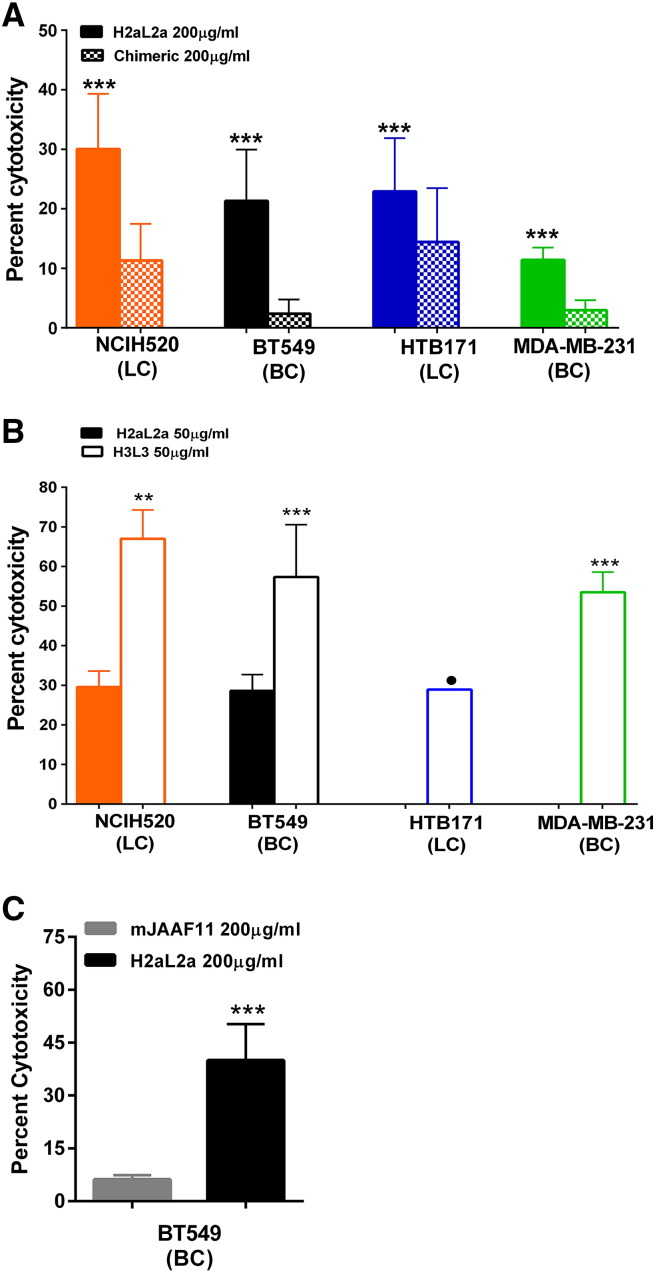
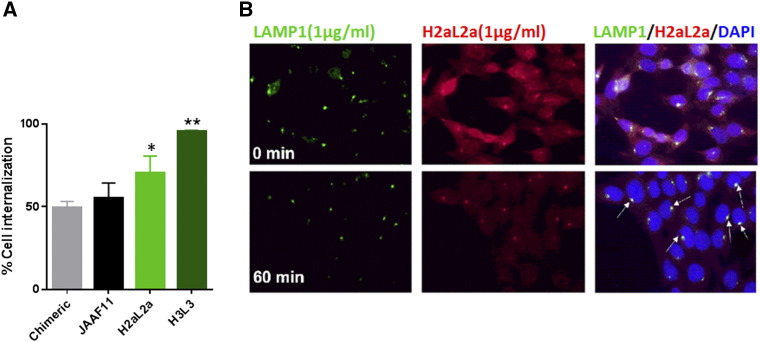
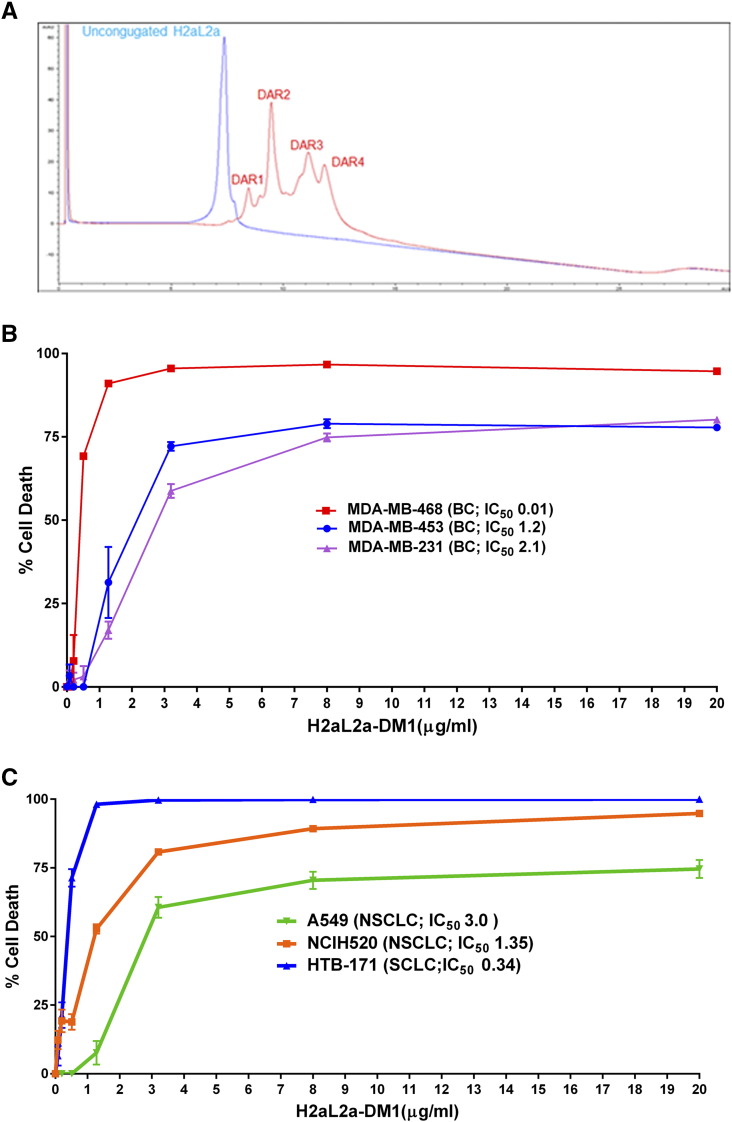
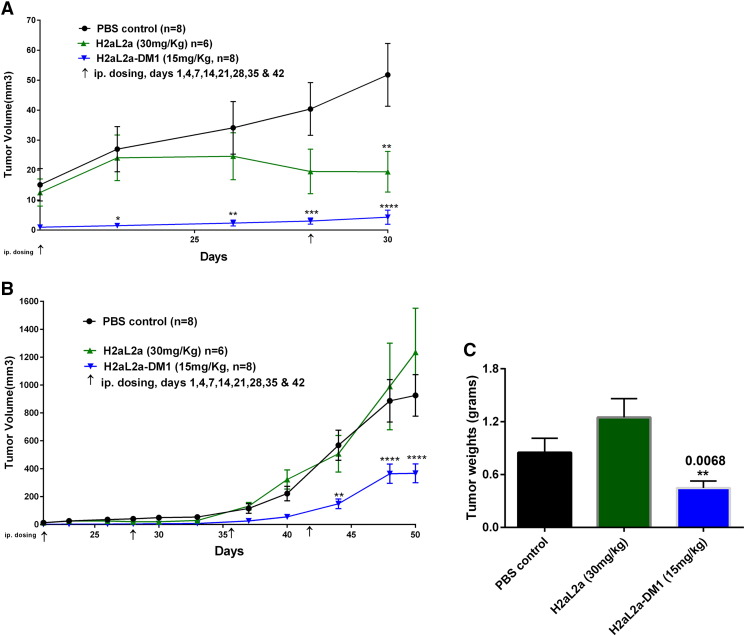
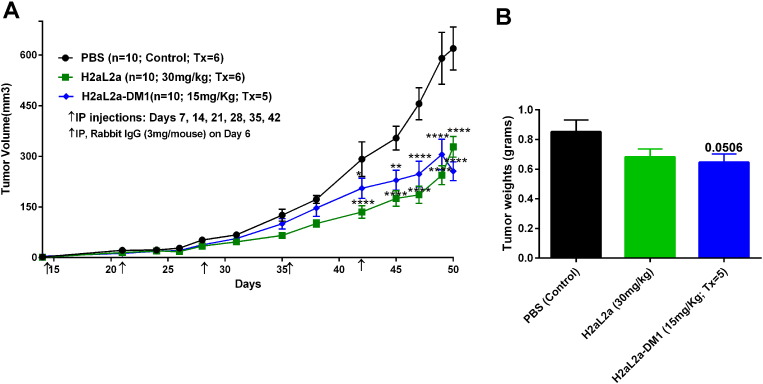
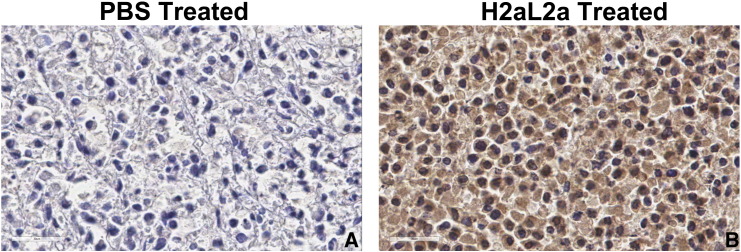
JAA-F11 is a highly specific mouse monoclonal to the Thomsen-Friedenreich Antigen (TF-Ag) which is an alpha-O-linked disaccharide antigen on the surface of ~80% of human carcinomas, including breast, lung, colon, bladder, ovarian, and prostate cancers, and is cryptic on normal cells. JAA-F11 has potential, when humanized, for cancer immunotherapy for multiple cancer types. Humanization of JAA-F11, was performed utilizing complementarity determining regions grafting on a homology framework. The objective herein is to test the specificity, affinity and biology efficacy of the humanized JAA-F11 (hJAA-F11). Using a 609 target glycan array, 2 hJAA-F11 constructs were shown to have excellent chemical specificity, binding only to TF-Ag alpha-linked structures and not to TF-Ag beta-linked structures. The relative affinity of these hJAA-F11 constructs for TF-Ag was improved over the mouse antibody, while T20 scoring predicted low clinical immunogenicity. The hJAA-F11 constructs produced antibody-dependent cellular cytotoxicity in breast and lung tumor lines shown to express TF-Ag by flow cytometry. Internalization of hJAA-F11 into cancer cells was also shown using a surface binding ELISA and confirmed by immunofluorescence microscopy. Both the naked hJAA-F11 and a maytansine-conjugated antibody (hJAA-F11-DM1) suppressed in vivo tumor progression in a human breast cancer xenograft model in SCID mice. Together, our results support the conclusion that the humanized antibody to the TF-Ag has potential as an adjunct therapy, either directly or as part of an antibody drug conjugate, to treat breast cancer, including triple negative breast cancer which currently has no targeted therapy, as well as lung cancer.


Figures

Figure 1
Figure 1
Final CDRs for JAA-F11 heavy and light chain variable regions. Final CDRs as determined by Kabat (sequence) in red, Chothia (structure) in blue boxes, amino acids 5 Å from binding site (pink) or 6 Å from binding site (yellow). Black underlined = CDRs selected for humanization. In addition cysteine at position L23 and L88 (green) were maintained. (A) Heavy chain. (B) Light chain. Numbering is according to Kabat. Letters a, b, c, refers to insertions.
Figure 2
Figure 2
Amino acid sequence alignments of mouse (mJAA-F11) with humanized H2aL2a and H3L3 antibody and immunogenicity assessment of the H2aL2a and H3L3. A) Amino acid sequence alignments of mJAA-F11 heavy (top) and light (bottom) chain variable regions with variable regions of H2aL2a and H3L3 constructs. Green indicates the differences among the humanized antibodies and mJAA-F11. Alanine at position 71 (top) and Leucine at position 46 (bottom) shaded pink, indicate mouse residues that were retained to avoid steric clashes. The CDRs are shaded blue. Numbering is according to Kabat. B) Assessment of immunogenicity of the H2aL2a and H3L3 constructs by using the scoring system developed by Gao et al. . T20 score is used to measure “humanness” of monoclonal antibody variable region sequences; T20 score> 80 for FR and CDR sequences is not immunogenic in humans; T20 score> 85 for FR sequences only is not immunogenic in humans (see main text for details). The closer the number is to these cut-offs the less immunogenic the antibody. FR = framework; CDR = complementarity determining region.
Figure 3
Figure 3
Binding of H3L3, H2aL2a and chimeric antibodies on a CFG glycan array. The arrays contained 440 glycans (mouse) and 601–610 glycans (chimeric and humanized). Sample RFU vs. glycan binding is shown for H3L3 since these graphs are so similar. Only TF-Ag and 3 or 4 related saccharides bound to the antibodies, and these are not seen in normal human tissue.
Figure 4
Figure 4
The humanized H3L3 has a higher affinity than H2aL2a antibody which has a higher affinity than chimeric antibody to TF-Ag-BSA. A) Graph shows relative affinity of H2aL2a and chimeric antibodies to TF-Ag as determined by ELISA. Each antibody was mixed with serial dilutions of mJAA-F11 and binding to the TF-Ag coated plate was measured by using a species-specific alkaline phosphatase anti-human IgG antibody. The amount of mJAA-F11 antibody required to inhibit 1 μg of each tested antibody (H3L3, H2aL2a, and chimeric antibodies) to 50% was extrapolated and is depicted in the table (B). The higher the amount of mouse antibody required for inhibition, the higher the relative affinity of the antibody. ANOVA analysis was performed on the relative affinity (IC50) values obtained for each antibody tested (as described above) and binding of H3L3 was significant at P < .001 (****). Humanized and chimeric antibodies used at a concentration which would yield an O.D. of 1.00 in the EIA when not inhibited. H3L3 used at ~10 times the H2aL2a concentration and ~15 times the chimeric concentration.
Figure 5
Figure 5
Flow cytometric analysis of TF-Ag Expression on Human Cancer cells. Flow histograms showing A) Relative TF-Ag expression levels on eight breast cancer cell lines BT549, HCC-1806, MDA-MB-453, SKBR-3, MDA-MB-468, MDA-MB-231, MDA-MB-kb2 and Du4475 detected with mJAA-F11 using rat anti-mouse IgG3-biotin/Streptavidin-PE. Solid black line is used to show the relative background with secondary antibody alone for MDA-MB-231. B) Relative TF-Ag expression levels on the breast line MDA-MB-231 compared to the lung cancer cell lines A549 and HTB-171, detected with mJAA-F11 using rat anti-mouse IgG3-biotin/Streptavidin-PE and C) binding of hJAA-F11 constructs H2aL2a and H3L3 to HTB-171 detected with Goat-anti-human IgG-biotin/Streptavidin-PE. Solid lines binding of JAA-F11 or hJAA-F11 antibody; dashed lines background binding with detection system only.
Figure 6
Figure 6
Anti-metastatic effect of mouse JAA-F11 and hJAA-F11 in an in vitro model. Graph comparing humanized JAA-F11 H2aL2a, and JAA-F11 effect on adhesion of MDA-MB-231 to primary pulmonary microvascular cells. ANOVA analysis differences are highly significant (P < .0001). Adherent cells are those that stay attached to the microvascular cells for at least 30 seconds.
Figure 7
Figure 7
ADCC activity versus TF-Ag positive breast and lung cancer cell lines by 7a) H2aL2a and chimeric antibodies at 200 μg/ml, and 7b) H3L3 and H2aL2a Ab at 50 μg/ml. A) 200 μg/ml of the H2aL2a and chimeric were used in ADCC assays against several human cancer cell lines. BC indicates a breast cancer line, while LC indicates a lung cancer line. H2aLa was most effective in ADCC against NCI-H520, then in decreasing amounts towards BT549, HTB-171, and MDA-MB-231, and the chimeric antibody showed little ADCC even at this 200 μg/ml concentration (P < .05) B) 50 μg/ml of either H2aL2a or H3L3 were used in ADCC assays against several human cancer cell lines. C) 200 μg/ml concentrations of either H2aL2a were added to BT549 cells. The mouse JAA-F11, effectively a negative control antibody did not show appreciable ADCC even at 200 μg/ml with the BT549 cells. In the HTB-171 and MDA-MB-231 cell lines with H2aL2a, there was no appreciable ADCC activity above background and was not graphed. • indicates significance differences in one representative experiment. ** indicates significance in two of three independent experiments. *** indicates significance across all three independent experiments.
Figure 8
Figure 8
Internalization of H3L3 and H2aL2a antibodies in 4 T1 and MDA-MB-231 cells. A) Internalization by EIA detection of antibody surface binding following incubation of cells with antibody at 4°C (no internalization) and 37°C degrees (to induce internalization). All antibodies displayed internalization, where H2aL2a displayed significantly more internalization than chimeric (*, P < .05) and H3L3 showing significantly more internalization compared to all antibodies (**, P < .05). Bars represent mean ± S.E. (n = 3 experiments). B) Representative images showing immunofluorescent staining of Ab H2aL2a and the lysosomal protein marker, LAMP-1 (green). Top panels MDA-MB-231 cells were pre-incubated with antibody (1ug/mL) for 20 min at 4°C. Lower panels after at 37°C for 60 min. Merged images confirm internalization of H2aL2a and lysosomal co-localization with LAMP-1 in merged images (arrows). Total magnification was 40×.
Figure 9
Figure 9
Characterization of Maytansine (DM1) Conjugate of H2aL2a. A) H2aL2a-DM1 conjugate production. HIC-HPLC Chromatogram of H2aL2a Ab and H2aL2a-DM1 conjugate at A280. B) In vitro cell efficacy against human breast cancer (BC) cell lines using H2aL2a-DM1. C) In vitro efficacy against human lung cancer cell lines using H2aL2a-DM1. NSCLC is a non-small cell lung cancer and SCLC is a small cell lung cancer. B) & C) DM1 conjugated H2aL2a antibody showed enhanced anti proliferative activity on TF-Ag positive breast and lung cancer cell lines. All experiments were carried out to Day 5 of treatment and cell viability detected using a Cell-Glo reagent. (IC50 values, μg/mL H2aL2a-DM1).
Figure 10
Figure 10
In vivo efficacy of H2aL2a and H2aL2a conjugated DM1 in breast tumor model treatment beginning 24 hours after tumor implantation. A) 1 × 10⁷ MDA-MB- 231 cells were injected into female SCID mice intra-mammary gland on day 0. Antibody treatment began on day 1 and animals were given i.p. injection of PBS, naked H2aL2a (30 mg/kg), or H2aL2a-DM1 (15 mg/kg). Arrows indicate injection days. n = mice per group. Tumor growth was monitored for 50 days using caliper. A shows the first 30 days of treatment, B is the full 50 day experiment. Two-way ANOVA Analysis of PBS versus H2aL2a-DM1 *P = .05, **P = .01, ****P < .001. C) Bar graphs representing the mean tumor weights ± S.E in the control and antibody treatment groups of tumors removed at day 50. * Unpaired t test was used to analyze the PBS control versus H2aL2a-DM1.
Figure 11
Figure 11
In vivo efficacy of H2aL2a and H2aL2a conjugated DM1 in breast tumor model treatment with antibody treatment beginning at day seven after tumor implantation. A) 1 × 10⁷ MDA-MB-231 cells were injected into female SCID mice intra-mammary gland on day 0. Antibody treatment began on day 7 and animals were given i.p. injection of PBS, H2aL2a (30 mg/kg), or H2aL2a-DM1 (15 mg/kg). Mice were injected once a week for 6 weeks. Arrows indicate injection days. n = 10 mice per group. Tumor growth was monitored for 50 days. ANOVA Analysis of PBS versus H2aL2a-DM1, PBS versus 30 mg/kg H2aL2a (*P = .05, **P = .01, ****P < .001). B) Bar graphs representing the mean tumor weights ± S.E in the control and antibody treatment groups of tumors removed at day 50. * Unpaired t test was used to analyze the PBS control versus H2aL2a-DM1. Treatment groups were approaching significance when tumor weights were compared.
Figure 12
Figure 12
Immunohistochemistry to show tumor localization of H2aL2a after treatment of tumor bearing mice. The tumors from mice in the treatment study shown in Figure 11, injected with either PBS (A) or H2aL2a (B) were fixed, embedded and sectioned and stained using immunohistochemistry for the presence of human IgG in the tumor using anti-human secondary antibody. This shows the presence of H2aL2a binding to the tumor, while PBS indicates minimal background staining alone.

Similar articles

Cited by

References

    1. Springer GF. T and Tn, general carcinoma autoantigens. Science. 1984;224(4654):1198–1206. - PubMed
    1. Springer GF, Murthy MS, Desai PR, Scanlon EF. Breast cancer patient's cell-mediated immune response to Thomsen-Friedenreich (T) antigen. Cancer. 1980;45:2949–2954. - PubMed
    1. Wolf M, Ludwig A, Fritz P, Schumacher K. Increased expression of Thomsen-Friedenreich antigens during tumor progression in breast cancer patients. Tumor Biol. 1988;9(4):190–194. - PubMed
    1. Takanami I. Expression of Thomsen-Friedenreich antigen as a marker of poor prognosis in pulmonary adenocarcinoma. Oncol Rep. 1999;6(2):341–345. - PubMed
    1. Cao Y, Karsten UR, Liebrich W, Haensch W, Springer GF, Schlag PM. Expression of thomsen-friedenreich-related antigens in primary and metastatic colorectal carcinomas. A reevaluation. Cancer. 1995;76(10):1700–1708. - PubMed