Review
. 2016 Dec 1;214(suppl_4):S421-S426.
doi: 10.1093/infdis/jiw356.

Elucidating Transmission Patterns From Internet Reports: Ebola and Middle East Respiratory Syndrome as Case Studies

Affiliations
Review

Elucidating Transmission Patterns From Internet Reports: Ebola and Middle East Respiratory Syndrome as Case Studies

Gerardo Chowell et al. J Infect Dis. .

Abstract

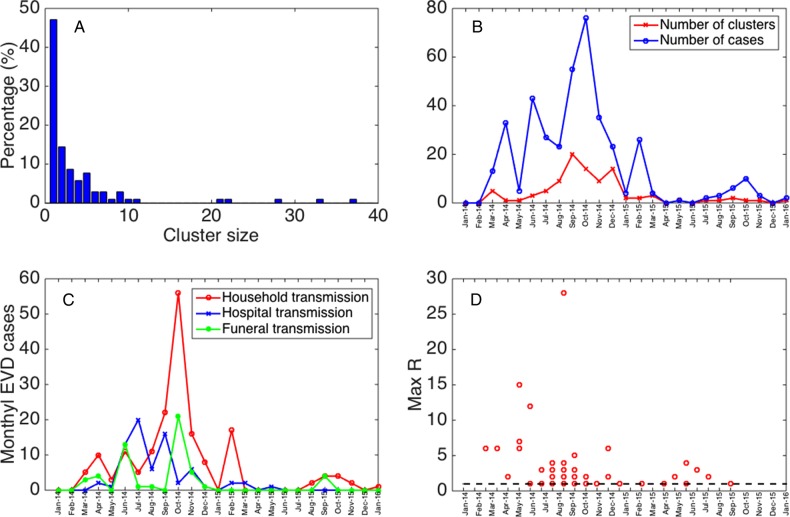
The paucity of traditional epidemiological data during epidemic emergencies calls for alternative data streams to characterize the key features of an outbreak, including the nature of risky exposures, the reproduction number, and transmission heterogeneities. We illustrate the potential of Internet data streams to improve preparedness and response in outbreak situations by drawing from recent work on the 2014-2015 Ebola epidemic in West Africa and the 2015 Middle East respiratory syndrome (MERS) outbreak in South Korea. We show that Internet reports providing detailed accounts of epidemiological clusters are particularly useful to characterize time trends in the reproduction number. Moreover, exposure patterns based on Internet reports align with those derived from epidemiological surveillance data on MERS and Ebola, underscoring the importance of disease amplification in hospitals and during funeral rituals (associated with Ebola), prior to the implementation of control interventions. Finally, we discuss future developments needed to generalize Internet-based approaches to study transmission dynamics.

Keywords: Ebola; Internet data stream; MERS; big data; cluster; contact network; exposure setting; reproduction number; transmission chain; transmission patterns.


Figures

Figure 1.
Figure 1.
Set of representative clusters of Ebola transmission chains extracted from Internet reports. A, Cluster 1 (Supplementary Table 1). In March 2014, the index patient traveled from his village to Conakry to be treated after visiting and infecting a physician. He stayed with family, 4 members of which became ill, and died in the hospital. His body was taken back to the village for a traditional burial, where 3 uncles washed his body and soon became sick. B, Cluster 22 (Supplementary Table 1). During June–September 2014, after the hospital from cluster 5 closed, a Monrovian patient resorted to receiving care from her church caretaker, who then went to a clinic and infected a guard, whom a healthcare worker and father treated. The guard then infected his son, whose mother denied that it was Ebola. This led to the rest of the family becoming infected. C, Cluster 47 (Supplementary Table 1). In October and November 2014, an imam developed symptoms in Guinea and then visited a family in Bamako, Mali. He went to a clinic and died there, infecting a nurse, physician, and all members of the family he stayed with. His body was returned to Guinea, where at least 1 infection occurred from his large traditional funeral. D, Cluster 62 (Supplementary Table 1). From December 2014 to February 2015, all of the cases in Liberia stemmed from one woman, who infected family members, a neighbor, and an herbalist she went to for treatment. During the third generation of secondary cases, contact tracing efforts helped stop further spreading.
Figure 2.
Figure 2.
Characteristics of the Ebola virus disease (EVD) case clusters derived from Internet reports, January 2014–January 2016. A, The distribution of cluster sizes of Ebola cases in our sample of clusters. B, The temporal variation in the number of clusters and total cases reported across clusters. C, The temporal changes in the distribution of Ebola exposures through the family, hospitals, and funerals. D, The temporal variation in the maximum number of secondary cases per case across all disease generations in each of the clusters with available information. The horizontal dashed line at R = 1 is shown for reference.

References

    1. Metcalf CJ, Edmunds WJ, Lessler J. Six challenges in modelling for public health policy. Epidemics 2015; 10:93–6. - PubMed
    1. van Panhuis WG, Paul P, Emerson C et al. . A systematic review of barriers to data sharing in public health. BMC Public Health 2014; 14:1144. - PMC - PubMed
    1. Salathe M, Bengtsson L, Bodnar TJ et al. . Digital epidemiology. PLoS Comput Biol 2012; 8:e1002616. - PMC - PubMed
    1. Brownstein JS, Freifeld CC, Madoff LC. Digital disease detection—harnessing the Web for public health surveillance. N Engl J Med 2009; 360:2153–5, 7. - PMC - PubMed
    1. Salathe M, Khandelwal S. Assessing vaccination sentiments with online social media: implications for infectious disease dynamics and control. PLoS Comput Biol 2011; 7:e1002199. - PMC - PubMed

Publication types

MeSH terms