

Phylogenomic Resolution of the Phylogeny of Laurasiatherian Mammals: Exploring Phylogenetic Signals within Coding and Noncoding Sequences
- PMID: 28830116
- PMCID: PMC5737624
- DOI: 10.1093/gbe/evx147
Phylogenomic Resolution of the Phylogeny of Laurasiatherian Mammals: Exploring Phylogenetic Signals within Coding and Noncoding Sequences
Abstract
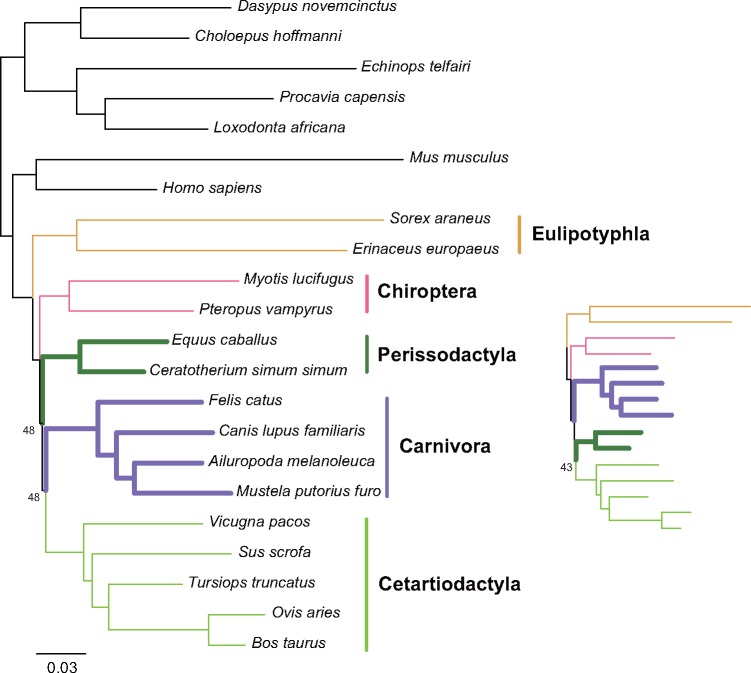
The interordinal relationships of Laurasiatherian mammals are currently one of the most controversial questions in mammalian phylogenetics. Previous studies mainly relied on coding sequences (CDS) and seldom used noncoding sequences. Here, by data mining public genome data, we compiled an intron data set of 3,638 genes (all introns from a protein-coding gene are considered as a gene) (19,055,073 bp) and a CDS data set of 10,259 genes (20,994,285 bp), covering all major lineages of Laurasiatheria (except Pholidota). We found that the intron data contained stronger and more congruent phylogenetic signals than the CDS data. In agreement with this observation, concatenation and species-tree analyses of the intron data set yielded well-resolved and identical phylogenies, whereas the CDS data set produced weakly supported and incongruent results. Further analyses showed that the phylogeny inferred from the intron data is highly robust to data subsampling and change in outgroup, but the CDS data produced unstable results under the same conditions. Interestingly, gene tree statistical results showed that the most frequently observed gene tree topologies for the CDS and intron data are identical, suggesting that the major phylogenetic signal within the CDS data is actually congruent with that within the intron data. Our final result of Laurasiatheria phylogeny is (Eulipotyphla,((Chiroptera, Perissodactyla),(Carnivora, Cetartiodactyla))), favoring a close relationship between Chiroptera and Perissodactyla. Our study 1) provides a well-supported phylogenetic framework for Laurasiatheria, representing a step towards ending the long-standing "hard" polytomy and 2) argues that intron within genome data is a promising data resource for resolving rapid radiation events across the tree of life.
Keywords: Laurasiatheria; data subsampling; intron; noncoding; phylogenomics; phylogeny.
© The Author 2017. Published by Oxford University Press on behalf of the Society for Molecular Biology and Evolution.
Figures


Similar articles
-
Diverse phylogenomic datasets uncover a concordant scenario of laurasiatherian interordinal relationships.Mol Phylogenet Evol. 2021 Apr;157:107065. doi: 10.1016/j.ympev.2020.107065. Epub 2020 Dec 31. Mol Phylogenet Evol. 2021. PMID: 33387649
-
Contradictory Phylogenetic Signals in the Laurasiatheria Anomaly Zone.Genes (Basel). 2022 Apr 26;13(5):766. doi: 10.3390/genes13050766. Genes (Basel). 2022. PMID: 35627151 Free PMC article.
-
Phylogenomic analysis resolves the interordinal relationships and rapid diversification of the laurasiatherian mammals.Syst Biol. 2012 Jan;61(1):150-64. doi: 10.1093/sysbio/syr089. Epub 2011 Sep 7. Syst Biol. 2012. PMID: 21900649 Free PMC article.
-
Summary of Laurasiatheria (mammalia) phylogeny.Dongwuxue Yanjiu. 2012 Dec;33(E5-6):E65-74. doi: 10.3724/SP.J.1141.2012.E05-06E65. Dongwuxue Yanjiu. 2012. PMID: 23266984 Review.
-
Phylogenomics and the Genetic Architecture of the Placental Mammal Radiation.Annu Rev Anim Biosci. 2021 Feb 16;9:29-53. doi: 10.1146/annurev-animal-061220-023149. Epub 2020 Nov 23. Annu Rev Anim Biosci. 2021. PMID: 33228377 Review.
Cited by
-
Exploring Conflicts in Whole Genome Phylogenetics: A Case Study Within Manakins (Aves: Pipridae).Syst Biol. 2023 May 19;72(1):161-178. doi: 10.1093/sysbio/syac062. Syst Biol. 2023. PMID: 36130303 Free PMC article.
-
Evolutionary Rate Variation among Lineages in Gene Trees has a Negative Impact on Species-Tree Inference.Syst Biol. 2022 Feb 10;71(2):490-500. doi: 10.1093/sysbio/syab051. Syst Biol. 2022. PMID: 34255084 Free PMC article.
-
Cross-species transmission of an ancient endogenous retrovirus and convergent co-option of its envelope gene in two mammalian orders.PLoS Genet. 2022 Oct 14;18(10):e1010458. doi: 10.1371/journal.pgen.1010458. eCollection 2022 Oct. PLoS Genet. 2022. PMID: 36240227 Free PMC article.
-
Genome-Scale Profiling Reveals Noncoding Loci Carry Higher Proportions of Concordant Data.Mol Biol Evol. 2021 May 19;38(6):2306-2318. doi: 10.1093/molbev/msab026. Mol Biol Evol. 2021. PMID: 33528497 Free PMC article.
-
Revisiting the four Hexapoda classes: Protura as the sister group to all other hexapods.Proc Natl Acad Sci U S A. 2024 Sep 24;121(39):e2408775121. doi: 10.1073/pnas.2408775121. Epub 2024 Sep 19. Proc Natl Acad Sci U S A. 2024. PMID: 39298489 Free PMC article.
References
-
- Castresana J. 2000. Selection of conserved blocks from multiple alignments for their use in phylogenetic analysis. Mol Biol Evol. 17(4):540–552. - PubMed
-
- Chen MY, Liang D, Zhang P.. 2015. Selecting question-specific genes to reduce incongruence in phylogenomics: a case study of jawed vertebrate backbone phylogeny. Syst Biol. 64(6):1104–1120. - PubMed
-
- Chojnowski JL, Kimball RT, Braun EL.. 2008. Introns outperform exons in analyses of basal avian phylogeny using clathrin heavy chain genes. Gene 410(1):89–96. - PubMed
-
- Dool SE, et al. 2016. Nuclear introns outperform mitochondrial DNA in phylogenetic reconstruction: lessons from horseshoe bats (Rhinolophidae: Chiroptera). Mol Phylogenet Evol. 97:196–212. - PubMed
Publication types
MeSH terms
LinkOut - more resources
Full Text Sources
Other Literature Sources
