

Costs and expected gain in lifetime health from intensive care versus general ward care of 30,712 individual patients: a distribution-weighted cost-effectiveness analysis
- PMID: 28830479
- PMCID: PMC5567919
- DOI: 10.1186/s13054-017-1792-0
Costs and expected gain in lifetime health from intensive care versus general ward care of 30,712 individual patients: a distribution-weighted cost-effectiveness analysis
Abstract
Background: Clinicians, hospital managers, policy makers, and researchers are concerned about high costs, increased demand, and variation in priorities in the intensive care unit (ICU). The objectives of this modelling study are to describe the extra costs and expected health gains associated with admission to the ICU versus the general ward for 30,712 patients and the variation in cost-effectiveness estimates among subgroups and individuals, and to perform a distribution-weighted economic evaluation incorporating extra weighting to patients with high severity of disease.
Methods: We used a decision-analytic model that estimates the incremental cost per quality-adjusted life year (QALY) gained (ICER) from ICU admission compared with general ward care using Norwegian registry data from 2008 to 2010. We assigned increasing weights to health gains for those with higher severity of disease, defined as less expected lifetime health if not admitted. The study has inherent uncertainty of findings because a randomized clinical trial comparing patients admitted or rejected to the ICU has never been performed. Uncertainty is explored in probabilistic sensitivity analysis.
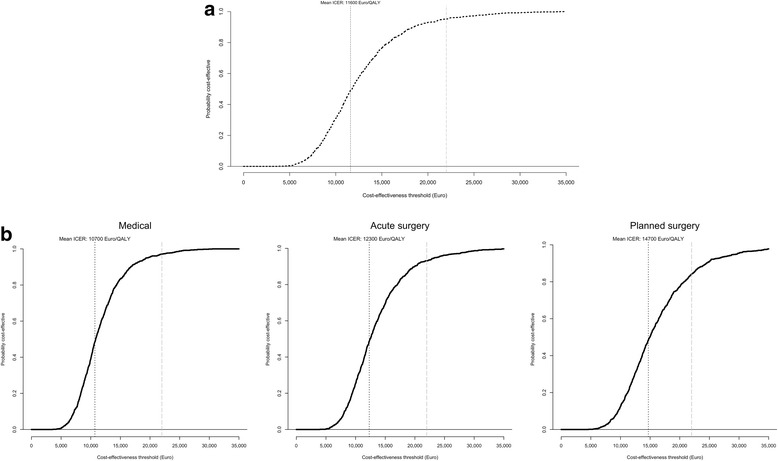
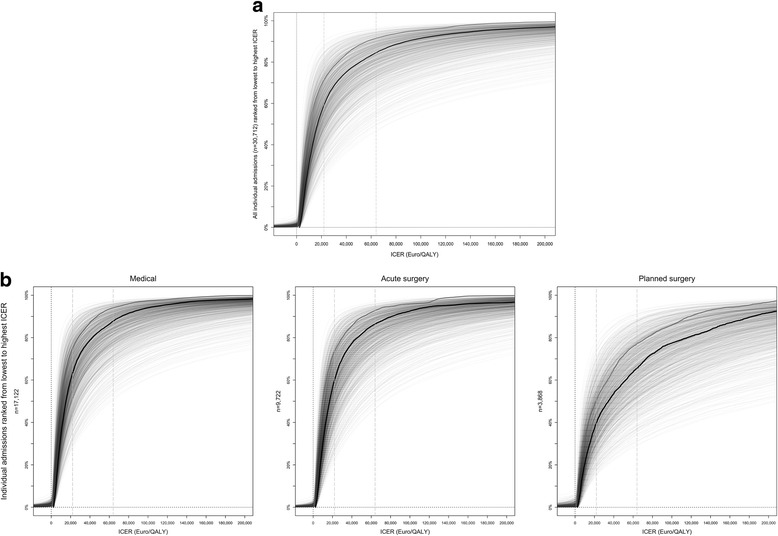
Results: The mean cost-effectiveness of ICU admission versus ward care was €11,600/QALY, with 1.6 QALYs gained and an incremental cost of €18,700 per patient. The probability (p) of cost-effectiveness was 95% at a threshold of €22,000/QALY. The mean ICER for medical admissions was €10,700/QALY (p = 97%), €12,300/QALY (p = 93%) for admissions after acute surgery, and €14,700/QALY (p = 84%) after planned surgery. For individualized ICERs, there was a 50% probability that ICU admission was cost-effective for 85% of the patients at a threshold of €64,000/QALY, leaving 15% of the admissions not cost-effective. In the distributional evaluation, 8% of all patients had distribution-weighted ICERs (higher weights to gains for more severe conditions) above €64,000/QALY. High-severity admissions gained the most, and were more cost-effective.
Conclusions: On average, ICU admission versus general ward care was cost-effective at a threshold of €22,000/QALY (p = 95%). According to the individualized cost-effectiveness information, one in six ICU admissions was not cost-effective at a threshold of €64,000/QALY. Almost half of these admissions that were not cost-effective can be regarded as acceptable when weighted by severity of disease in terms of expected lifetime health. Overall, existing ICU services represent reasonable resource use, but considerable uncertainty becomes evident when disaggregating into individualized results.
Keywords: Cost-effectiveness; Health priorities; Intensive care; Quality-adjusted life years; Resource allocation; Severity of disease.
Conflict of interest statement
Ethics approval and consent to participate
The Data protection officer at Haukeland University Hospital approved the use of anonymous records from the Norwegian Intensive Care Registry (NIR). The regional ethics committee REK Vest has waived approval of this use of anonymous NIR data.
Competing interests
The authors declare that they have no competing interests.
Publisher’s Note
Springer Nature remains neutral with regard to jurisdictional claims in published maps and institutional affiliations.
Figures

References
MeSH terms
LinkOut - more resources
Full Text Sources
Other Literature Sources
