. 2017 Oct 15;77(20):5491-5502.
doi: 10.1158/0008-5472.CAN-17-0925. Epub 2017 Aug 22.

Human Pluripotent Stem Cell-Derived TSC2-Haploinsufficient Smooth Muscle Cells Recapitulate Features of Lymphangioleiomyomatosis

Affiliations

Human Pluripotent Stem Cell-Derived TSC2-Haploinsufficient Smooth Muscle Cells Recapitulate Features of Lymphangioleiomyomatosis

Lisa M Julian et al. Cancer Res. .

Abstract

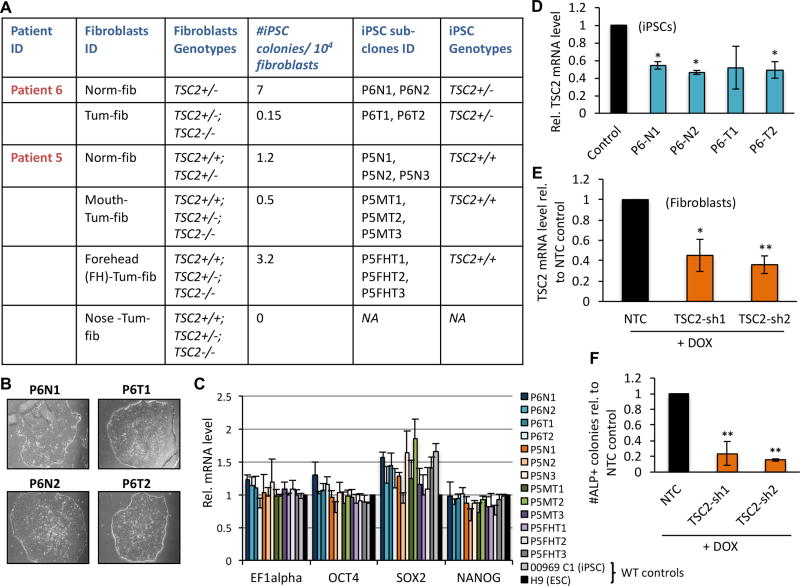
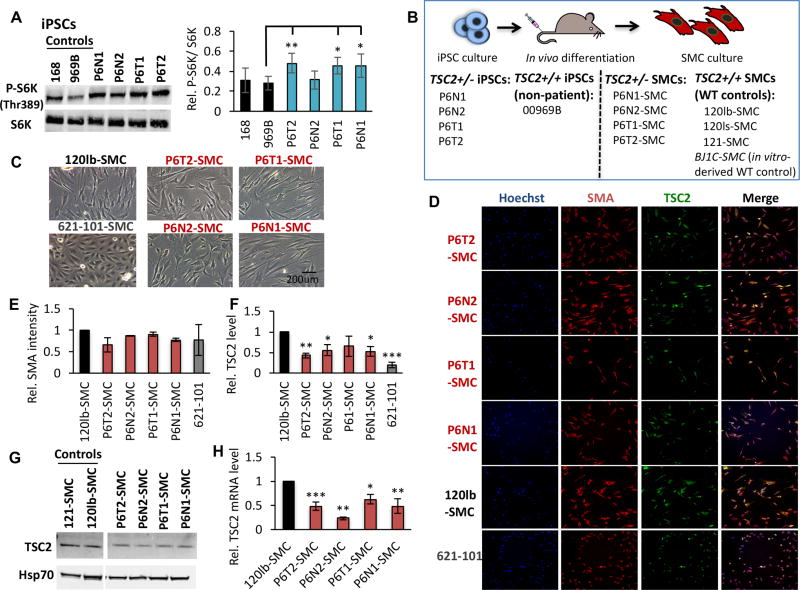
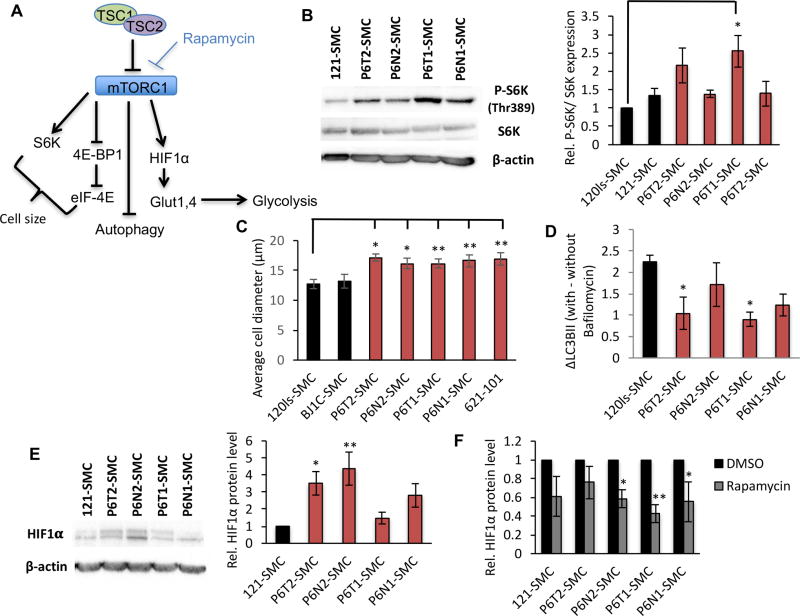
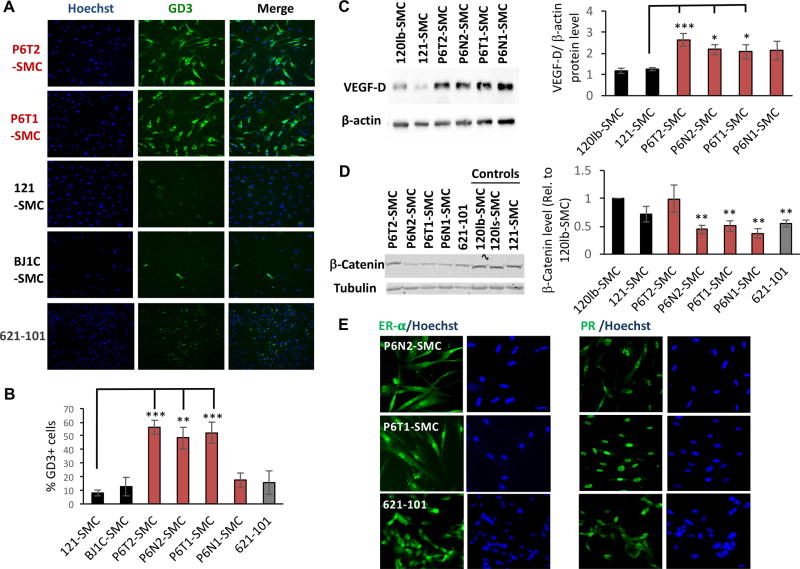
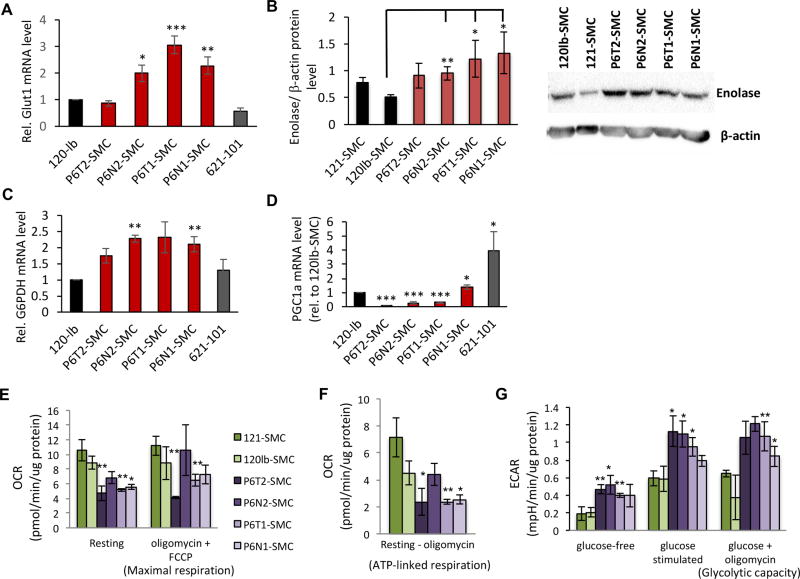
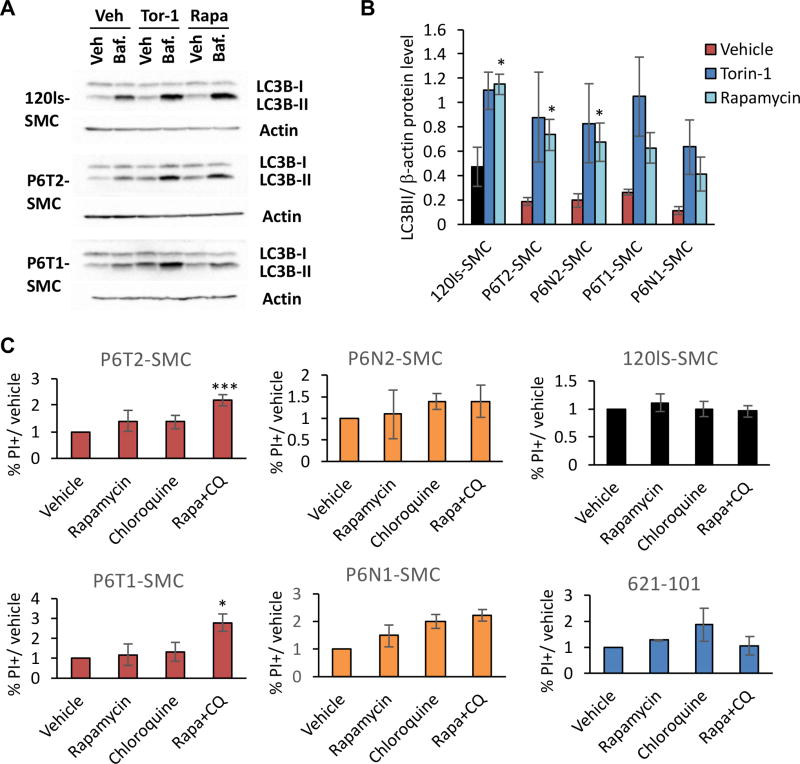
Lymphangioleiomyomatosis (LAM) is a progressive destructive neoplasm of the lung associated with inactivating mutations in the TSC1 or TSC2 tumor suppressor genes. Cell or animal models that accurately reflect the pathology of LAM have been challenging to develop. Here, we generated a robust human cell model of LAM by reprogramming TSC2 mutation-bearing fibroblasts from a patient with both tuberous sclerosis complex (TSC) and LAM (TSC-LAM) into induced pluripotent stem cells (iPSC), followed by selection of cells that resemble those found in LAM tumors by unbiased in vivo differentiation. We established expandable cell lines under smooth muscle cell (SMC) growth conditions that retained a patient-specific genomic TSC2+/- mutation and recapitulated the molecular and functional characteristics of pulmonary LAM cells. These include multiple indicators of hyperactive mTORC1 signaling, presence of specific neural crest and SMC markers, expression of VEGF-D and female sex hormone receptors, reduced autophagy, and metabolic reprogramming. Intriguingly, the LAM-like features of these cells suggest that haploinsufficiency at the TSC2 locus contributes to LAM pathology, and demonstrated that iPSC reprogramming and SMC lineage differentiation of somatic patient cells with germline mutations was a viable approach to generate LAM-like cells. The patient-derived SMC lines we have developed thus represent a novel cellular model of LAM that can advance our understanding of disease pathogenesis and develop therapeutic strategies against LAM. Cancer Res; 77(20); 5491-502. ©2017 AACR.


Figures

Figure 1
Figure 1
TSC2 deficiency inhibits iPSC reprogramming. (A) TSC2 genotypes of patient-derived fibroblasts and derivative iPSC sub-clones used in this study, as well as frequency of iPSC reprogramming of patient-derived fibroblasts. (B) Representative phase contrast images of Patient 6 (P6)-derived iPSC colonies. (C) qRT-PCR analysis of mRNA levels of pluripotency markers (indicated along X-axis) in control and patient-derived iPSC lines, expressed as relative (Rel.) to wild type (WT) H9 ESCs for each indicated gene. (D) qRT-PCR for TSC2 in P6-derived iPSCs relative to non-patient control cell line ‘168’. Relative TSC2 expression (E) and number of alkaline phosphatase (ALP) positive iPSC colonies (F) in 090 fibroblasts carrying TSC2 shRNAs (‘TSC2-sh1’ and ‘TSC2-sh2’) or a scrambled ‘control’ RNA molecule, following Dox-induced shRNA expression. Data in E and F are expressed as relative to scrambled ‘control’ cells. Statistics are relative to the following controls: H9 ESCs (C), 168 iPSCs (D) and scrambled controls (E, F). P values of <0.05 (*), <0.01 (**) are indicated. Three biological replicates were performed for each experiment.
Figure 2
Figure 2
Establishment of TSC/LAM patient-derived SMC lines. (A) Representative western blot analysis and densitometry quantification, expressed as relative to control cell line 969B, of total and phosphorylated (P-S6K, Thr389) S6K in control and P6 iPSC lines. (B) Four P6 iPSC lines (as indicated), and one non-patient WT control iPSC line (969B, as indicated), were injected intramuscularly for in vivo differentiation in teratomas and explants were cultured under SMC growth conditions. The four SMC patient-derived lines and three SMC WT control lines that were established using this approach are indicated. Note we also use a fourth WT control SMC line in this study, BJIC-SMC, which was generated by in vitro differentiation of non-patient iPSCs. Representative phase contrast (C) and high content imaging (HCI) immunofluorescence (smooth muscle actin [SMA], TSC2; D) images of P6-derived, 120lb-SMC control and 621-101 cells. Quantification of HCI images for mean intensity of SMA (E) and TSC2 (F) proteins, expressed as relative to 120lb-SMC controls, as well as western blot for TSC2 (G), in cultured cell lines. (H) TSC2 mRNA expression relative to 120lb-SMCs. Statistics are relative to 969B (A), and 120lb-SMC (E, F, H) controls. P values of <0.05 (*), <0.01 (**) and <0.001 (***) are indicated where statistical differences were observed. A minimum of three biological replicates were performed for each experiment.
Figure 3
Figure 3
Patient-derived SMC lines exhibit hyperactive mTORC1 signaling. (A) Simplified mTORC1 signaling network. (B) Representative western blot for pan-S6K and its T389 phosphorylated form (P-S6K) in SMC lines, and densitometry based quantification expressed as relative to control 120ls-SMCs. Average diameter of cells (C) and change in LC3B-II levels with or without bafilomycin A1 (D) in SMC lines. (E) Western blot for HIF1α (left panel) and densitometry-based quantification (right panel) expressed as relative to 121-SMC control. (F) Densitometry-based quantification of western blots for HIF1α expression in SMC lines in the presence of DMSO (vehicle) or rapamycin, expressed as relative to the DMSO condition for each cell line. Statistics are relative to 120ls-SMC (B, C, D), 121-SMC (E), and DMSO condition (F) (t-test). P values of <0.05 (*) and <0.01 (**) are indicated. A minimum of three biological replicates were performed for each experiment.
Figure 4
Figure 4
Patient-derived SMCs exhibit known LAM cell biomarkers. (A) HCI for ganglioside D3 (GD3) and Hoechst nuclear stain in control (121-SMC, BJ1C-SMC), P6-SMC, and 621-101 cell lines, with representative quantification (B). (C) Representative western blots and densitometry quantification (expressed as VEGF-D levels normalized to β-actin expression) for VEGF-D in P6-SMC and control (120lb-SMC, 121-SMC) lines. (D) Representative western blots and densitometry quantification (normalized to tubulin and expressed as relative to 120lb-SMC control) for β-Catenin in P6-SMC and control (120lb-SMC, 120ls-SMC, 121-SMC) lines. (E) Representative immunofluorescence images for estrogen receptor alpha (ER-α) and progesterone receptor (PR), and the corresponding Hoechst images, in P6-SMC lines and 621-101 cells. Statistics are relative to 121-SMC (B, C), and 120lb-SMC (D) controls. P values of <0.05 (*), <0.01 (**) and <0.001 (***) are indicated. A minimum of four and up to seven biological replicates were performed for each experiment.
Figure 5
Figure 5
TSC2+/− SMCs exhibit metabolic reprogramming to a glycolytic state. (A) qRT-PCR analysis of GLUT1 expression in SMC lines and 621-101 cells, expressed as relative to 120lb-SMC control. (B) Representative western blot (lower panel) and densitometry-based quantification (upper panel) of enolase expression (plotted are enolase levels normalized to β-actin levels) in SMC lines. qRT-PCR analysis of G6PDH (C) and PGC1a (D) expression in SMC lines (expressed as relative to 120lb control cells). Statistics for A–D are relative to the 120lb-SMC control line. Oxygen consumption rate (OCR) measurements under resting and maximal respiratory conditions (E), and the difference between OCR levels at resting state and following exposure to oligomycin to indicate ATP turnover (F). Extracellular acidification rate (ECAR) under glucose-free and maximal (+glucose, +oligomycin) conditions (G). For E–G, control (green bars) and P6-derived (purple bars) SMC lines are normalized to total protein as indicated. Statistics are relative to the average of the two control lines. P values of <0.05 (*), <0.01 (**) and <0.001 (***) are indicated. t-tests were performed for panels B and G. A minimum of three biological replicates were performed for each experiment.
Figure 6
Figure 6
Selective toxicity of TSC-LAM patient SMCs by dual targeting of mTORC1 and autophagy signaling. (A) Representative western blots of LC3B-I and LC3B-II levels in control (120ls-SMCs) and P6-derived SMC lines to depict LC3B-II accumulation in vehicle versus +bafilomycin A1 conditions, and the corresponding response to mTOR inhibitors torin-1 and rapamycin. (B) Basal levels of LC3B-II, based on densitometry quantification of western blots and normalized to β-actin levels, in SMC lines under vehicle, torin-1 or rapamycin treatment. Statistics are relative to vehicle. (C) % of cells positive for propidium iodide (PI) relative to vehicle for each cell line, following a 24 hr treatment with 2.5 µM chloroquine (CQ), 20 nM rapamycin, or both. Measurements were collected via flow cytometry. P values of <0.05 (*) and <0.001 (***), obtained by t-test, are indicated. Three biological replicates were performed for each experiment and treatment condition.

References

    1. Delaney SP, Julian LM, Stanford WL. The neural crest lineage as a driver of disease heterogeneity in Tuberous Sclerosis Complex and Lymphangioleiomyomatosis. Front Cell Dev Biol. 2014;2:69. - PMC - PubMed
    1. Henske EP, Jozwiak S, Kingswood JC, Sampson JR, Thiele EA. Tuberous sclerosis complex. Nat Rev Dis Primers. 2016;2:16035. - PubMed
    1. Grzegorek I, Lenze D, Chabowski M, Janczak D, Szolkowska M, Langfort R, et al. Immunohistochemical evaluation of pulmonary lymphangioleiomyomatosis. Anticancer Res. 2015;35:3353–60. - PubMed
    1. Henske EP, McCormack FX. Lymphangioleiomyomatosis - a wolf in sheep's clothing. J Clin Invest. 2012;122:3807–16. - PMC - PubMed
    1. Gao L, Yue MM, Davis J, Hyjek E, Schuger L. In pulmonary lymphangioleiomyomatosis expression of progesterone receptor is frequently higher than that of estrogen receptor. Virchows Archiv. 2014;464:495–503. - PubMed

Publication types

LinkOut - more resources