

Tracking of BMI z Scores for Severe Obesity
- PMID: 28830920
- PMCID: PMC5574726
- DOI: 10.1542/peds.2017-1072
Tracking of BMI z Scores for Severe Obesity
Abstract
Background: Although the Centers for Disease Control (CDC) growth charts are widely used in studies of childhood obesity, BMI z scores are known to be inaccurate at values greater than the 97th percentile.
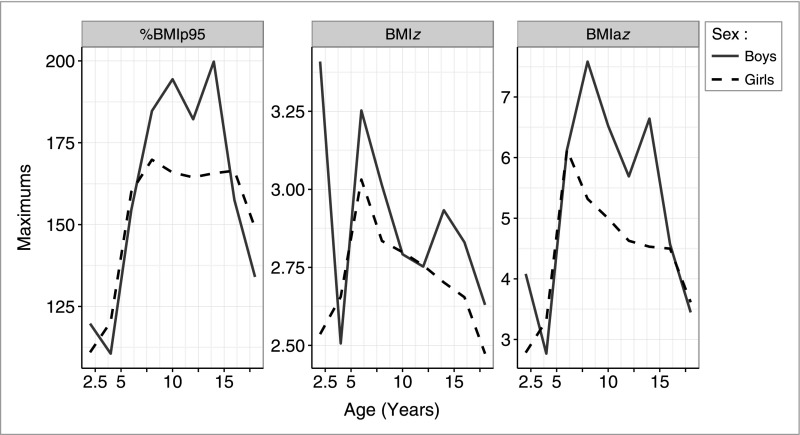
Methods: We used longitudinal data from 6994 children in the Bogalusa Heart Study who were examined multiple times to compare tracking of 3 BMI metrics: BMI-for-sex/age z score (BMIz), BMI expressed as a percentage of the 95th percentile (%BMIp95), and levels of BMI z score that adjust for the compression of very high z scores (adjusted z score [BMIaz]). The later 2 metrics, unlike BMIz, do not have an upper limit. The mean interval between examinations was 2.8 years. We were particularly interested in these metrics among children with obesity or severe obesity (%BMIp95 ≥120%).
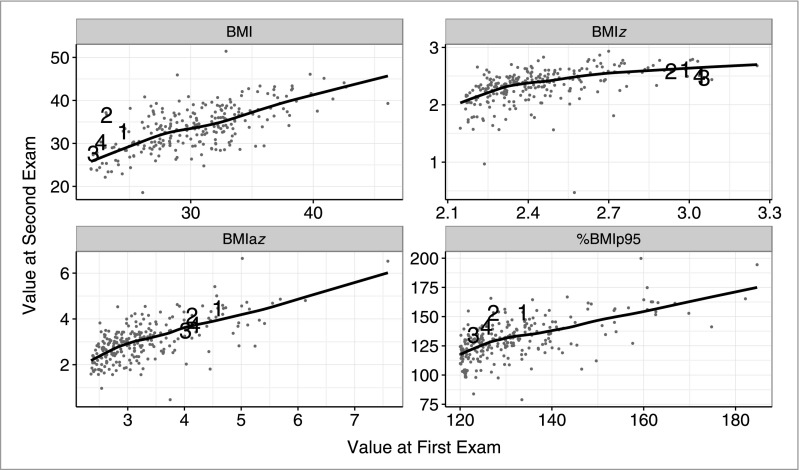
Results: Although there was little difference in the tracking of the 3 metrics in the overall sample, among 247 children with severe obesity, the correlation of BMIz levels between examinations (r = 0.46) was substantially weaker than those for BMIaz and %BMIp95 (r = 0.65 and 0.61). Age-stratified analyses indicated that the weak tracking of BMIz was particularly evident before the age of 10 years (r = 0.36 vs 0.57 and 0.60). Several children with severe obesity showed BMIz decreases between examinations despite having BMI increases of over 5.
Conclusions: Among children with severe obesity, the tracking of BMIz is weak. This is because of the constraints in converting very high BMIs into z scores based on the CDC growth charts. Rather than using BMIz, it would be preferable to express very high BMIs relative to the CDC 95th percentile or to use BMIaz.
Copyright © 2017 by the American Academy of Pediatrics.
Conflict of interest statement
POTENTIAL CONFLICT OF INTEREST: The authors have indicated they have no potential conflicts of interest to disclose.
Figures
References
-
- Kuczmarski RJ, Ogden CL, Guo SS, et al. . 2000 CDC growth charts for the United States: methods and development. Vital Health Stat 11. 2002;11(246):1–190 - PubMed
-
- Ogden CL, Kuczmarski RJ, Flegal KM, et al. . Centers for Disease Control and Prevention 2000 growth charts for the United States: improvements to the 1977 National Center for Health Statistics version. Pediatrics. 2002;109(1):45–60 - PubMed
-
- Flegal KM, Cole TJ. Construction of LMS parameters for the Centers for Disease Control and Prevention 2000 growth charts. Natl Health Stat Rep. 2013;9(63):1–3 - PubMed
-
- Cole TJ. The LMS method for constructing normalized growth standards. Eur J Clin Nutr. 1990;44(1):45–60 - PubMed
-
- Cole TJ, Green PJ. Smoothing reference centile curves: the LMS method and penalized likelihood. Stat Med. 1992;11(10):1305–1319 - PubMed
MeSH terms
Grants and funding
LinkOut - more resources
Full Text Sources
Other Literature Sources
Medical
