

Joining smallholder farmers' traditional knowledge with metric traits to select better varieties of Ethiopian wheat
- PMID: 28831033
- PMCID: PMC5567301
- DOI: 10.1038/s41598-017-07628-4
Joining smallholder farmers' traditional knowledge with metric traits to select better varieties of Ethiopian wheat
Erratum in
-
Erratum: Joining smallholder farmers' traditional knowledge with metric traits to select better varieties of Ethiopian wheat.Sci Rep. 2017 Oct 12;7(1):13076. doi: 10.1038/s41598-017-12288-5. Sci Rep. 2017. PMID: 29026103 Free PMC article.
Abstract
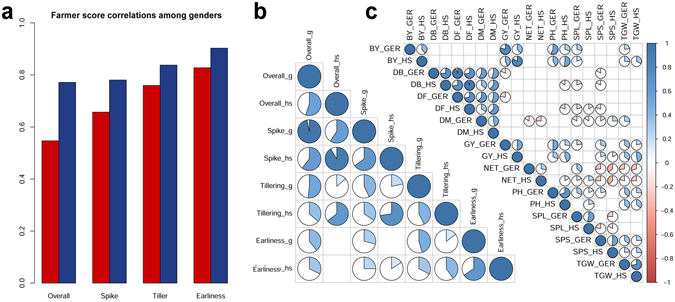
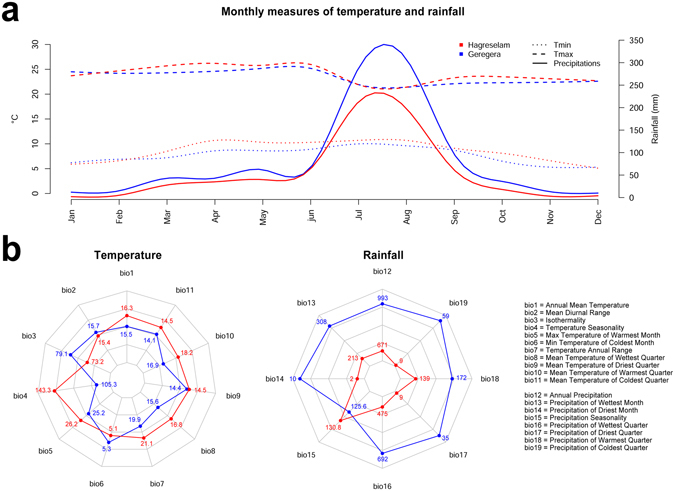
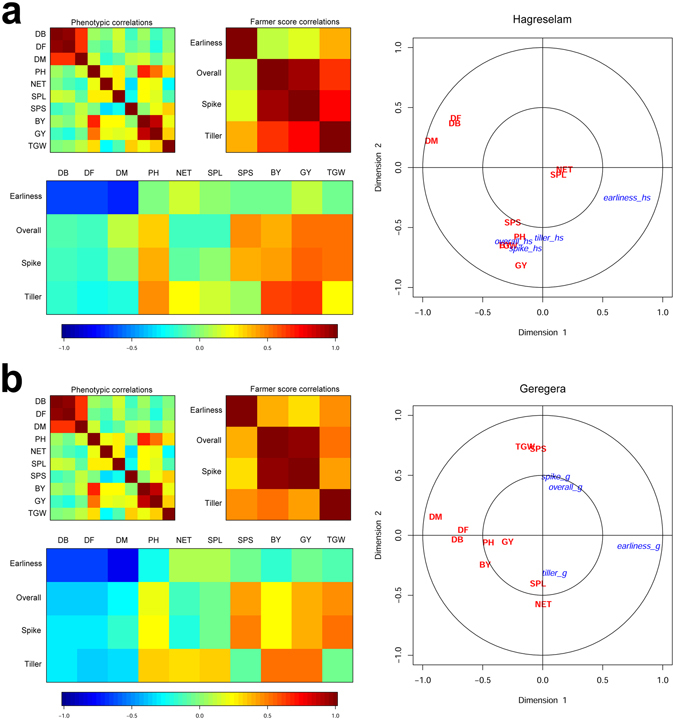
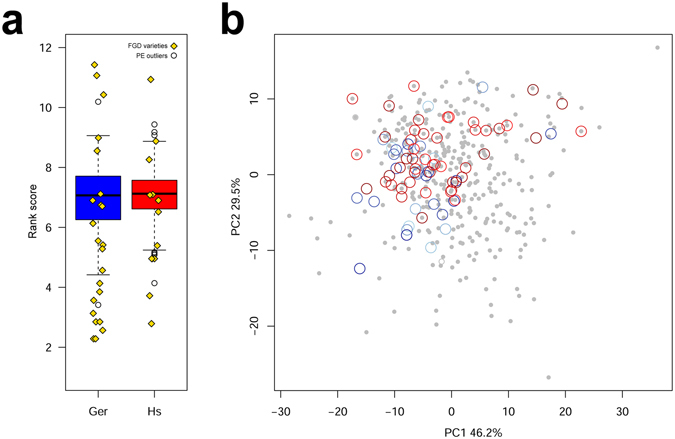
Smallholder farming communities face highly variable climatic conditions that threaten locally adapted, low-input agriculture. The benefits of modern crop breeding may fail to reach their fields when broadly adapted genetic materials do not address local requirements. To date, participatory methods only scratched the surface of the exploitability of farmers' traditional knowledge in breeding. In this study, 30 smallholder farmers in each of two locations in Ethiopia provided quantitative evaluations of earliness, spike morphology, tillering capacity and overall quality on 400 wheat genotypes, mostly traditional varieties, yielding altogether 192,000 data points. Metric measurements of ten agronomic traits were simultaneously collected, allowing to systematically break down farmers' preferences on quantitative phenotypes. Results showed that the relative importance of wheat traits differed by gender and location. Farmer traits were variously contributed by metric traits, and could only partially be explained by them. Eventually, farmer trait values were used to produce a ranking of the 400 wheat varieties identifying the trait combinations most desired by farmers. The study scale and methods lead to a better understanding of the quantitative basis of Ethiopian smallholder farmer preference in wheat, broadening the discussion for the future of local, sustainable breeding efforts accommodating farmers' knowledge.
Conflict of interest statement
The authors declare that they have no competing interests.
Figures
Comment in
-
Train artificial intelligence to be fair to farming.Nature. 2017 Dec 21;552(7685):334. doi: 10.1038/d41586-017-08881-3. Nature. 2017. PMID: 29293217 No abstract available.
References
-
- Lowder, S. K., Skoet, J. & Singh, S. What do we really know about the number and distribution of farms and family farms in the world. Backgr. Pap. State Food Agric. 8 (2014).
-
- Funk, C. et al. Estimating Meher crop production using rainfall in the ‘long cycle’region of Ethiopia. FEWS NET Special Reporthttp://reliefweb.int/sites/reliefweb.int/files/resources/E8CC76E0F907A5B... (2003).
-
- Tilman D. The greening of the green revolution. Nature. 1998;396:211–212. doi: 10.1038/24254. - DOI
-
- Ceccarelli, S. Specific adaptation and breeding for marginal conditions in Breeding Fodder Crops for Marginal Conditions (ed. Rognli O. A.) 101–127 (Springer, 1994).
Publication types
LinkOut - more resources
Full Text Sources
Other Literature Sources
